Locating Unreported Leaks with Modelling
Tools and Pressure Monitoring: a Case Study
Luísa Ribeiro
1,4, Joaquim Sousa
1,4, João Muranho
2,4and A. Sá Marques
3,41 Coimbra Polytechnic - ISEC, Department of Civil Engineering, 3030-199 Coimbra, Portugal 2 University of Beira Interior, Department of Computer Science, 6201-001 Covilhã, Portugal
3 University of Coimbra, Department of Civil Engineering, 3030-788 Coimbra, Portugal 4 INESC Coimbra, Rua Sílvio Lima, 3030-290 Coimbra, Portugal
luirenco@isec.pt
Abstract
Water losses are a major concern for water companies, mostly due to their economical, technical, social and environmental negative impacts.
Unreported leaks are a major cause of water losses in water distribution networks (WDNs) and they are difficult to locate, particularly in plastic pipes, large diameters and low pressure conditions. The location of these leaks is very time consuming and requires specialized human resources, using sophisticated and costly acoustic equipment.
The use of modelling and optimization tools, supported by flow and pressure measurements, is showing to be a challenging alternative to the traditional procedure. This paper presents the application of the methodology proposed in Ribeiro L. S., 2012; Ribeiro L. S., 2015; Sousa, 2015 to a real WDN, highlighting the major difficulties faced when dealing with real world conditions, namely gathering and checking data, and building and calibrating the water distribution model.
The results obtained in this case study show that this approach is very promising, encouraging future applications and developments.
1 Introduction
Water losses exist in all WDNs and are a major concern for water companies concerned with their negative impacts: economic losses, technical and social problems, environmental damages and difficulties in guaranteeing the water quality safety.
Water losses include apparent losses and real losses. Real losses correspond to the volume lost on tank overflows and through all types of leaks and bursts on mains and service connections, up to the point of customer metering (Lambert, 1999). Unreported leaks (mains and service connections) are a major cause of real losses as they correspond to the water lost during 24 hours of every day.
Volume 3, 2018, Pages 1758–1765
HIC 2018. 13th International Conference on Hydroinformatics
In the literature, numerous papers have contributed to the location of unreported leaks (Pudar, 1992): considering pressure-driven analysis (Giustolisi, 2008; Wu Z. S., 2010) or demand-driven analysis (Ribeiro L. S., 2015; Wu Z. S., 2006).
Unreported leaks are difficult to locate, particularly in plastic pipes, large diameters and low pressure conditions. Traditionally, the exact location of unreported leaks is very time consuming and requires specialized human resources, using sophisticated and costly acoustic equipment. Monitoring of the Minimum Night Flow (MNF) is a quick way to estimate the unreported leaks flow because customer demand tends to be minimal at night. Simultaneously, the pressure in the WDN tends to stabilize near its maximum value due to the small flow, mostly caused by unreported leaks.
The use of modelling and optimization tools, supported by flow and pressure measurements, is showing to be a challenging alternative to the traditional procedure. Following previous works (Ribeiro L. S., 2012; Ribeiro L. S., 2015; Sousa, 2015), this paper presents the application of the proposed methodology to a real WDN. The methodology requires monitoring the water distribution tank (level and flow) and some specific locations in the network (pressure) during the night period. A WDN calibrated model (based on steady state equations) relates pressure and flow for different scenarios, and an optimization tool (Simulated Annealing algorithm) is used to identify the most probable leaky pipes.
The next section describes the methodology and presents the computer application. Details of the case study are shown in section 3. Finally, in section 4 some conclusions are outlined, the capability of the methodology is illustrated and emphasis is given to the major difficulties faced when dealing with real world conditions, namely gathering and checking data, and building and calibrating the WDN model.
2 Methodology to Identify the Most Probable Leaky Pipes
This section presents the methodology to identify the most probable leaky pipes in a WDN. The proposed methodology uses two tools: a modelling tool to simulate the WDN hydraulic behaviour under different leak scenarios and an optimization tool to identify the locations and estimate the flows of the leaks.
The modelling tool needs the WDN data (topology, asset characteristics, elevations and demands). The calibration of the WDN model (pipe roughness and node demand) is a critical stage independently of the final purpose for the model. It also needs continuous monitoring of the flow and water level in the tank to produce an accurate model.
The optimization tool requires the results of the modelling tool and pressure measurements in some strategic nodes in the WDN. Due to local limitations, few locations can be equipped with pressure sensors.
The continuous monitoring of the tank flow allows the identification of the MNF. The continuous monitoring of the node pressure allows the association of the pressure at the monitored nodes in that period. During the MNF period consumption is minimal, the pressure along the WDN is close to its maximum value and leakage flows are also near its maximum. During the MNF period it is common to assume that the flow is totally due to unreported leaks (unless there are any night consumers, which should also be monitored). This flow is divided in a certain number of possible leaks which are assigned to some pipes. The methodology uses a hydraulic steady state model that relates node pressures and pipes flow using energy and continuity equations and the resistance laws in pipes to simulate the WDN hydraulic behaviour.
Modern heuristics, like Simulated Annealing, are very useful tools to solve difficult problems. In the present case, the problem is to find the location of the leaks with a minimal predetermined flow.
To estimate the position of the leaks at MNF period, an objective function is used to minimise the differences between calculated pressures (estimate) and measured ones (real).
After the modelling and optimization analysis, the results highlight the most probable leaky pipes with their leakage flows. Previous experience applying this methodology shows that most of the times the pipes identified have a leak and sometimes they are adjacent to the really leaky pipes.
After analysing the results of the methodology, the human intervention in the field with specialized equipment and trained staff can then be planned. The field intervention effort will be focused towards specific pipes, and this can be a great contribution to increase the efficiency of active leakage control.
This paper presents the application of the proposed methodology to a real WDN, highlighting the major difficulties faced when dealing with real world conditions, namely gathering and checking data, and building and calibrating the WDN model.
2.1 Optimization Tool and Modelling Tool
The methodology developed is implemented in a computer application. The goal of the methodology is to identify the most probable leaky pipes and this is achieved by exchanging information between the modelling tool and the optimization tool.
The optimization tool has an objective function and uses the simulated annealing algorithm to solve the problem. The modelling tool has a hydraulic simulation model.
2.1.1. Objective Function
The objective function (equation 1) minimizes the difference between measured and correspondent estimated pressures for all monitored node (𝑃𝑆_𝑁):
𝑀𝑖𝑛_𝐹(𝑋) = 𝑀𝑖𝑛 ∑ ./012 3 4567895: − /012 3 57<346<5: . =>_? 3@A (1)
2.1.2. Simulated Annealing Algorithm
The process starts at a certain initial temperature (a control parameter). For the initial solution the number of possible leaks is defined and the MNF is divided into equal parts, which are assigned to different pipes.
The WDN modelling is performed and the results are passed to the optimization tool to assess the value of the objective function. The procedure continues by randomly generating new candidate solutions (different leak locations and flows), which can be accepted or rejected by applying the Metropolis criteria. After a few attempts, the temperature is decreased and the process continues until the stopping criterion is reached. Table 1 comprises details for the simulated annealing algorithm implementation.
Part of the algorithm Implementation Initial solution (𝑋B) Total leakage flow is split and assigned to pipes Initial temperature (𝑇𝑞𝑡_𝑖𝑛𝑖𝑐𝑖𝑎𝑙) 𝑇𝑞𝑡3I3J36K= −0.1 𝐹(𝑋B) 𝐿𝑜𝑔(0.5) Control parameters If Pa > 80% Tqt i+1 = 0.6 Tqti IAi+1 =40 If Pa > 50% Tqti+1 = 0.75 Tqti IAi+1 =60 If Pa > 20% Tqti+1 = 0.9 Tqti IAi+1 =80 If Pa ≤ 20% Tqti+1 = 0.95 Tqti IAi+1=100 Number of evaluations at each
temperature (𝑇𝑞𝑡3)
IAi × Number of pipes in the network
Stopping criteria Pa < 5% and 2 temperatures without solution improvement
Table 1: Simulated annealing algorithm implementation
2.1.3. Hydraulic Simulation Model
At the MNF, water demand is very low and is less uncertain. The WDN hydraulic behaviour is studied assuming steady state conditions. The energy and continuity equations are solved by the Newton-Raphson method. The node equations implicitly ensure the continuity and the energy laws. The head losses were estimated using the Hazen- Williams formula (equation 2):
∆𝐻3U= 10.674
YZ[\Z[].^_`
abcZ[].^_`dZ[e.^f (2)
The methodology described was implemented as a computer application. The WDN is represented by a calibrated model. A local campaign was organized to collect the relevant data. The methodology uses data occurred during the MNF period.
The final results of the methodology highlight the leaky pipes and estimate their leakage flows.
3 Case Study
The real WDN has one tank (66.0 m). This WDN supplies water to about 3,100 inhabitants. The network has 150 junction nodes and 160 pipes. The total length of the network is near 20 km, with topographic elevations of nodes between 3.9 m and 45.5 m. During a week, four pressure sensors (PS) were installed in the network; the tank flow was monitored as well as the tank water level.
The tank guaranteed the MNF of 2.2 L/s and the peak flow of 13.65 L/s.
The actual number of leaks is unknown. So it was assumed that the total leak flow could be allocated to ten different locations. With this high number of possible locations, the methodology is free to search for the correct number of leaks and respective flows.
Figure 1 presents the WDN with the location of pressure sensors.
For different nights or hours, with slightly different MNFs, the methodology identified repeatedly the same pipes as having leaks. It is important to notice that the pipes with higher leakage flows were easier to identify than the pipes with lower leak flows. This fact is important because increases the benefits associated with the leak repair and the leakage control.
Figure 1: Representation of the WDN with four pressure sensors locations.
The telemetry system saved the measurements from the flowmeter and the water level sensor installed. Figure 2 shows the WDN demand profile for a series of eight days.
Pressure sensors saved the pressure evolution in their locations and the tank water level was monitored during the same period of time. After collecting and treating data, the MNF was isolated for each night, with the correspondent tank water level and the associated pressures at the network.
Figure 2: WDN demand profile.
A major concern is the effective number of leak locations in the WDN. Ten different leak locations with the same flow were admitted. This hypothesis allowed a detailed analysis of the network behaviour. The methodology, namely the optimization analysis, was able to search for the appropriate number of leaks and its flows.
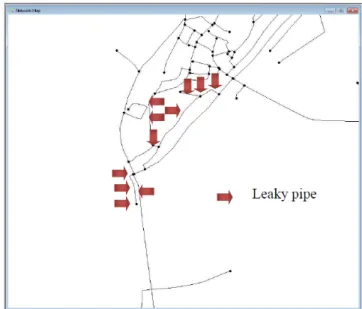
Figure 3: Locations of unreported leaky pipes identified with the methodologies.
Figure 3 highlights the area with more problems and the pipes identified by the methodology as having leaks. It is a small part of the network, in a residential area.
After a leak survey, with acoustic equipment, the leaky pipes identified were checked. The water company confirmed the presence of four leaky pipes in the area. Two of them were correctly identified by the methodology, one was very close to the pipes identified and a fourth pipe belonging to the same loop of the pipes identified as leaky pipes (Figure 4).
After the repairing activities the MNF was no totally recovered. This fact could reflect the arising of new leaky pipes as a consequence of the repairing activities (opening and closing valves).
With a more realistic prediction of the flow in the repaired pipes that had leaks (2.0 L/s equals the total leak flow), the methodology was used for a second time. The second day (27-05-17) had the major value of MNF (3.233 L/s) and was used to perform new analyses.
This second approach admitted the existence of five additional unreported leaks. All leaks were equal, with the same flow, totalizing 1.233 L/s. The hydraulic model incorporated the known leaky pipes and the associated leak flows represented in Figure 4.
Figure 5 presents the new solution of the methodology. The methodology identified in the second model four independent leaky pipes (one pipe had a leak with duplicated flow). Final results pointed a pipe without consistency. The three pipes identified most frequently in the final results of the second model are represented in Figure 5. It identified the pipe linking the tank to the network, which is a pipe continuously monitored and without leaks. The others two options for leaky pipes were checked with acoustic equipment and in one of the pipes an unreported leak was identified.
Figure 5: Location of unreported leaky pipes confirmed with acoustic equipment after introducing the leak
flows represented in Figure 4.
4 Conclusions
Unreported leaks are a concern for water companies and are very difficult to locate. The case study highlighted the benefits of using a computer application to locate leaky pipes.
Firstly, it was proved that a short monitoring campaign can assess the overall behaviour of the WDN. This assessment can rank areas were intervention is more needed and can provide a bigger
Secondly the MNF monitoring was very useful to estimate the unreported leakage flow. The MNF can be easily identified with measurements saved on a telemetry system. The MNF proved to be mostly caused by unreported leaks in the case study area.
Thirdly, the methodology was able to overcome the technical limitations imposed by data and measurements uncertainties and the stochastic nature of the optimization method. The methodology also surpassed typical real world problems, like gathering and checking data and building and calibrating the WDN model.
The small number of pressure sensors, located on appropriate nodes during a short period of time, was suitable for gathering relevant data to introduce in the methodology.
Looking at the final results, the main conclusion is that the methodology produced quite accurate solutions, identifying correctly the most probable leaky pipes in the WDN, giving a significant contribution to increase the efficiency of active leakage control activities. The leaky pipes identified were close to the real pipes with unreported leaks. So the pipes highlighted by the methodology are ideally good elements to start the leak search with acoustic equipment.
The main disadvantage of the methodology is its dependence on the WDN simulation model which has to be very accurate.
References
Giustolisi, O. S. (2008). Pressure-driven demand and leakage simulation for water distribution networks. Journal of Hydraulic Engineering 134, pp. 626-635.
Lambert, A. B. (1999). A review of performance indicators for real losses from water supply systems.
Journal of Water Supply Research and Technology 48-6, pp. 227-237.
Pudar, R. L. (1992). Leaks in pipe networks. Journal of Hydraulic Engineering 118-7, pp. 1031-1046. Ribeiro, L. S. (2012). Improving the efficiency of leak location via optimal pressure sensor placement
in water distribution networks. Water Utility Journal 4, pp. 3-12.
Ribeiro, L. S. (2015). Locating leaks with TrustRank algorithm support. Water 7-4, pp. 1378-1401. Sousa, J. R. (2015). Locating leaks in water distribution networks with simulated annealing and graph
theory. Procedia Engineering 119, pp. 63-71.
Wu, Z. S. (2006). Water loss detection via genetic algorithm optimization-based model calibration.
ASCE 8th Annual International Symposium on Water Distribution System Analysis (pp.
1-11). Cincinnati, Ohio, USA: ASCE.
Wu, Z. S. (2010). Pressure-dependent leak detection model and its application to a district water system. Journal of Water Resources Planning and Management 136-1, pp. 116-128.