Copyright © 2015 Vilnius Gediminas Technical University (VGTU) Press http://www.tandfonline.com/TsPm
IdentIfyIng Key determInants of HoUsIng saLes and
tIme-on-tHe-marKet (tom) UsIng fUzzy CognItIve mappIng
fernando a. f. ferreIra a, b, *, marjan s. JaLaLI aa ISCTE Business School, BRU-IUL, University Institute of Lisbon, Avenida das Forças Armadas, 1649-026 Lisbon, Portugal
b Fogelman College of Business and Economics, University of Memphis, Memphis, TN 38152-3120, USA Received 7 September 2013; accepted 9 September 2014
aBstraCt. Price and residential housing attributes have long been identified as key determinants
of home sales and, as such, they can explain time-on-the-market (TOM). It is acknowledged, however, that there are other factors (or determinants) that influence home sales and TOM, which are of great importance but seldom taken into account in the appraisal process of residential real estate. Based on the use of fuzzy cognitive mapping, we propose a framework that adds value to the way that key deter-minants of housing sales and TOM are identified. This framework is the result of a process involving several residential real estate experts (i.e. appraisers and realtors), and follows a constructivist ap-proach. Our findings suggest that the use of fuzzy cognitive maps (FCMs) allows the number of omitted determinants to be reduced and the understanding of the relationships between them to be improved. The strengths and weaknesses of our methodological framework are also discussed.
KeyWords: Real estate; Housing sales; Time-on-the-market; Fuzzy cognitive maps; Operational
research
1. IntrodUCtIon
Understanding the conditions of the residential housing market and the key attributes that deter-mine home sales and the time taken to sell a prop-erty, broadly known as time-on-the-market (TOM) (cf. Cheng et al. 2008), is crucial in facilitating a timely and mutually beneficial sale. Price and housing attributes, in this sense, are fundamental to the success of realtors and sellers in their goal of finding a buyer, and have both long been iden-tified as key determinants of housing sales and TOM (Leung et al. 2002; Cheng et al. 2010). It is worth noting, however, that these two factors (i.e. price and housing attributes) are not isolated, and that there are other determinants that influence residential real estate transactions (cf. Bourassa
et al. 2003; McGreal et al. 2009; Hui et al. 2012).
Residential real estate valuation and TOM deviate due to the variety of determinants that affect them. Despite the remarkable progress of current methodologies (e.g. hedonic modeling,
repeated-sales methods and other mass appraisal techniques), each approach to valuation and TOM has specific limitations, requiring the clarification of a number of issues. Ferreira et al. (2012) ar-gue, for example, that further developments are still required in terms of criteria identification on a more transparent (and complete) basis. Kauko (2010: 191) defends that “academic work on
defin-ing the relevant indicators is yet speculative, due to a shortage of standard definitions and relevant data”. From this premise, and taking into account
that fuzzy cognitive mapping has proven very use-ful in handling this type of limitation (cf. Carlucci
et al. 2013; Gavrilova et al. 2013), there appears
considerable scope to explore its applicability in the particular context of this study.
In this paper, we use fuzzy cognitive maps (FCMs) to support the identification of key deter-minants of housing sales and TOM. According to Carlucci et al. (2013: 208), “FCM is a
well-estab-lished artificial intelligence technique, incorporat-ing ideas from artificial neural networks and fuzzy logic, which can be effectively applied in the domain
2015 Volume 19(3): 235–244 doi:10.3846/1648715X.2015.1052587
* Corresponding author. e-mail: [email protected]; [email protected]
of management science”. This methodological
framework may be used to strengthen current valuation approaches because it helps reduce the number of omitted determinants and allows the understanding of the relationships between them to be improved. Therefore, the main objective of our study is to show that the use of fuzzy cognitive mapping can give rise to a conceptually coherent and empirically valid framework to forecast TOM. Specifically, our aim is to build a cognitive map, in particular a FCM, to model, dynamically ana-lyze and test the reciprocal influence of key deter-minants of housing sales and TOM. This means that we will try to identify the factors that deter-mine TOM and their causal relationships, includ-ing their cause-effect intensities, by usinclud-ing data/ information collected from a panel of residential real estate experts (i.e. professional appraisers and realtors). We have found no prior documented re-search applying fuzzy cognitive mapping to home valuation and TOM. As such, our study is one of the first attempts to identify key determinants of housing sales and TOM using this methodological approach. Our framework thus contributes to ad-vance theory and empirical research on real estate, as well as on operational research.
The remainder of this paper is structured as follows. The next section provides the literature review on the key determinants of housing sales and TOM. Section 3 presents the methodological background and explores the applicability of the fuzzy cognitive mapping approach in the context of this study. Section 4 describes the process followed for the construction of our FCM, and discusses the major advantages and disadvantages of our frame-work. The paper finishes with concluding remarks and some lines for future research.
2. BaCKgroUnd on Key determInants of HoUsIng saLes and tom
Cheng et al. (2010: 109) argue that “choosing the
optimal holding period is an important part of real estate investment decisions, because “when to sell” affects ‘‘whether to buy””. In this sense, it is not
surprising that significant efforts have been made to define housing values and how quickly a house can be sold (Carrillo, Pope 2012), namely because accurate valuations and TOM predictions are im-portant for households, home sellers, buyers, in-vestors and financial institutions that manage the underwriting risk related to housing finance. Still, these determinants of home sales are difficult to operate because residential housing usually
aggre-gates conflicting factors that interfere with mar-ket value and TOM (cf. Clark 1995; Zhou, Haurin 2010; Benefield et al. 2011).
Several techniques for estimating market value and TOM (e.g. hedonic modeling and other mass appraisal techniques; functional forms; non-par-ametric or semi-parnon-par-ametric regressions; spatial models that capture correlations within submar-kets allowing for temporal asymmetry) have been suggested over the years (cf. Leung et al. 2002; Bourassa et al. 2003; Cheng et al. 2008; Peterson, Flanagan 2009; Carrillo, Pope 2012). However, while significant progress has occurred, these tech-niques are not without their flaws. In particular, they have been criticized for lack of guidance about the relationship between price and housing attrib-utes (Bin 2004). In addition, it should be recalled that these two determinants (i.e. price and housing attributes) are only part of the story and that there are other factors that influence residential real es-tate transactions and TOM (e.g. individual factors; seller’s search cost and strategy; market condition and maturity). Hui et al. (2012: 378) reinforce this assumption and refer that “TOM is influenced by
both local and national economic conditions, as well as being subject to strong seasonal effects” (for
an extensive literature that analyzes the determi-nants of TOM, see also Wu, Zheng 2008; McGreal
et al. 2009; Cheng et al. 2008, 2010; Carrillo, Pope
2012; Vanags, Butane 2013). In this sense,
“cau-tion [...] should be exercised [...]. Appropriate vari-ables must be selected carefully and measured ac-curately” (Bourassa et al. 2010: 139).
From this knowledge base, fuzzy logics (for de-tails, see Keršulienė, Turskis 2011) may provide an important contribution in bypassing the short-comings presented above. In particular, the use of FCM (background information is presented in the next section) can reduce the number of omit-ted criteria in the decision making framework and promote a better understanding of the relation-ships among key determinants of housing sales and TOM. Additionally, as a constructivist-based study (for details, see Ferreira et al. 2012), our use of FCM accepts uncertainty and allows inputs from active decision makers (e.g. appraisers and realtors) to be considered in the decision making framework. Due to the practical experience, tech-nical skills and realism brought by the decision makers, the methodological proposal outlined in this paper can potentially be used by parties that invest in real estate and also by policymakers who aim to increase the efficiency of sustainable planning and forecasting in real estate. Another
important feature of our study is that it offers a perspective of complementarity rather than substi-tution. The next section presents the methodologi-cal background of FCM and explores the applica-bility of the fuzzy cognitive mapping approach in the context of this study.
3. fUzzy CognItIve mappIng
Cognitive mapping has long been recognized as an important methodological approach for structuring and clarifying complex decision problems based on the human metacognitive perception (cf. Tolman 1948), “because cognitive maps are a useful tool for
modelling the complex relationships among vari-ables of a problem/phenomenon, even if complex”
(Carlucci et al. 2013: 212). Gavrilova et al. (2013: 1758) reinforce this idea, stating that “maps as
visual tools facilitate the representation and com-munication, support the identification and the in-terpretation of information, facilitate consultation and codification, and stimulate mental associa-tions”. Although the results of these maps typically
depend on the degree of involvement of the deci-sion makers, they are usually regarded as simple, interactive and versatile. They boost discussion among the participants, allow the number of omit-ted criteria to be reduced, increase transparency and so significantly improve understanding of the decision problem (cf. Ferreira et al. 2012).
Kosko (1986, 1992) has been acknowledged for introducing the term FCM, as well as enhancing the power of cognitive maps (cf. Carlucci et al. 2013; Carvalho 2013). This is because the author consid-ered fuzzy values for the criteria and fuzzy degrees of interrelationships between them. After this pio-neering work, FCM has been widely applied in the analysis of different decision problems and contexts (e.g. Kardaras, Mentzas 1997; Tsadiras et al. 2003; Kok 2009; Salmeron 2009; yaman, Polat 2009; Pa-pageorgiou et al. 2012). As pointed out by Carlucci et
al. (2013), FCM has two particular characteristics:
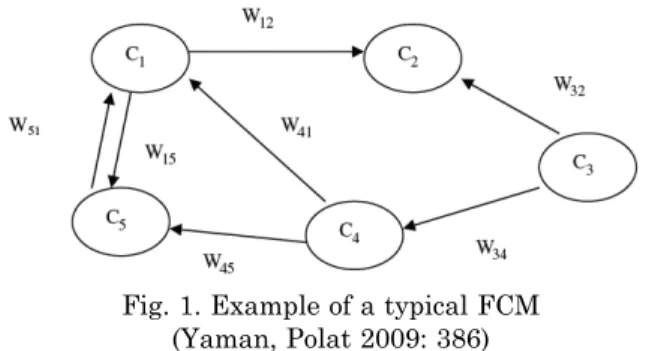
(1) cause-and-effect relationships between concepts/ criteria follow a fuzzy logic (i.e. the relationship be-tween two different criteria is simultaneously rep-resented by a sign of positive/negative causality and by a number, ranging from –1 to 1, that represents the intensity/influence degree of the relationship); and (2) the system is dynamic (i.e. it involves feed-back links among the criteria, allowing temporal aspects to be considered in the decision making framework). In this sense, FCM incorporates ideas from artificial neural networks and fuzzy logic, and the typical structure of a FCM includes
nodes/con-cepts and arcs between them. Figure 1 exemplifies a FCM, where Ci stands for concept/criterion i and
Wij represents the influence degree of the
relation-ship between criterion i and criterion j.
Fig. 1. example of a typical FCM (yaman, Polat 2009: 386)
Technically, all the values in the map can be fuzzy and, therefore, each concept has a state value
Ai that can be a fuzzy value in the range between [0, 1] or a bivalent logic in {0, 1}. Additionally, the weights of the arcs can be a fuzzy value within [–1, 1] or a trivalent logic within {–1, 0, 1}. In this sense, it is worth noting that there are three possi-ble types of cause-and-effect relationships between criteria/concepts: (1) positive causality (Wij > 0), meaning that an increase/decrease in the value of
Ci leads to an increase/decrease in the value of Cj; (2) negative causality (Wij < 0), meaning that an increase/decrease in the value of Ci leads to an de-crease/increase in the value of Cj; and (3) null
cau-sality (Wij = 0), meaning no relationship between
Ci and Cj (cf. Kim, Lee 1998; Mazlack 2009; Kok 2009; Salmeron 2009; yaman, Polat 2009).
Behind the graphical representation, FCM has a mathematical background. Following Stylios and Groumpos (1999), Mazlack (2009) and Carlucci
et al. (2013), there is a 1 × n state vector A that
includes the values of the n concepts; and a n × n weight matrix W (also known as adjacency matrix or connection matrix) that gathers the weights
Wij of the interconnections between the n
crite-ria of the FCM. Although non-zero values on the main diagonal might be considered (cf. Kok 2009; Carvalho 2013), this matrix usually presents all entries of the main diagonal equal to zero (i.e. a criterion only seldom causes itself), and the val-ue of each criterion is inflval-uenced by the valval-ues of the interconnected criteria (with the appropriate weights) and by its previous value. This means that FCM is free to interact and that, at every step of interaction, every criterion has a new value that is obtained according to formulation (1):
( )1 ( ) ( ) 1 n . . t t t ji i i j j i j A + f A A W ≠ = = +
∑
(1)As explained by Mazlack (2009), Ai(t+1) is the
ac-tivation level of criterion Ci at time t + 1; Ai(t) is the
activation level of criterion Ci at time t; Aj(t) is the
activation level of criterion Cj at time t; Wji is the
weight of the interconnection between both criteria; and f represents a threshold activation function (for further details regarding the activation function, see Stach et al. 2005; Papageorgiou et al. 2012; Salmer-on 2012). From this basis, “the new state vector Anew
is computed by multiplying the previous state vec-tor Aold by the weight matrix W” (Mazlack 2009: 6).
A hypothetical example considering three concepts/ criteria (i.e. C1, C2 and C3) is illustrated as follows:
– State vector Aold = (1, 0, 1) 0 0.5 0.1 0.5 0 1 1 0.5 0 − , – Adjacency matrix W = 0 0.5 0.1 0.5 0 1 1 0.5 0 − ,
– new state vector Anew = Aold × W = (1, 0, 1) × = 1 × (0, 0.5, 0.1) + 0 × (–0.5, 0, 1) + 1 × (1, 0.5, 0) = (0, 0.5, 0.1) + (0, 0, 0) + (1, 0.5, 0) = (1, 1, 0.1).
The overall impact of a change in the value of one criterion can be given by Anew and, quoting Car-lucci et al. (2013: 213), “the resulting transformed
vector is then repeatedly multiplied by the adjacency matrix and transformed until the system converges to a fixed point. Typically it converges in less than 30 simulation time steps”. At the end of the simulation,
an idea of the ranking (i.e. “strength of impact”) of the variables in relation to each other can be ob-tained, so we can see how the system is perceived in the FCM. In addition, it is possible to formulate “what-if” questions (e.g. what happens to a system if some of the concepts change or if new ones are introduced or removed?) and make runs to deter-mine what state the system will go to (Carvalho 2013). All in all, “they [FCMs] have powerful and
far-reaching consequences as a mathematical tool for modeling complex systems” (Mazlack 2009: 5). In
light of these considerations, there is considerable scope to explore FCM applicability in the identifica-tion of key determinants of housing sales and TOM. 4. ConstrUCtIng tHe fUzzy
CognItIve map
The construction of our FCM took place during an intensive 6-hour group work session. As pointed
out by yaman and Polat (2009: 387), “using a
group of experts has the benefit of improving the reliability of the final model”. It should be noted,
however, that “the expert panel number is quite
dif-ficult to establish and no study has been conclusive with respect to it” (Salmeron 2009: 276). In this
sense, following the methodological guidelines of eden and Ackermann (2001: 22), who state that
“the consultant [i.e. researcher] will relate person-ally to a small number (say, three to ten persons)”,
we involved five residential real estate experts (i.e. professional appraisers and realtors). These real estate experts have been developing their profes-sional activity over the past 2–3 decades, dealing particularly with single family apartments in the Central-West region of Portugal. It is important to underline, in addition, that because our approach is process-oriented, our framework should be seen as a learning mechanism and not as an end in it-self or a tool to prescribe optimal solutions. From a methodological point of view, this means that, with the necessary adjustments, the process followed can work well with a different group of decision makers and/or with a different type of residential real estate.
The session was conducted by an experienced facilitator, accompanied by two assistant techni-cians who were responsible for providing technical support and registering the results. Several issues were addressed in this session, including: the for-mulation of the “trigger question”, and the design and validation of the FCM.
4.1. Identifying concepts and quantifying relationships
To avoid misunderstandings between the team of facilitators (i.e. researchers) and the panel mem-bers, we started the group meeting with a kick-off presentation of the research objectives and of the basic concepts related to fuzzy cognitive mapping. Additionally, the concept of “home” was associated with “apartment” because, as already pointed out, this is the most common residential real estate in the Central-West region of the country. Given these initial clarifications, we started the opera-tional phase of the session by asking the panel members the following trigger question: “Based
on your own values and professional experience, what are the main determinants of housing sales and TOM?”. This question provided the focus for
the debate/negotiation among the decision mak-ers, and allowed the “post-its technique” to be applied.
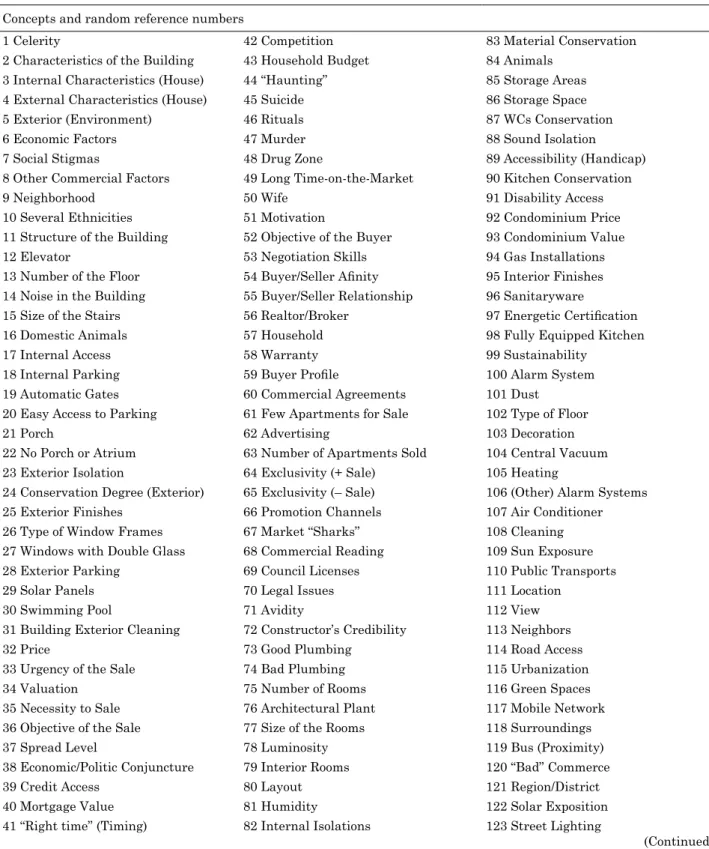
The basis of the post-its technique consists of writing what the panel members consider as rel-evant concepts/criteria on post-its (i.e. one concept per post-it), and sticking those post-its on a large piece of paper. Supported by permanent discussion, this procedure should be repeated until the deci-sion makers reveal satisfaction with the number and depth of the concepts identified (for further details, see Ferreira et al. 2014). Table 1 presents
the list of concepts/criteria obtained during the ini-tial stage of the group meeting. It is worth noting, in addition, that the criteria identified were deeply discussed, clarified between and agreed on by the group of experts to closely reflect the determinants of TOM. Representing the group’s understanding on TOM determinants, this list is important to le-gitimize the results obtained and improve the face validity of the framework developed.
Table 1. List of concepts resulting from the application of the “post-its technique”
Concepts and random reference numbers
1 Celerity 42 Competition 83 Material Conservation
2 Characteristics of the Building 43 Household Budget 84 Animals
3 Internal Characteristics (House) 44 “Haunting” 85 Storage Areas
4 external Characteristics (House) 45 Suicide 86 Storage Space
5 exterior (environment) 46 Rituals 87 WCs Conservation
6 economic Factors 47 Murder 88 Sound Isolation
7 Social Stigmas 48 Drug Zone 89 Accessibility (Handicap)
8 Other Commercial Factors 49 Long Time-on-the-Market 90 Kitchen Conservation
9 neighborhood 50 Wife 91 Disability Access
10 Several ethnicities 51 Motivation 92 Condominium Price
11 Structure of the Building 52 Objective of the Buyer 93 Condominium Value
12 elevator 53 negotiation Skills 94 Gas Installations
13 number of the Floor 54 Buyer/Seller Afinity 95 Interior Finishes
14 noise in the Building 55 Buyer/Seller Relationship 96 Sanitaryware
15 Size of the Stairs 56 Realtor/Broker 97 energetic Certification
16 Domestic Animals 57 Household 98 Fully equipped Kitchen
17 Internal Access 58 Warranty 99 Sustainability
18 Internal Parking 59 Buyer Profile 100 Alarm System
19 Automatic Gates 60 Commercial Agreements 101 Dust
20 easy Access to Parking 61 Few Apartments for Sale 102 Type of Floor
21 Porch 62 Advertising 103 Decoration
22 no Porch or Atrium 63 number of Apartments Sold 104 Central Vacuum
23 exterior Isolation 64 exclusivity (+ Sale) 105 Heating
24 Conservation Degree (exterior) 65 exclusivity (– Sale) 106 (Other) Alarm Systems
25 exterior Finishes 66 Promotion Channels 107 Air Conditioner
26 Type of Window Frames 67 Market “Sharks” 108 Cleaning
27 Windows with Double Glass 68 Commercial Reading 109 Sun exposure
28 exterior Parking 69 Council Licenses 110 Public Transports
29 Solar Panels 70 Legal Issues 111 Location
30 Swimming Pool 71 Avidity 112 View
31 Building exterior Cleaning 72 Constructor’s Credibility 113 neighbors
32 Price 73 Good Plumbing 114 Road Access
33 urgency of the Sale 74 Bad Plumbing 115 urbanization
34 Valuation 75 number of Rooms 116 Green Spaces
35 necessity to Sale 76 Architectural Plant 117 Mobile network
36 Objective of the Sale 77 Size of the Rooms 118 Surroundings
37 Spread Level 78 Luminosity 119 Bus (Proximity)
38 economic/Politic Conjuncture 79 Interior Rooms 120 “Bad” Commerce
39 Credit Access 80 Layout 121 Region/District
40 Mortgage Value 81 Humidity 122 Solar exposition
41 “Right time” (Timing) 82 Internal Isolations 123 Street Lighting
In a second stage, the post-its were organized in a circle. This allowed pair-wise comparisons among criteria to be performed and cause-and-effect re-lationships to be identified. As recognized by the decision makers, this procedure was extremely im-portant because it allowed key feedbacks to be iden-tified in the system. Once the relationships between criteria had been identified and registered, the deci-sion makers were asked to mark in black (continu-ous) or in red (discontinu(continu-ous) whether they believed that there was, respectively, a positive or negative cause-and-effect relationship between the concepts. In spite of its apparent complexity, Figure 2 is illus-trative of the process followed for the identification of the relationships, which are represented by ar-rows. It is worth noting that the resulting map was collective, negotiated between and agreed on by all.
It should be underlined that this procedure al-lowed decision makers to be provided with a holistic picture of the decision situation, reinforcing Kauko’s (2008: 101) assumption that “instead of isolating
variables of cause of effect, it may be more relevant to give a holistic picture of the behavioural and
institu-Concepts and random reference numbers (Continued)
124 Cemetery 136 Paid Parking 148 Police (noise)
125 Garbage Pickup 137 Railways 149 Prison
126 Parking 138 Firefighters 150 Beach (Proximity)
127 Hospitals 139 Highway (noise) 151 Recycling Areas
128 Schools 140 Pharmacy 152 Church
129 Public Services 141 Commerce 153 Industry
130 Gardens 142 Supermarkets 154 electricity Plants
131 no Traffic 143 Industrial Zone 155 Water Treatment
132 Public Space 144 noise 156 Sports Areas
133 Antenna/Aerial 145 Parks 157 Characteristics
134 Clear View 146 Banks (Proximity)
135 Leisure Spaces 147 Police (Protection)
Fig. 2. Relationships between concepts
tional aspects of the local property market activity”.
In addition, as stated by one of the participating de-cision makers, most of determinants included in the diagram are rarely taken into account in the defini-tion of TOM. However, the use of cognitive mapping allowed these criteria to be identified. Furthermore, adjustments (e.g. inclusion of new concepts) are al-ways possible (Xue et al. 2010; Ferreira et al. 2011, 2012). This was considered extremely positive by the participating decision makers.
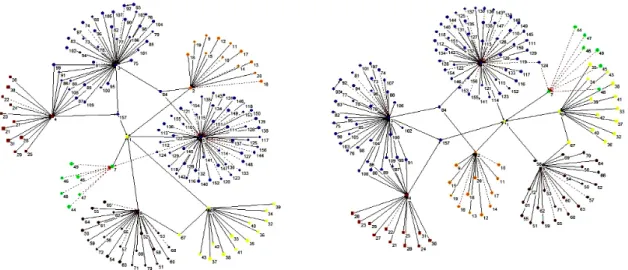
Aiming to simplify the visualization of the cog-nitive diagram presented in Figure 2, the next step consisted in the identification of clusters of criteria based on the cause-and-effect relationships previ-ously identified. Figure 3 illustrates two different perspectives of the agreed collective map, which was constructed with the support of the
FCMap-per (http://www.fcmapFCMap-pers.net) and Pajek software
(http://pajek.imfm.si/doku.php).
The next step in the construction of the FCM consisted in analyzing the intensity of the relation-ships identified. Figure 4 exemplifies the analysis carried out by the decision makers for one of the clusters, where the intensity of each relationship is quantified and ranges from –1 to 1 (see Kok 2009; Salmeron 2009; yaman, Polat 2009).
This analysis was repeated for all the clusters and relationships identified in Figure 3. The deci-sion makers were then asked to fill in a weight ma-trix (i.e. the adjacency mama-trix or connection mama-trix) containing the intensity degrees previously identi-fied. Because the final list of TOM determinants contains 157 interlinked variables (cf. Table 1), the resulting matrix is a 157×157 weight matrix. Due to its considerable size, it cannot be displayed in this paper, but it is worth noting that this procedural step served to promote additional discussion on the research outputs (i.e. determinants of housing sales
and TOM) and determine the basis for recommen-dations (for technical details on this procedure, see Stylios, Groumpos 1999; Mazlack 2009; Salmeron 2009; yaman, Polat 2009; Papageorgiou et al. 2012; Salmeron 2012; Carlucci et al. 2013).
4.2. Interpreting the research outputs
The final form of our FCM was discussed with the panel members, and represents the result of the negotiation and agreement reached. The form and/ or content of this FCM could have been different
had the context or the participants involved been different or had the session lasted longer. However, this is an inherent characteristic of this methodol-ogy. The FCM “should be interpreted as a tool to
provide consolidated information on decision issues based on perceptions of a certain group of decision makers” (Ferreira et al. 2012: 263). Furthermore,
rather than a single formulaic answer, the results are aimed at encouraging discussion among ex-perts and promoting a better understanding of the criteria associated with housing sales and TOM. In this sense, several static and dynamic analyses were carried out throughout the study. According to Carlucci et al. (2013: 216), “through a proper
neural network computational model, [...] what we can get is an idea of the ranking of the variables in relationship to each other according to how the system is perceived in the FCM”. In light of this
consideration, and taking into account the math-ematical formulations presented in the previous section, Table 2 reveals the major determinants of housing sales and TOM that resulted from the concept interaction presented in our FCM.
It should be noted that all concepts comprised in the FCM (see Table 1) have a centrality index. How-ever, given the high number of concepts included in our framework, Table 2 presents only the ones with Fig. 3. Different perspectives of the agreed collective map
Fig. 4. Quantification of relationships
Table 2. Major determinants of housing sales and TOM [based on centrality]
Concepts Reference Outdegree Indegree Centrality
exterior (environment) 5 0.70 33.90 34.60
Internal Characteristics of the House 3 0.70 20.60 21.30
Other Commercial Determinants 8 0.60 16.30 16.90
external Characteristics of the House 4 1.40 12.20 13.60
economic Determinants 6 0.90 10.60 11.50
Characteristics of the Building 2 1.60 10.40 12.00
the highest centrality indices. In particular,
Exte-rior (Environment) and Internal Characteristics of the House seem to have a prominent role as
deter-minants of housing sales and TOM, considering the respective centrality indices of 34.60 and 21.30.
These results should be treated with caution; and some of the reasons for these reservations are discussed in the next subsection. nonetheless, it is worth highlighting that the ranking of determi-nants obtained in this study offers a real insight into the driving forces capable of improving real estate business performance. In addition, “from
an Artificial Intelligence perspective, FCMs are supervised learning neural systems, whereas more and more data is available to model the problem, the system becomes better at adapting itself and reaching a solution” (Salmeron 2009: 275). Indeed, “FCMs are simple, yet powerful tools for modeling and simulation of dynamic systems, based on do-main-specific knowledge and experience”
(Papa-georgiou et al. 2012: 45). As such, and recalling earlier discussion, it seems safe to assume that FCMs hold great potential for strategic planning and forecasting of housing sales and TOM.
4.3. Limitations and recommendations
Kim and Lee (1998: 303) argue that “knowledge
engineering is one of the most important tasks in developing expert systems. One of the primary ob-jectives [...] is to develop a complete, consistent and unambiguous description of the knowledge base”.
This knowledge base seems to be increasingly needed in some domains characterized as subjec-tive and fuzzy. The appraisal process of residen-tial real estate seems to be the case, considering that “the real estate investment decision is not
just ‘to buy, or not to buy’. It is as much ‘when to sell’ [...] the two decisions are inherently interde-pendent [...]” (Cheng et al. 2010: 109). From this
premise, the development of our FCM allowed real estate experts to: (1) identify key variables/deter-minants of housing sales and TOM; (2) promote discussion throughout the process, which allowed transparency and learning to be increased; and (3) provide insights about the driving forces and the key feedbacks in the system that can improve real estate business performance.
Although the system created in this study achieved encouraging results, namely as a re-sult of the generalized satisfaction expressed by the participants, one should bear in mind that our methodological framework is not without its own limitations. Stach et al. (2005: 372) claim
that “FCM development methods are far from
be-ing complete and well-defined, mainly because of the deficiencies that are present in the underlying theoretical framework [...] the development of FCM models almost always relies on human knowledge
[... and] strongly depend on subjective beliefs of
expert(s) from a given domain”. Indeed, it is
wide-ly acknowledged that the conception of a cognitive map is context-dependent and, thus, subjective in nature. This context-dependence is related to the decision circumstances, participating decision makers, facilitator skills and/or session duration (Ferreira et al. 2012). nonetheless, it is more than compensated by the direct involvement of experts, the amount of information discussed and by the iterative and interactive nature of the process, which allows ideas and thoughts to be shared and explored and relationships to be better understood. FCM are not a substitute for statistical approach-es; however, their application by managers and decision makers can provide insights on the role of key feedbacks in the system, which might other-wise go undetected by statistical approaches alone (cf. Stach et al. 2005, 2010).
5. ConCLUsIons
This paper aimed to identify key determinants of housing sales and TOM using fuzzy cognitive mapping. This methodological option resulted from the fact that, despite the progress achieved over the years, current available approaches to house valuation and TOM fall short to comprehensively represent the domain, as well as to enable decision makers to express their own beliefs and convic-tions (cf. Kardaras, Mentzas 1997). In this sense, our proposal resulted from the direct involvement of five real estate experts (i.e. professional apprais-ers and realtors), and assumed that the identifi-cation of key determinants of housing sales and TOM is a complex decision problem. This support-ed our methodological option because, according to Mazlack (2009), FCMs are neuro-fuzzy systems, which are able to incorporate experts’ knowledge and have powerful and far-reaching consequences as a mathematical tool for analysis and modeling of complex systems.
Among other achievements, our FCM allowed the participating real estate experts to: (1) iden-tify key determinants of housing sales and TOM; (2) promote discussion throughout the process, reducing the rate of omitted criteria and increas-ing transparency and learnincreas-ing; and (3) provide insights about the driving forces and the key
feed-backs that can improve real estate business perfor-mance. In this sense, and above all, our framework provides evidence that the use of fuzzy cognitive mapping can support the identification of TOM de-terminants and, ultimately, has a strategic plan-ning purpose, assisting decision makers to obtain important information about the impact of each de-terminant to support decisions regarding price and TOM. Obviously, FCM managerial implications go far beyond the context of this study. However, to the best of our knowledge this is one of the first at-tempts to identify key determinants of home sales and TOM using fuzzy cognitive mapping.
In spite of the encouraging results of this study, they are subjective in nature, because the procedures are strongly dependent on the context of analysis and the participants involved. As such, we would recommend caution in directly extrapolating these results for application in distinct contexts. That said, this is arguably more than compensated by the direct involvement of experts, the amount of information discussed and the iterative nature of the process, which allowed ideas to be shared and explored, and relationships between determinants to be better un-derstood. In this sense, FCM has practical applica-tion for both real estate investors and policymakers who aim to increase the efficiency of sustainable planning and forecasting of housing sales and TOM.
Future research might want to work toward the improvement of our FCM-based expert system, namely in three different ways: (a) promoting its replication in other countries and with other deci-sion makers; (b) exploring its integration within established frameworks (e.g. time series; hedonic modeling); and (c) comparing and contrasting the strengths and weaknesses of this framework to other frameworks. As already pointed out by Kok (2009: 123), “further research on the possible
ap-plications of Fuzzy Cognitive Maps is ongoing, and subsequent papers will provide a more in-depth analysis of the applicability”.
aCKnoWLedgments
The authors gratefully acknowledge the contribu-tion and willingness of the panel members (i.e. appraisers and realtors): Bruno Guerreiro, Carlos Gonzaga, Henrique Querido, João Lourenço and Paula Gonçalves. Thanks also go to Marlene Fil-ipe and Vanda Martins for their excellent technical assistance during the group meeting. Institution-al and facility support from the ISCTe Business School, university Institute of Lisbon, Portugal, is also acknowledged.
referenCes
Benefield, J.; Pyles, M.; Gleason, A. 2011. Sale price, marketing time, and limited service listings: the in-fluence of home value and market conditions, Jour-nal of Real Estate Research 33(4): 531–563.
Bin, O. 2004. A prediction comparison of housing sales prices by parametric versus semi-parametric regres-sions, Journal of Housing Economics 13(1): 68–84.
http://dx.doi.org/10.1016/j.jhe.2004.01.001
Bourassa, S.; Hoesli, M.; Peng, V. 2003. Do housing submarkets really matter?, Journal of Housing Eco-nomics 12(1): 12–28. http://dx.doi.org/10.1016/S1051-1377(03)00003-2
Bourassa, S.; Cantoni, e.; Hoesli, M. 2010. Predicting house prices with spatial dependence: a comparison of alternative methods, Journal of Real Estate Re-search 32(2): 139–160.
Carlucci, D.; Schiuma, G.; Gavrilova, T.; Linzalone, R. 2013. A fuzzy cognitive map based approach to dis-close value creation dynamics of ABIs, in Proceedings of the 8th International Forum on Knowledge Asset Dynamics (IFKAD-2013), 12–14 June 2013, Zagreb, Croatia, 207–219.
Carrillo, P.; Pope, J. 2012. Are homes hot or cold pota-toes? The distribution of marketing time in the hous-ing market, Regional Science and Urban Economics 42(1): 189–197. http://dx.doi.org/10.1016/j.regsciur-beco.2011.08.010
Carvalho, J. 2013. On the semantics and the use of fuzzy cognitive maps and dynamic cognitive maps in social sciences, Fuzzy Sets and Systems 214: 6–19. http:// dx.doi.org/10.1016/j.fss.2011.12.009
Cheng, P.; Lin, Z.; Liu, y. 2008. A model of time-on-market and real estate price under sequential search with recall, Real Estate Economics 36(4): 813–843.
http://dx.doi.org/10.1111/j.1540-6229.2008.00231.x
Cheng, P.; Lin, Z.; Liu, y. 2010. Illiquidity, transac-tion cost, and optimal holding period for real estate: theory and application, Journal of Housing Eco-nomics 19(2): 109–118. http://dx.doi.org/10.1016/j. jhe.2010.03.002
Clark, T. 1995. Rents and prices of housing across ar-eas of the united States: a cross-section examina-tion of the present value model, Regional Science and Urban Economics 25(2): 237–247. http://dx.doi. org/10.1016/0166-0462(94)02066-P
eden, C.; Ackermann, F. 2001. SODA – the principles, in Rosenhead, J.; Mingers, J. (eds.). Rational analysis for a problematic world revisited: Problem structur-ing methods for complexity, uncertainty and conflict. 2nd ed. Chichester: John Wiley & Sons, 21–41. Ferreira, F.; Santos, S.; Rodrigues, P. 2011. Adding
value to bank branch performance evaluation using cognitive maps and MCDA: a case study, Journal of the Operational Research Society 62(7): 1320–1333.
http://dx.doi.org/10.1057/jors.2010.111
Ferreira, F.; Santos, S.; Rodrigues, P.; Spahr, R. 2014. evaluating retail banking service quality and con-venience with MCDA techniques: a case study at the bank branch level, Journal of Business Economics and Management 15(1): 1–21. http://dx.doi.org/10.38 46/16111699.2012.673504
Ferreira, F.; Spahr, R.; Santos, S.; Rodrigues, P. 2012. A multiple criteria framework to evaluate bank branch potential attractiveness, International Journal of Strategic Property Management 16(3): 254–276.
http://dx.doi.org/10.3846/1648715X.2012.707629
Gavrilova, T.; Carlucci, D.; Schiuma, G. 2013. Art of visual thinking for smart business education. in Pro-ceedings of the 8th International Forum on Knowl-edge Asset Dynamics (IFKAD-2013), 12–14 June 2013, Zagreb, Croatia, 1754–1761.
Hui, e.; Wong, J.; Wong, K. 2012. Marketing time and pricing strategies, Journal of Real Estate Research 34(3): 375–398.
Kardaras, D.; Mentzas, G. 1997. using fuzzy cognitive maps to model and analyse business performance assessment, in Proceedings of the 2nd Annual In-ternational Conference on Industrial Engineering Applications and practice II, 12–15 november 1997, San Diego, California, uSA, 63–68.
Kauko, T. 2008. From modelling tools towards the market itself: an opportunity for sustainability as-sessment?, International Journal of Strategic Prop-erty Management 12(2): 95–107. http://dx.doi. org/10.3846/1648-715X.2008.12.95-107
Kauko, T. 2010. Value stability in local real estate markets, International Journal of Strategic Prop-erty Management 14(3): 191–199. http://dx.doi. org/10.3846/ijspm.2010.14
Keršulienė, V.; Turskis, Z. 2011. Integrated fuzzy mul-tiple criteria decision making model for architect se-lection, Technological and Economic Development of Economy 17(4): 645–666. http://dx.doi.org/10.3846/20 294913.2011.635718
Kim, H.; Lee, K. 1998. Fuzzy implications of fuzzy cog-nitive map with emphasis on fuzzy causal relation-ship and fuzzy partially causal relationrelation-ship, Fuzzy Sets and Systems 97(3): 303–313. http://dx.doi. org/10.1016/S0165-0114(96)00349-1
Kok, K. 2009. The potential of fuzzy cognitive maps for semi-quantitative scenario development, with an ex-ample from Brazil, Global Environmental Change 19(1): 122–133. http://dx.doi.org/10.1016/j.gloenv-cha.2008.08.003
Kosko, B. 1986. Fuzzy cognitive maps, International Journal of Man-Machine Studies 24(1): 65–75. http:// dx.doi.org/10.1016/S0020-7373(86)80040-2
Kosko, B. 1992. Neural networks and fuzzy systems. new Jersey: Prentice-Hall.
Leung, C; Leong, y.; Chan, I. 2002. TOM: Why isn’t price enough?, International Real Estate Review 5(1): 91–115.
Mazlack, L. 2009. Representing causality using fuzzy cognitive maps, in Proceedings of the Annual Meet-ing of the North American Fuzzy Information Pro-cessing society (NAFIPS-2009), 14–17 June 2009, Cincinnati, Ohio, uSA, 1–6. http://dx.doi.org/10.1109/ nAFIPS.2009.5156434
McGreal, S.; Adair, A.; Brown, L.; Webb, J. 2009. Pricing and time on the market for residential properties in a major uK city, Journal of Real Estate Research 31(2): 209–233.
Papageorgiou, e.; Roo, J.: Huszka, C.; Colaert, D. 2012. Formalization of treatment guidelines using fuzzy cognitive maps and semantic web tools, Journal of Biomedical Informatics 45(1): 45–60. http://dx.doi. org/10.1016/j.jbi.2011.08.018
Peterson, S.; Flanagan, A. 2009. neural network hedonic pricing models in mass real estate appraisal, Journal of Real Estate Research 31(2): 148–164.
Salmeron, J. 2009. Augmented fuzzy cognitive maps for modelling LMS critical success factors, Knowl-edge-Based Systems 22(4): 275–278. http://dx.doi. org/10.1016/j.knosys.2009.01.002
Salmeron, J. 2012. Fuzzy cognitive maps for artifi-cial emotions forecasting, Applied Soft Comput-ing 12(12): 3704–3710. http://dx.doi.org/10.1016/j. asoc.2012.01.015
Stach, W.; Kurgan, L.; Pedrycz, W. 2010. A divide and conquer method for learning large fuzzy cognitive maps, Fuzzy Sets and Systems 161(19): 2515–2532.
http://dx.doi.org/10.1016/j.fss.2010.04.008
Stach, W.; Kurgan, L.: Pedrycz, W.; Reformat, M. 2005. Genetic learning of fuzzy cognitive maps, Fuzzy Sets and Systems 153(3): 371–401. http://dx.doi. org/10.1016/j.fss.2005.01.009
Stylios, C.; Groumpos, P. 1999. Fuzzy cognitive maps: a model for intelligent supervisory control systems, Computers in Industry 39(3): 229–238. http://dx.doi. org/10.1016/S0166-3615(98)00139-0
Tolman, e. 1948. Cognitive maps in rats and men, Psychological Review 55(4): 189–208. http://dx.doi. org/10.1037/h0061626
Tsadiras, A.; Kouskouvelis, I.; Margaritis, K. 2003. us-ing fuzzy cognitive maps as a decision support sys-tem for political decisions, in Proceedings of the 8th Panhellenic Conference on Informatics (PCI-2001), 8–10 november 2001, nicosia, Cyprus, 172–182.
http://dx.doi.org/10.1007/3-540-38076-0_12
Vanags, J.; Butane, I. 2013. Major aspects of develop-ment of sustainable investdevelop-ment environdevelop-ment in real estate industry, Procedia Engineering 57: 1223–1229.
http://dx.doi.org/10.1016/j.proeng.2013.04.154
Wu, J.; Zheng, S. 2008. Determinants of housing liquid-ity in Chinese cities: does market maturliquid-ity matter?, Tsinghua Science and Technology 13(5): 689–695.
http://dx.doi.org/10.1016/S1007-0214(08)70112-3
Xue, X.; Ji, y.; Li, L.; Shen, Q. 2010. Cognition driven framework for improving collaborative working in construction projects: negotiation perspective, Jour-nal of Business Economics and Management 11(2): 227–242. http://dx.doi.org/10.3846/jbem.2010.11
yaman, D.; Polat, S. 2009. A fuzzy cognitive map ap-proach for effect-based operations: an illustrative case, Information Sciences 179(4): 382–403. http:// dx.doi.org/10.1016/j.ins.2008.10.013
Zhou, y.; Haurin, D. 2010. On the determinants of house value volatility, Journal of Real Estate Research 32(4): 377–395.