Repositório ISCTE-IUL
Deposited in Repositório ISCTE-IUL:
2018-01-15
Deposited version:
Post-print
Peer-review status of attached file:
Peer-reviewed
Citation for published item:
dos Santos, L. G. G. & Lagoa, S. (2017). Herding behaviour in a peripheral European stock market: the impact of the subprime and the European sovereign debt crises. International Journal of
Banking, Accounting and Finance. 8 (2), 174-203
Further information on publisher's website:
10.1504/IJBAAF.2017.087074
Publisher's copyright statement:
This is the peer reviewed version of the following article: dos Santos, L. G. G. & Lagoa, S. (2017). Herding behaviour in a peripheral European stock market: the impact of the subprime and the European sovereign debt crises. International Journal of Banking, Accounting and Finance. 8 (2), 174-203, which has been published in final form at https://dx.doi.org/10.1504/IJBAAF.2017.087074. This article may be used for non-commercial purposes in accordance with the Publisher's Terms and Conditions for self-archiving.
Use policy
Creative Commons CC BY 4.0
The full-text may be used and/or reproduced, and given to third parties in any format or medium, without prior permission or charge, for personal research or study, educational, or not-for-profit purposes provided that:
• a full bibliographic reference is made to the original source • a link is made to the metadata record in the Repository • the full-text is not changed in any way
The full-text must not be sold in any format or medium without the formal permission of the copyright holders. Serviços de Informação e Documentação, Instituto Universitário de Lisboa (ISCTE-IUL)
Av. das Forças Armadas, Edifício II, 1649-026 Lisboa Portugal Phone: +(351) 217 903 024 | e-mail: administrador.repositorio@iscte-iul.pt
1
MANUSCRIPT
Herding Behavior in a peripheral European stock market: The impact of the Subprime and the European Sovereign Debt crises
Authors:
dos Santos, Luís G. G. (ROFF Consulting, Algés, Portugal)
and Lagoa, Sérgio
(Instituto Universitário de Lisboa – ISCTE, DINÂMIA’CET-IUL, Lisboa, Portugal)
Acknowledgements: We thank Nelson Furtado and Sofia Ramos for their comments.
Biographical Notes:
Luís G. G. dos Santos : works at ROFF Consulting and holds a Master in Monetary and
Financial Economics from Instituto Universitário de Lisboa (ISCTE-IUL).
Address: R. Afonso Emílio Praça 30 - 15º andar, 1495-061 Algés, Portugal. E-mail: luisggsantos@gmail.com
Sérgio Lagoa: Assistant Professor at Instituto Universitário de Lisboa (ISCTE-IUL) and researcher
at DINÂMIA’CET-IUL. His research interests and publications are in macroeconomics, monetary economics and labour economics. He has recent publications in Open Economies Review,
Research in Economics, Economic and Industrial Democracy, and Economics and Labour Relations Review.
Address: Department of Political Economy, Instituto Universitário de Lisboa (ISCTE-IUL),
Avenida das Forças Armadas, 1649-026 Lisboa, Portugal. E-mail: sergio.lagoa@iscte.pt.
2
Abstract
The characteristics of the Portuguese stock market suggest that it is susceptible to herding behavior. We investigate the existence of this behavior in Portugal during periods of market stress, with emphasis on the Subprime and European Sovereign Debt Crises. We analyze the overall stock market, key industries, and portfolios divided by market capitalization. The study is performed using both linear and nonlinear models, and the impact of conditional variance is taken into account. This paper shows evidence of herding behavior when the nonlinear model is used and during periods of crisis. Investors imitate more assets of similar size than assets of the same industry. Finally, the evidence of herding behavior is reduced when GARCH effects are taken into account.
JEL Classification: G02; G15; G14
Keywords: Herding behavior, market stress, Portugal, stock market, crisis, Subprime Crisis, European sovereign debt crisis.
3
1. Introduction
The instability of Financial markets is a much-discussed topic and many researchers have studied its causes and consequences. Some economic theory suggests that prices efficiently reflect rational agents' expectations (Scharfstein and Jeremy, 1990). However, investors may be forced to negotiate at inefficient prices (Christie and Huang, 1995), due, for instance, to group psychology, i.e. herding behavior (Scharfstein and Jeremy, 1990). Herding behavior has been studied studied more intensely in recent years, and it is characterized by an investment plan based on the strategy of other investors (Nofsinger and Sias, 1999). However, herding may not be intentional, and may be caused by correlation of independent behaviors due to information disclosure - "spurious herding" (Bikhchandani and Sharma, 2000). Another phenomenon close to herding behavior is fire sales, where investors sell assets at very low prices accumulating huge losses (Shleifer and Vishny, 2011).
Herding behavior can lead to an increase in systemic risk, jeopardizing the conclusions of basic asset pricing models. In contrast, it may also create investment opportunities for investors (Tan et al., 2008). Due to the potential impact of herding, many theoretical works attempt to understand it, notably Bikhchandani et al. (1992) and Banerjee (1992). Some authors mention herding behavior as an irrational behavior (Christie and Huang, 1995), but some specify it as a rational behavior (Chiang and Zeng, 2010; Garber, 2000: 5; Scharfstein and Jeremy, 1990).
The empirical studies on the existence of herding in various countries are ambiguous (Christe and Huang, 1995; Chang et al., 2000). Notably, in Southern European markets, Economou et al. (2011) found evidence of herding in Greece and Italy, with results being less explicit for Portugal. This created the motivation for studying herding in the Portuguese stock market. Another motivating reason is the instability, macroeconomic imbalances and structural problems characterizing the Portuguese economy from 2008 to 2012. Indeed, with the global financial crisis of 2008 and the sovereign debt crisis of 2010, market uncertainty and risk has substantially increased (Banco de Portugal, 2012).
Despite the increase since 1989, stock market capitalization as a proportion of GDP in Portugal is smaller than in the euro area (28% and 40% in 2011, respectively). The
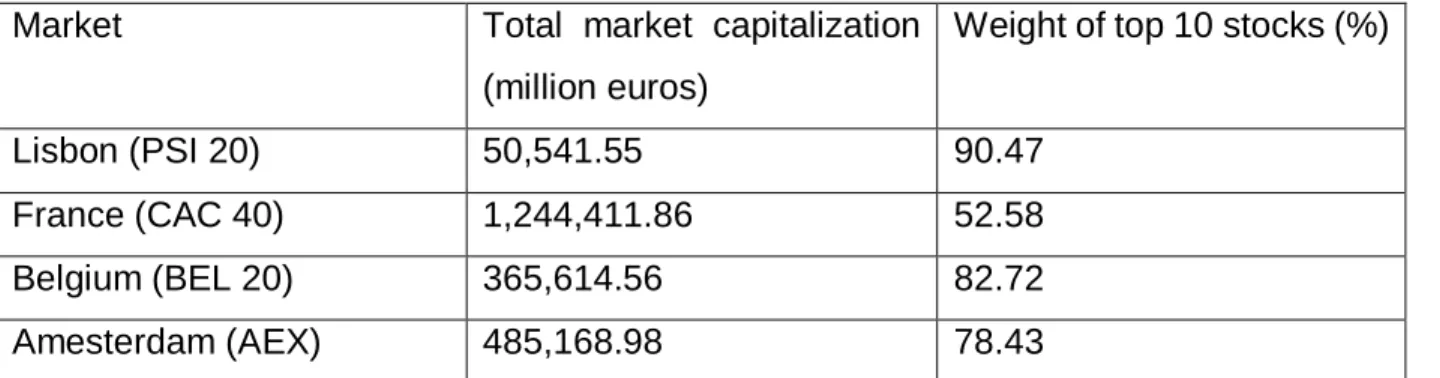
4 relatively small size of the stock market (see Table 1 for additional data) is due in part to the large number of SMEs and the great importance of banks in the financing of firms. Only a small number of firms are listed in the stock market, the concentration of the market in the top ten firms is strong, and the liquidity of some stocks is small (IMF, 2006). The mutual funds industry is also very concentrated (Gavriilidis et al., 2013b).
[Insert Table 1 around here]
Moreover, given the small liquidity and high concentration of the Portuguese stock market (see Table 1), herding behavior may be more intense than in other
European advanced markets. In concentrated markets, institutional herding behavior is more probable because of more information sharing, greater peer pressure, and better knowledge of each others' transactions among mutual funds’ managers (Gavriilidis et al., 2013b; Do et al., 2008).
Also, the average sophistication of non-professional investors in Portugal is relatively small, implying a greater propensity for herding behavior (Lux, 1995). Relying on these facts, we propose to study the significance of herding behavior in Portugal and its connection with crisis periods. Our results are relevant for Portugal and other small and very concentrated stock markets that share similarities in market structure, dissemination of information and industry structure. Using market returns and CSAD data, Mobarek et al. (2014) find that Portugal belongs to the cluster of PIIGS countries (Portugal, Italy, Ireland, Greece and Spain) that has characteristics distinct from the Nordic and continental countries.
Even though Economou et al. (2011) have already studied herding behavior in Portugal, the present study goes further by carrying out a study by industries (Financials, Industrials and Consumer Service); dividing assets in portfolios with different capitalizations (studying the possibility of herding concerning the homogeneity of market capitalization); and contrasting linear and non-linear models of herding behavior. We also contribute to the literature by conducting an analysis of the effect of the subprime and sovereign debt crises, and by incorporating GARCH models in the measurement of
5 herding behavior. The latter is particularly important as change in stocks’ volatility across time can be mistaken for cross-section variability (Hwang and Salmon, 2004).
Our results show the prevalence of herding behavior in the nonlinear model, especially in crises, but this behavior was not detected with the linear model.
The present study is organized into five sections. In Section 2 we revise the literature; in Section 3 we describe the hypotheses, data and methodology; in Section 4 we present the empirical results and discussion and finally, in Section 5 we conclude.
2. Literature review
2.1. Herding behavior causes and consequences
The literature not only explains the theoretical aspects that determine herding behavior, but presents empirical evidence of this behavior in several national markets. Human psychology plays a major role in explaining herding behavior. Using various existing theoretical models, Devenow and Welch (1996) argue that the tendency is to imitate the behavior of groups because people feel safe in groups. Herding behavior can also be analyzed from the perspective of contagion of investor sentiment, with this behavior being more common for less sophisticated investors (Lux, 1995).
Whether herding is triggered by irrational or rational behavior is an important subject to study. Besides physiological factors, information has a very important role. Banerjee (1992)’s model notes that participants may ignore their private information and mimic the decisions of others, unleashing herding behavior. In turn, Bikhchandani et al. (1992), using a model similar to Banerjee (1992), introduces the concept of informational cascades.
Avery and Zemsky (1998) note the fact that the models of Banerjee (1992) and Bikhchandani et al. (1992) assume that the price of assets is fixed. Therefore, Avery and Zemsky (1998) show that when prices adjust to available information, there is no herding behavior. However, they admit that more complex information structures, such as doubt or uncertainty about what other market participants know, can trigger herding behavior.
6 On the other hand, Froot et al. (1992) argue that in the short term, investors tend to use the same sources of information, even if these do not describe the fundamentals of assets in the best way.
Reputation and compensation of analysts and managers can generate herding. The key work of Scharfstein and Jeremy (1990) describes that managers tend to mimic the decisions taken previously by others to maintain their reputation.
Maug and Naik (2011) indicate that the reward of funds’ managers based on benchmark indexes may be an incentive to herd. Graham (1999), in turn, argues that analysts and managers with a high reputation tend to imitate each other due to fear of losing their high yields and status. According to Boyson (2010), if a manager moves away from the consensus behavior in order to maximize compensation, at the expense of a larger risk, he may turn out to be responsible for closing down the hedge fund.
It has been suggested that style investing, in which economic agents, notably institutional investors, select stocks based on specific characteristics (e.g. stock capitalization and momentum), is a contributory factor for herding (Gravriilidis et al., 2013b).
Whereas characteristic herding (investors being attracted by some characteristics in stocks – e.g. blue chips stocks, which is similar to style investing) and homogeneity of investment professionals (e.g. the same education and social backgrounds) produce unintentional herding, informational cascades, reputation and remuneration schemes originate intentional herding (Holmes et al., 2013).
Herding behavior can be more intense in certain periods. Investors in times of uncertainty naturally tend to imitate each other more (Gleason et al. 2004). For Christie and Huang (1995), investors acquire greater propensity for mutual imitation in periods of market stress, or great volatility. On the other hand, with the awakening of the Asian crisis of 1997 (Kim and Wei, 2002) and the recent global financial crisis of 2007/08 (Economou et al., 2011), the number of studies on herding behavior in crises increased.
Now, let us refer to the main economic repercussions of herding behavior. One of the most obvious effects of this behavior is that it may move asset prices away from their fundamental values, forcing investors to negotiate at inefficient prices (Christie and Huang, 1995), and questioning many economic models that do not admit the possibility
7 of market inefficiency (Tan et al., 2008). In addition, Bikhchandani and Sharma (2000) argue that herding can destabilize markets, as well as increase the volatility and fragility of the financial system. Dhaene et al. (2012) stresses that herding behavior increases systemic risk, speculative bubbles and crashes.
Another aspect is that in a market in which herding behavior is accentuated, the level of diversification of portfolios decreases, because assets are highly correlated and it is necessary to increase the number of assets in a portfolio to achieve the same level of risk diversification (Economou et al., 2011; Dhaene et al., 2012).
In short, herding negatively influences markets in several ways, generating behaviors that produce instability and inefficiencies, and may even provoke panic.
2.2. Main methodologies and empirical studies
Since the 1990s, many models were proposed to study and analyze herding behavior in financial markets. One of the methodologies to analyze herding behavior was developed by Lakonishok et al. (1992) and applied to the US investment funds, with the conclusion proving the existence of herding behavior. Using this methodology for Portugal, Lobão and Serra (2007) concluded that, over the period from 1998 to 2000, there was significant evidence of herding behavior with regard to funds from the UK and USA.
Kim and Wei (2002) examine the South Korean market before and during the Asian crisis, between 1996 and 1998. Using a methodology based on momentum trading, or trading feedback, they found that the non-resident foreign investors are more likely to herd through positive feedback trading, due to lack of information on the local market.
Hwang and Salmon (2004) studied the presence of herding in the South Korean market and in the US using a methodology that measures the relative dispersion of assets’ betas, from 1993 to 2002. They concluded that herding occurs in relation to the market portfolio. This study indicates that the Asian crisis of 1997 and the Russian crisis of 1998 pushed markets to equilibrium, refuting the evidence that pointed to an increase in herding in times of crisis (see Chiang and Zeng, 2010, for this latter argument).
Christie and Huang (1995) and Chang et al. (2000) analyze herding behaviour through the dispersion of assets’ returns. The measure in the former study is based on
8 the cross-sectional standard deviation (CSSD) and uses a linear model, while the latter study uses the cross-sectional absolute deviation (CSAD) and a non-linear model.
Christie and Huang (1995) analyze the US economy, including the NYSE and AMEX markets, from 1925 to 1988, and concluded that in periods of market stress, the dispersion of returns tends to increase, as predicted by the rational asset pricing model, contrary to the idea of herding behavior.
On the other hand, Chang et al. (2000) studies the U.S., Hong Kong, Japan, South Korea and Taiwan markets, inferring that in the U.S., Hong Kong and Japan there was shown no herding behavior, whereas in the emerging economies of South Korea and Taiwan there was evidence of that behavior. The analysis by stock market capitalization confirms the results based on the overall sample.
The works of Christie and Huang (1995) and Chang et al. (2000) inspired other works. For example, Chen et al. (2003) evaluated the behavior of investors in the Chinese stock market in 1996-2002, based on the CSSD methodology and modelling conditional variance with GARCH models. In this study they confirmed the existence of herding behavior in the Chinese stock market, and it was concluded that this behavior is more prevalent in shares that can be traded by foreigners (Type B shares). They argue that herding is explained by foreigners’ lack of information, as Kim and Wei (2002) concluded for the South Korean market.
Tan et al. (2008) also studied the Chinese market from 1994 to 2003 with the CSAD methodology. They concluded that the herding phenomenon occurs, although, contrary to Chen et al. (2003), there is no distinction between type A and B shares.
In a recent study, Demirer et al. (2010), analyzed the herding behavior in the emerging market of Taiwan. This work is interesting because it compares different models. They not only presented the two methodologies based on individual returns of assets, CSSD and CSAD, but also the methodology of Hwang and Salmon (2004), based on the relative dispersion of assets’ betas. For the period from 1995 to 2006, researchers show that in 18 sectors, there was no evidence of herding in the linear model, except for the electronics sector. With regard to the non-linear model, and with the methodology of Hwang and Salmon (2004), herding was prevalent in all sectors, supporting Chang et al (2000)’s findings that herding exists in the Taiwanese market. This proves that the results
9 depend on the model used, justifying the use of two models (linear and nonlinear) in the present paper.
Chiang and Zeng (2010) using the CSAD methodology, presented a study on herding in the financial markets of 18 countries from 1988 to 2009. The results revealed the existence of herding in all Asian and developed countries, except in the USA. This evidence did not confirm the results of other studies which show that herding is more prevalent in emerging markets.
Some studies on herding behavior have already been conducted in Portugal. For example, Gavriilidis et al. (2013b) investigate mutual funds demand for stocks using Sias (2004) methodology; they find evidence of persistence in institutional demand, mostly due to herding, which does not disappear when investment styles are taken into account. The evidence of persistence in demand is found before and after the credit crisis (January 2008 – June 2011).
Holmes et al. (2013) study herding behavior in Portugal using the same methodology as Gavriilidis et al. (2013) and between January 1998 and December 2005. They conclude that herding existed among fund managers and the evidence under different market conditions is consistent with intentional herding for reputational reasons, remuneration and/or informational cascades. Similarly, Gavriilidis et al (2013a) find that the Spanish fund managers in most industries herd intentionally for information and career-related reasons.
Due to the global financial crisis of 2008, some European countries entered into serious difficulties. Economou et al. (2011) analyzes herding in Portugal, Italy, Greece and Spain from 1998 to 2008. They reveal that, in Greece and Italy, there was evidence of herding, while in Portugal the evidence was mixed, that is, it only existed when weighted returns were used. On the other hand, there was no herding in the Spanish market. This study also proves that the financial crisis of 2008 did not intensify the herding in those countries. Mobarek et al. (2014) also find that although the 2008 financial crisis and the euro zone crisis did not intensify herding in the Portuguese stock market, there is evidence of this behavior during periods of negative market return for the entire sample.
However, this study considers a limited crisis period, not covering the 2010 sovereign debt crisis that substantially affected domestic financial markets. Thus, causing the need
10 to analyze not only the subprime crisis, but also the sovereign debt crisis in this present paper, in order to assess whether herding behavior was more intense over crises in Portugal.
Economou et al. (2015) study the sovereign debt crisis for Euronext exchange group markets (Portugal, France, Belgium and the Netherlands); they conclude that herding behavior was present in Portugal, Belgium and the Netherlands during the crisis, but it was explained by the dynamics of the two largest markets (France and Netherlands) and not by domestic factors. Additionally, the authors conclude that joining Euronext led to the emergence of herding in France, Belgium and the Netherlands, and to an intensification of this behavior in Portugal.
The study of crises periods is important because there is no agreement on the effect of crises on herding behavior (Economou et al, 2015). For instance, according to Kim and Wei (2002), in the Asian crisis of 1997, foreign investors were feedback traders (buying when the market rises and selling when the market falls), systematically ignoring the fundamentals. Chiang and Zheng (2010) find that crises trigger herding behavior in the US and Latin American markets, but do not have a significant effect on this behaviour in other markets. Mobarek et al. (2014) finds that during crises herding behavior emerges in several countries (France, Italy, Spain, and Germany) where it was otherwise absent. Herding is more significant in continental and PIIGS markets during the 2008 financial crisis, and more important in Nordic countries during the euro zone crisis. In turn, Tan et al. (2008) showed that China's shareholders did not exhibit herding behavior during the Asian crisis, and Hwang and Salmon (2004) reach the same conclusion for the South Korean and US markets in the Asian and Russian crises.
3. Hypotheses, methodology and data 3.1. Hypotheses
The main goal of this paper is to analyze the existence of herding on the Portuguese stock market (NYSE Euronext Lisbon). This will be done for the market as a whole and for
11 sectors (PSI Financials, PSI Industrials and PSI Consumer Services) using two distinct methodologies, a linear one and a non-linear one, whilst also incorporating the modelization of conditional variance (GARCH models). The study is limited to these three sectors due to the fact that the other sectors of NYSE Euronext Lisbon do not include a sufficiently large number of firms to make a robust analysis of herding.
Therefore, the first hypothesis to be tested is that there is empirical evidence of herding behavior in Portugal ( ). Even though this hypothesis was already tested in other papers (Gavriilidis et al., 2013b; Holmes et al., 2013) and some use the same methodology (Economou et al., 2011; Mobarek et al, 2014), in this paper we control for the change in volatility across time and stress the impact of crises.
Herding may not be detected in the index covering all assets (PSI General), but it may exist by sector (Christie and Huang, 1995). Instead of taking the overall market as reference, investors may herd around firms that share common characteristics, notably from the same industry. Therefore, a sub-hypothesis is that herding behavior is stronger in some specific sectors ( ). Some industries have less herding because of stricter regulation (Christie and Huang, 1995) or a larger proportion of foreign shareholders (Demirer et al., 2010). Gavriilidis et al. (2013a) identify intentional herding in two of the main Spanish sectors, and suggest that this occurs because fund managers with less information are more concerned about their reputation when investing in the key sectors. These authors also find herding in the technology sector, which is characterized by medium-sized companies with higher risk, and they suggest that herding in this sector aims to reduce risk. Demirer and Kutan (2006) suggest that in China non-financial sectors may be subject to more herding than the financial sector because of firms with smaller capitalization and a smaller presence of institutional investors. Nevertheless, Demirer and Kutan (2006) do not find the presence of herding in any sector.
Our second hypothesis is that the evidence of herding behavior is more intense for stocks with smaller market capitalization ( ). Bikhchandani and Sharma (2000) suggest that there is a higher prevalence of imitation when investors and assets are similar (Lakonishok et al., 1992). Style investing based on specific stock characteristics, such as size is one reason for this (Falkenstein, 1996). Consequently, we divided all shares into three portfolios according to market capitalization, following Chang et al. (2000).
12 There are theoretical arguments both for and against hypothesis two. On one hand, we expect herding to be more prevalent in stocks with smaller capitalization because they are characterized by the availability of less information and by smaller liquidity. Information cascades, whereby investors follow others because of their superior information, are more likely in small securities (Wermers, 1999). On the other hand, herding may be more intense for stocks with larger capitalization if this phenomenon is driven by reputation and compensation reasons (Theriou et al., 2011) or by correlated information – investigative herding (Wemers, 1999).
For Taiwan, Hsieh (2013) finds that both institutional and individual investors herd more in small capitalization stocks, but the behavior is driven by different reasons. Theriou et al. (2011) conclude for the Greek market that mutual fund managers herd essentially in large capitalization stocks or in stocks belonging to the most visible indices, leading them to conclude that reputation is a driver of herding. Similarly, Fang et al. (2013) find for Taiwan that dealers herd more in relation to large capitalization securities; they argue that this suggests institutional herding is explained by correlated information. Finally, Chang et al. (2000) obtain different results for different markets: in Taiwan and South Korea there is herding in stocks with large and small capitalizations, but it is only found in Japan in the largest capitalization stocks.
The test of Hypothesis Two allows to correct a bias in testing herding. Indeed, small stocks may react differently from large stocks to market conditions and, thus, create dispersion in returns – especially when equally-weighted indicators of herding are used (Chang et al., 2000). If herding is found in the overall market as well as in small stocks, it strengthens the evidence in favor of herding.
The final hypothesis is that the subprime (2008) and sovereign debt (2010) crises exacerbated herding in Portugal ( ). This hypothesis stems from the fact that some authors argue that herding can be more pronounced in times of crisis (Kim and Wei, 2002; Chiang and Zheng, 2010; Mobarek et al., 2014). As herding is more intense when there is more volatility and market stress (Gleason et al., 2004; Kim and Wei, 2002), we define the hypothesize that herding may be more prevalent in periods of crisis. Mobarek et al. (2014) argues that in a crisis herding may be influenced by both domestic and international factors like the wakeup call hypothesis, flight to quality, liquidity, and risk premium
13 changes. The exit of foreign investors during a crisis may be associated with herding behavior.
3.2. Methodology
3.2.1. The linear model
In order to test the hypotheses, we use two distinct empirical models, the linear and the non-linear models. The linear model of herding behavior (Christie and Huang, 1995) is based on cross standard deviations of returns:
𝐶𝑆𝑆𝐷𝑡 = √∑ (𝑅𝑖𝑡−𝑅𝑚,𝑡) 2 𝑛 𝑖=1 𝑛−1 (1)
where 𝑅𝑖𝑡 is the share’s 𝑖 return, and 𝑅𝑚,𝑡 represents the simple average of all 𝑛 shares’ returns. As mentioned above, the arithmetic average of returns overweight stocks with small market capitalization causing biased results. For this reason, as an alternative alternative we also use in formula (1) the weighted average returns, computed as follows:
𝑅𝑚,𝑡 = ∑𝑛 𝛿𝑖
𝑖=1 𝑅𝑖,𝑡 (2)
Where 𝛿𝑖 1 is the weight of company 𝑖 in the market.
According to the rational asset pricing model, during periods of large volatility in asset prices, the dispersion of prices increases, whereas with herding, the dispersion tends to decrease. To test this hypothesis Christie and Huang (1995) use the following equation:
𝐶𝑆𝑆𝐷𝑡 = 𝛼 + 𝛽1𝐷𝑡𝐿+ 𝛽2𝐷𝑡𝑈 + 𝜀𝑡 (3)
1 The method of obtaining 𝛿
14 𝐷𝑡𝐿 = 1 if the market return on day t is at the lower end of the distribution of returns,
otherwise 0.
𝐷𝑡𝑈 = 1 if the market return on day t is at the upper end of the distribution of returns,
otherwise 0.
The upper and lower extremes of the return distribution are obtained from a 1% or 5% percentile of market returns. 2 If coefficients 𝛽
1 and/or 𝛽2 are positive and statistically
significant, this indicates the validity of the rational asset pricing model, but if they are negative and statistically significant, it indicates herding behavior in the market.
3.2.2. The nonlinear model
An alternative model is the nonlinear model (Chang et al., 2000) and is based on the cross standard absolute deviation of returns:
𝐶𝑆𝐴𝐷𝑡= ∑𝑁𝑖=1|𝑅𝑖,𝑡−𝑅𝑚,𝑡|
𝑁 (4)
As above, we consider simple average and weighted average returns by asset capitalization. The CSAD alone cannot detect herding behavior, instead this behavior is detected by the relationship between CSAD and asset returns. Therefore, we use the following equation for the market (or industry):
𝐶𝑆𝐴𝐷𝑚,𝑡 = 𝛼 + 𝛾1|𝑅𝑚,𝑡| + 𝛾2𝑅𝑚,𝑡2 + 𝜀
𝑡 (5)
The CSAD may have a non-linear relationship with returns that is captured by 𝛾2.
If the rational asset pricing model is correct, the relationship between the CSAD and
2 We choose the 1% and 5% percentile of market return to capture extreme up or down movements in the market. For example, a negative return below the 1% percentile is a strong decline in the market – one that occurs on less than 1% of the days.
15 market return will be linear, i.e. 𝛾2 = 0 (Chang et al., 2000). On the other hand, when there is evidence of herding, the coefficient 𝛾2 is negative and statistically significant, indicating a non-linear relationship. In this case, the CSAD increases with the market return, but at a decreasing rate, reflecting the fact that for higher yields the dispersion increases less due to herding.
The CSAD model can accommodate asymmetric behavior when the market rises or falls (Economou et al., 2011):
𝐶𝑆𝐴𝐷𝑖,𝑡 = 𝛼 + 𝛾1𝐷𝑢𝑝|𝑅
𝑚,𝑡| + 𝛾2(1 − 𝐷𝑢𝑝)|𝑅𝑚,𝑡| + 𝛾3𝐷𝑢𝑝(𝑅𝑚,𝑡) 2
+ 𝛾4(1 − 𝐷𝑢𝑝)(𝑅𝑚,𝑡)2+ 𝜀𝑡 (6)
The dummy (𝐷𝑢𝑝) assumes value 1 when returns are positive. When the two
coefficients that capture the nonlinear relationship between returns and dispersions, 𝛾3 and 𝛾4, assume negative and statistically significant values, there is herding behavior. And
in this case, if 𝛾4<𝛾3 it means that herding behavior is more prevalent in the days when the market is falling. Additionally, a WALD test is carried out to check the equality between coefficients 𝛾3 and 𝛾4. Thus, for a p-value larger than 10%, we accept the null hypothesis that the prevalence of herding is equal in both periods (market rise and market fall) - if the coefficients (𝛾3 and 𝛾4) are negative and statistically significant. This equation uses the
entire sample for estimating a single regression, unlike Chang et al. (2000) that separately estimate a regression for market rise and market fall.
In order to answer hypothesis 3, regarding the exacerbation of herding in crises, we considered two dummies, 𝐷𝑠𝑢𝑏𝑝𝑟𝑖𝑚𝑒 for the Subprime crisis and 𝐷𝑠𝑜𝑣𝑒𝑟𝑒𝑖𝑔𝑛 for the European sovereign debt crisis. Therefore, we present the following regression:
𝐶𝑆𝐴𝐷𝑖,𝑡= 𝛼 + 𝛾1𝐷𝑢𝑝|𝑅𝑚,𝑡| + 𝛾2(1 − 𝐷𝑢𝑝)|𝑅𝑚,𝑡| + 𝛾3𝐷𝑢𝑝(𝑅𝑚,𝑡) 2 + 𝛾4(1 − 𝐷𝑢𝑝)(𝑅𝑚,𝑡) 2 + 𝛾5𝐷𝑢𝑝𝐷𝑠𝑢𝑝𝑟𝑖𝑚𝑒(𝑅𝑚,𝑡) 2 + 𝛾6(1 − 𝐷𝑢𝑝)𝐷𝑠𝑢𝑝𝑟𝑖𝑚𝑒(𝑅 𝑚,𝑡) 2 + 𝛾7𝐷𝑢𝑝𝐷𝑠𝑜𝑣𝑒𝑟𝑒𝑖𝑔𝑛(𝑅𝑚,𝑡) 2 + 𝛾8(1 − 𝐷𝑢𝑝)𝐷𝑠𝑜𝑣𝑒𝑟𝑒𝑖𝑔𝑛(𝑅𝑚,𝑡) 2 + 𝜀𝑡 (7)
When one or more coefficients 𝛾5 to 𝛾8 is negative and statistically significant, we have to check (for each pair) using a Wald test if the full non-linear effect is zero in the
16 respective crisis, (for example: 𝐻0: 𝛾3 + 𝛾5 = 0 for the Subprime crisis during a period when the market is rising). When the null hypothesis is rejected (and the respective sum of coefficients is negative), we conclude that herding is more intense for the period (market rise or fall) in the crisis (Subprime or Sovereign).
3.2.3. Linear and nonlinear models incorporating the GARCH model for the conditional variance
Usually, the variance of the error term in regressions for financial data is not constant over time and has volatility clusters. So it becomes essential to model the variance of the error using GARCH (Generalized Autoregressive Conditional Heteroscedastic) models. Consequently, comparing the models CSSD and CSAD with and without the GARCH methodology is an interesting issue to study. The works that compare the estimated CSAD model with and without the GARCH methodology, found no large differences in results (Demirer et al., 2010; My and Truong, 2011), becoming a point of interest to test if the same happens in Portugal and for the CSSD model.
However, before estimating models using the GARCH methodology, it is necessary to confirm whether the data is appropriate for the intended analysis: there is no autocorrelation and there are ARCH effects in residuals. When the existence of autocorrelation of residuals is present (as assessed by the LM Test with 10 lags), the box-jenkins methodology will be adopted in order to remove such effects (introducing the necessary MA and AR element in the equation of returns). The optimal number of processes (ARMA) is selected through the Schwarz selection criterion. On the other hand, we perform the LM ARCH Test -with 𝑞 = 5 - to test the existence of ARCH effects, where rejecting the null hypothesis confirms the existence of ARCH effects.
After estimating the chosen GARCH model, the adequacy of the model needs to be assessed through diagnostic tests. We expect that after the estimation of the GARCH model the errors show neither autocorrelation nor ARCH effects. The GARCH model (1,1) is usually sufficient to capture the volatility clustering in the data, but when this is
17 insufficient, we choose the GARCH model (𝑝, 𝑞) with the lowest value in the selection criterion Schwarz.
On the other hand, financial data generally features leptokurtosis, and residuals are not normal. To accomodate this characteristic we use a matrix of variances-covariances heteroscedasticity-consistent (Bollerslev-Wooldridge).
3.2.4. Data and sample characterization
We use the database of Dathis NYSE Euronext Lisbon to obtain daily data of the closing price of shares of 73 companies listed on the Portuguese market from 2/1/2003 to 31/12/2012. 3 As previously mentioned, the focus of the present study is on the analysis
of the PSI Geral (73 assets), PSI 20 (33 assets) – (this combines the 20 largest companies in the market), PSI Financials (13 assets), PSI Consumer Services (18 assets) and the PSI Industrials (20 assets). The constitution of each index obtained in the Bloomberg database corresponds to the last day of each year and encompasses all companies that were under negotiation on that day, even if they abandoned the market later (dead
stocks). Finally, we gathered 2,564 daily observations for each index (1,812 for the PSI
Industrials).
The returns of each company i in period t was calculated as:
𝑅𝑖,𝑡 = ln(𝑝𝑖,𝑡) − ln(𝑝𝑖,𝑡−1) = ln ( 𝑝𝑖,𝑡
𝑝𝑖,𝑡−1)
Where 𝑝𝑖,𝑡 and 𝑝𝑖,𝑡−1 represent the closing price in periods 𝑡 and 𝑡 − 1, respectively. For the assets not traded on a given day, the return is null.
Given that the estimation can be affected by outliers (Economou et al., 2011), we eliminate all returns larger than 50% (in absolute terms).
3 The exception is the PSI Industrials, where the period considered is from 5/12/2005 to 31/12/2012, because the number of assets, three, present in this index before the initial period referred to was insufficient to perform an adequate analysis.
18 To estimate the linear and non-linear model, we use the weighted returns and the average returns of the market. The method of calculating the average market return is based on the simple arithmetic average (Christie and Huang, 1995; Chang et al., 2000). In this way, in formulas (2) and (4) average returns are obtained as:
𝑅𝑚,𝑡 = ∑𝑁𝑡=1𝑅𝑖,𝑡
𝑁 .
Where 𝑅𝑚,𝑡 represents the average return of the market in period 𝑡, while 𝑅𝑖,𝑡 corresponds to the individual return of company i in the same period, and 𝑁 represents the total number of companies in the index.
The method of calculating weighted returns (used in formulas (2) and (4)) requires the number of shares of each company (from Bloomberg). With this information and the closing price of shares, we have:
𝑀𝑎𝑟𝑘𝑒𝑡 𝐶𝑎𝑝𝑖𝑡𝑎𝑙𝑖𝑠𝑎𝑡𝑖𝑜𝑛 𝑖,𝑡 = 𝑃𝑖,𝑡∗ 𝑛𝑢𝑚𝑏𝑒𝑟 𝑜𝑓 𝑠ℎ𝑎𝑟𝑒𝑠𝑖,𝑡
Consequently, the total market capitalization of the index corresponds to:
𝑇𝑜𝑡𝑎𝑙 𝑀𝑎𝑟𝑘𝑒𝑡 𝐶𝑎𝑝𝑖𝑡𝑎𝑙𝑖𝑠𝑎𝑡𝑖𝑜𝑛 𝑡= ∑𝑁 𝑀𝑎𝑟𝑘𝑒𝑡 𝐶𝑎𝑝𝑖𝑡𝑎𝑙𝑖𝑠𝑎𝑡𝑖𝑜𝑛 𝑖,𝑡
𝑖=1
The weight that asset i has in the index in period t is:
𝛿𝑖,𝑡 = 𝑀𝑎𝑟𝑘𝑒𝑡 𝐶𝑎𝑝𝑖𝑡𝑎𝑙𝑖𝑠𝑎𝑡𝑖𝑜𝑛 𝑖,𝑡
𝑇𝑜𝑡𝑎𝑙 𝑀𝑎𝑟𝑘𝑒𝑡 𝐶𝑎𝑝𝑖𝑡𝑎𝑙𝑖𝑠𝑎𝑡𝑖𝑜𝑛 𝑡
, and the sum of weights of all companies for period 𝑡 is 1.
Finally, the companies listed in PSI Geral were divided into three distinct portfolios, according to market capitalization. Following Chang et al. (2000), and considering the
19 market capitalization of the last day of the year, we grouped stocks in groups according to their market capitalization. 4
Portfolio 1 comprises the first third of companies with the lowest market capitalization of the market, while Portfolio 2 includes the second third of stocks in terms of market capitalization, and Portfolio 3 concerns the third of companies with the highest market capitalization. The weighted and average returns for each Portfolio (Portfolio 1, 2 and 3) need to be recalculated, and this is done on a daily basis, for the different indexes as above.
4. Results and discussion
Now, we are going to analyze the linear and nonlinear models of herding with the goal of answering the research hypotheses. Firstly, applying the ADF test to the CSSD and CSAD series (simple and weighted averages) results reveal that they are stationary for all sectors and portfolios. 5
4.1. Empirical evidence of herding behavior (hypothesis 1)
4.1.1. The linear model
In order to answer the first hypothesis we begin by analyzing the linear model (equation (3)) estimated with OLS (Table 2). Dummy variables assume the value 1 for the extreme
4 The market capitalization of a company on the last day of the year determines in which portfolio it will belong during the following year. An exception is made for the year 2003 in which, due to the lack of data, we considered the market capitalization of the first day of the year.
20 values, both superior and inferior, using a distribution of returns of 1%6 or 5% 7. To correct
the autocorrelation and heteroscedasticity present in financial data, we use the methodology proposed by Newey-West, which provides consistent coefficients.
[insert Table 2 around here]
Analyzing Table 2 we conclude that for all sectors, both with average returns (Panel A) and weighted returns (Panel B), the estimated parameters are positive and statistically significant at 1%. These results validate the theory of rational asset pricing, which argues that in periods of market stress, returns’ dispersion increases.
The estimation of the linear model using the GARCH methodology and weighted returns is in Table 3 and divided into three panels.8 The test results needed to fulfill the
conditions for the estimation of GARCH models are in Panel A, the estimated coefficients using GARCH models are shown in Panel B, and finally, the diagnostic tests of the GARCH model are in Panel C.
[insert Table 3 around here]
We observe in Panel A that for all sectors it was possible to "remove" the autocorrelation. We realize that there are no ARCH effects for PSI 20, so the estimation of the GARCH model is not necessary in this case. Yet, we accept the null hypothesis
(p-value>5%) for the other sectors, and so the estimation is done through the GARCH model
in these cases. Diagnostic tests with GARCH modelization reveal the absence of autocorrelation and GARCH effects (Panel C).
6 For example, extreme returns for the PSI Geral on the positive end are above 1.901% and on the negative end are below -2.661%.
7 For example, extreme returns for the PSI Geral on the positive end are above 1.179% and on the negative end are below -1.485%.
8 Note that in the above estimations we have already corrected the standard errors for the existence of autocorrelation and heteroscedasticity (Newey-West correction type). However, financial series have extreme heteroscedasticity, with volatility clusters that are best modeled by GARCH models.
21 The coefficients (βL and βU ) are positive and statistically significant (Panel B). This
model, both for weighted returns and for average returns, is consistent with the validity of the theory of rational asset pricing model, like the results in Table 2. 9
4.1.2. The nonlinear model
The nonlinear model (equation (5)) is presented in Table 4 - average returns (Panel A) and weighted returns (Panel B). Results are extremely different from the linear model: there is evidence of herding in both panels in the PSI Geral. These results are similar to Economou et al. (2011) for Portugal, which found the existence of herding with weighted returns, but did not confirm the same for average returns. The divergent outcome in relation to average returns may be explained by a different sample period.
[insert Table 4 around here]
There is also evidence of herding for PSI 20 in both Panel A and B at 1% of significance. For PSI Financials, we note that on Panel A the coefficient 𝛾2 is negative and statistically significant at 1%, while in Panel B it is also negative but statistically significant only at 10%. Regarding PSI Industrials, there is clear evidence of herding with average returns (in Panel A), but when considering weighted returns (Panel B), there is no evidence of herding (although 𝛾2 is negative). The results tor PSI Consumer Services are also ambiguous: in Panel A there is evidence against herding, whereas in Panel B we prove the existence of herding (𝛾2 is negative and statistically significant at 5%).
In summary, concerning the non-linear model, we observe that there is significant evidence of herding both with average and weighted returns, especially for PSI Geral, PSI 20 and PSI Financials.
The nonlinear model allowing for asymmetric effects of returns
22 The nonlinearity identified may result from the fact that the dispersion of returns has different behaviors when the market rises and when the market falls. Therefore, in Table 5, we present the estimate of the CSAD nonlinear model (equation (6)) by OLS allowing for asymmetric effects of returns.
[insert Table 5 around here]
There is evidence of herding in the up market and down market at 1% significance in PSI GERAL, with both average and weighted returns. The estimated results suggest that there is larger prevalence of herding in periods of down market, as 𝛾3>𝛾4. 10
Results show the existence of herding in Panel A for the up market in PSI 20, however, there is no significant coefficient in the down market.11 In Panel B, herding is
significant in the up and down markets, but more pronounced in the latter (𝛾3>𝛾4).
We found negative and statistically significant coefficients at 1% for PSI Financials in up and down markets periods in Panel A, with a larger incidence of herding in times of market fall (𝛾3>𝛾4) – but the difference between coefficients is not statistically significant.
The estimated coefficients suggest that there is no evidence of herding in panel B.
There is a tendency for herding in the down market for PSI Industrials in Panel A, but not in Panel B. In turn, herding is significant at 10% for PSI Consumer services in periods of up market both in Panel A and B, but the same is not valid for the down market.
In conclusion, we confirm the existence of herding with asymmetric effects of return, and observe that results differ depending on whether average returns or weighted returns are considered. This is with the exception of the PSI GERAL and PSI Consumer Services that registered the same statistical results with both types of returns. This highlights that the use of weighted returns reduces the evidence of herding, notably at the sector level. This indicates that small capitalization stocks may be explaining the existence of herding, especially in sectors where the number of stocks is smaller.
10 The coefficients are statistically different at 10% significance only for the model with average returns – Table 5. 11 The coefficients are statistically different at 10% significance – Table 5.
23
The nonlinear model with conditional variance (GARCH) modelling
Let us now present the results pertaining to the non-linear model incorporating conditional variance modelling and eliminating the autocorrelation through AR and MA components. This is the most suitable model because it explores the non-linearity in the data and is less affected by outliers (Economou et al., 2011); in addition, it controls for GARCH effects in the residuals – OLS is not an appropriate estimation technique with these effects. Table 6 indicates that when average returns (Panel B1) are used in the model, PSI Geral and PSI Industrial show signs of herding with a significance of 5%. PSI Industrial includes manufacturing and construction firms, which together make the largest industry in terms of production (26.8% of total production 12). In this case, as suggested by Gavriilidis et al.
(2013a) herding may be justified because investors are particularly concerned about the effect on their reputation of investments in this industry, as it is the largest industry in the economy.
[insert Table 6 around here]
These results may be skewed due to the use of average returns, because they give too much importance to companies with small market capitalization, not authentically reflecting the market characteristics (Economou et al., 2011). Thus, in Panel B2 we use weighted returns, only observing herding behavior in PSI 20 at 10% level of significance. Table 7 shows the results for weighted returns with a model allowing for asymmetric effects, and shows herding behavior in PSI 20 for up market with a significance level of 5% (the same occurs with average returns 13). There is no evidence of herding in the other
indexes. The consideration of weighted returns only changed the conclusion on herding for the PSI Industrial. However, the impact of considering weighted returns was larger when we used OLS; this indicates that small firms played an important role in the tests for
12Source: Instituto Nacional de Estatística.
24 herding with OLS. But when we correct for GARCH effects, the small firms, which usually have larger return volatility, have a smaller effect on the conclusion on herding.
We do not confirm herding behavior around industry average. Even though there is evidence of herding in all industries when we use OLS with average returns, this disappears when the more suitable model with GARCH effects is used for weighted returns. That is, when the weighted returns are considered with GARCH models, herding only exists in PSI 20 for the up market, suggesting that modeling the volatility leads to less evidence of herding (compared with the results of Table 5). These results refute the evidence demonstrated by some researchers (for example My and Truong, 2011) that the GARCH modelization of residuals does not change the evidence of herding.
[insert Table 7 around here]
4.2. Herding behavior according to market capitalization (Hypothesis 2)
After analyzing results by sector, it is now important to test the existence of herding according to the similarity of market capitalization. The goal is to analyze if herding occurs in assets with similar capitalizations and whether companies with smaller market capitalization show a different behavior, because the level of information about them is lower. To a certain extent, this was already done when we analyzed PSI Geral and PSI 20, because the latter index includes the largest companies.
To analyze the different capitalization levels, we divide all assets into three different portfolios (Portfolio 1, 2, and 3), as explained above. As done for sectors, we estimate the linear and non-linear models using the GARCH method to model residuals and weighted returns, given that this method offers a better description of the market. In the linear model the estimated coefficients are positive and statistically significant 14, corroborating the
theory of a rational pricing model, as shown in the results obtained with OLS.
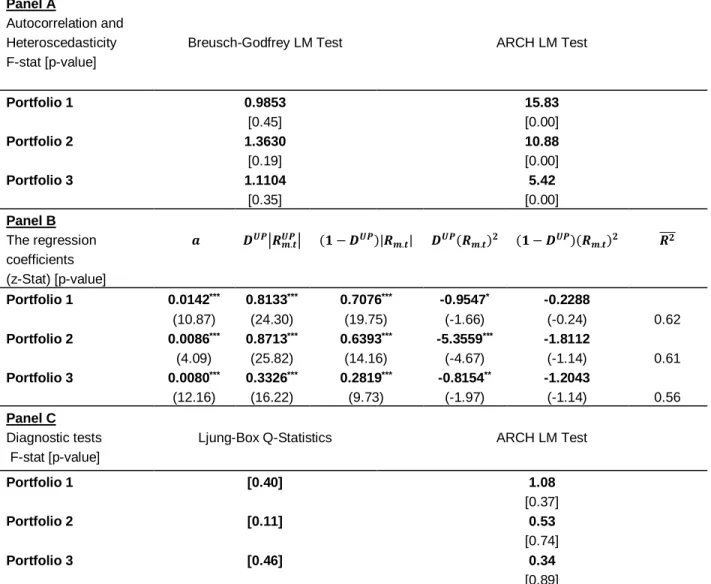
25 Table 8 presents the estimation of the nonlinear model with GARCH variance modelization, with asymmetric effects and weighted returns (equation (6)). Results show the existence of herding for portfolios in the up market (although only at 10% significance for portfolios 1 and 3). In other words, for all portfolios in up market periods there is evidence of herding, while for down market periods there is no evidence of herding. Similar results are obtained when using average returns.15 Since we find evidence of herding for
all portfolios, our results do not clarify whether herding is caused by information cascades, or by reputation, compensation or correlated information. Nevertheless, the results show that herding is also found in the smallest capitalization stocks, giving further support to herding behaviour, in line with Chang et al. (2000).
[insert Table 8 around here]
We summarize the impact of herding on sectors and portfolios for the non-linear regression model using equations (5) and (6) in Table 9. Results for the linear model are not summarized because all estimated results point towards the nonexistence of herding. With the nonlinear model and GARCH effects, we conclude that there is only evidence of herding in PSI 20 (up market), as well as in the portfolios organized by size (up market). This result demonstrates that herding tends to be more pronounced in groups of stocks with similar market capitalization, rather than in those from similar sectors. Note also that the fact that herding does not exist in down market suggest that in these periods investors tend to be more rational.
[insert Table 9 around here]
4.3. Herding behavior in crises periods (hypothesis 3)
26 We turn now to hypothesis 3 that indicates that herding is more intense during crises. The subprime financial crisis is defined as taking place from 01/08/2007 (Horta et al., 2015) to 31/12/2008 (Economou et al., 2011). Over this period there is a clear downward trend in PSI 20. The period of the sovereign debt crisis is studied from 01/04/2010 onwards, when the interest rates of the treasury bonds increased clearly, until 31/01/2012 when the interest rates of the treasury bonds reached its maximum of 13.85% and thereafter started to decrease. Looking at the evolution of PSI 20 (Graph 1), we observe a sharp decline in the index during the subprime crisis followed by a recovery in 2009, which is interrupted by a new period of decline at the beginning of 2010. The two crises did not follow immediately one another, justifying the study of two separate crisis periods.
The analysis rests on the PSI 20 and the three portfolios that showed clear evidence of herding in average and weighted returns using the GARCH model. Results for equation (7) for periods of up and down market are shown in Table 10.
[insert Table 10 around here]
In Panel B, in the Subprime and the Sovereign Debt Crises, the estimated coefficients for PSI 20 in the up market are negative and statistically significant. Therefore, the assessment to see whether the effect of (𝑅𝑚,𝑡)2 in crises is negative should be performed by testing the hypotheses: 𝛾3+ 𝛾5 = 0 or 𝛾3+ 𝛾7 = 0. However, by using the
Wald test there is no herding behavior in up market in the sovereign debt crisis (p-value = 0.28), while there is evidence of herding in the up market in the subprime crisis (p-value= 0.00).
In Portfolio 1, results point to herding in the subprime crisis in the down market (Wald test, p-value = 0.00), but the coefficients related with the sovereign debt crisis are not statistically significant. The coefficient allusive to the sovereign debt crisis for the up market is negative and statistically significant at 10% for Portfolio 2. In this way, the Wald test for 𝛾3 + 𝛾7 (p-value=0.00) suggests that in the Sovereign Debt Crisis herding in periods of market rise, exists. Finally, the coefficients regarding the subprime crisis and sovereign debt crisis for Portfolio 3 are negative and statistically significant at 1% and 5%, respectively, for the up market. However, the Wald test on the coefficients of the sovereign
27 debt crisis indicate that there is no herding in this period (p-value = 0.67). On the other hand, for the coefficients of the subprime crisis, the Wald test (p-value = 0.00) shows the existence of herding behavior.
These results suggest that the sovereign debt crisis and mostly the Subprime crisis created herding behavior, contrary to other studies (for example: Economou et al.. 2011; and Tan et al., 2008). However, our results are in line with the model of Avery and Zemsky (1998), which defends that uncertainty can produce herding. We must point out that outside periods of crises, we did not observe evidence of herding. 16
5. Conclusion
We conclude that there is no evidence of herding behavior in Portugal through the linear model using both average and weighted returns (Hypothesis 1). However, with the nonlinear model there is evidence of herding behavior in both PSI 20 in the up market and in PSI Industrials in the down market, although only in average returns in the latter. We argue that the results that deserve more credit are the ones from the non-linear model with GARCH modelization, and with this model there is less evidence of herding.
For the three portfolios organized by market capitalization - Hypothesis 2 -, both in average and weighted returns, there is herding when the market generates positive returns (up market). This result demonstrates that herding behavior tends to exist for groups of stocks with similar market capitalization, and not so much in those groups from similar sectors.
Concerning Hypothesis 3, results with the non-linear model with GARCH effects suggest that the PSI 20 suffered from herding in the up market in the Subprime Crisis. In relation to the portfolios organized by size, Portfolio 1 registered herding in the down market in the subprime crisis; Portfolio 2 registered herding in the sovereign debt crisis in the up market; and Portfolio 3 registered herding in the subprime crisis in the up market. We conclude that the Sovereign Debt Crisis and mostly the Subprime Crisis produced herding in Portugal, especially in the up market. On the other hand, results also show that
16 We also tested the effect of crises for the linear model. From these, we found no evidence of herding (these results are available upon request).
28 crises gave rise to herding behavior that were absent in periods not undergoing financial crises.
Our results show that Portugal is exposed to herding behavior during periods of crisis. This behavior has strong consequences for both investors and regulators, because it may intensify crashes, volatility, systematic risk and the fragility of the financial system; it deviates prices away from their fundamental values and creates asset bubbles.
This study concludes that investors should be aware that herding behavior is particularly intense during financial crises, and that risk diversification will be smaller at these times. More specifically, as herding occurs around firms with similar market capitalization, investment in firms with different market capitalizations will provide protection against herding.
Thus, there is the need for tight regulation and legislation to guarantee more balanced market outcomes and to prevent systemic risk with considerable impact on GDP, unemployment and foreign investment. If herding is explained by fund managers' remuneration schemes based on periodic performance assessment on a relative basis, regulators, the mutual funds’ industry and investors should take actions to change these schemes.
Regulators should encourage diversification of mutual funds’ investments across stocks by market capitalization (small, medium and large). This could be achieved by publicizing the correlation between the investments of mutual funds (for the overall market and for different groups of stocks’ market capitalization) so that investors in mutual funds can take this into account – Gavriilidis et al. (2013a).
Finally, crises are a contributory factor for herding, with destabilizing consequences on financial markets and institutions. This confirms the importance of the EU, international institutions and public institutions in general providing more and quicker financial aid and taking action in support of affected countries and thus stop the downward financial spiral at the outset.
29
References
Avery, C., Zemsky, P. (1998), “Multidimensional uncertainty and herd behavior in financial markets”, American Economic Review, 88, pp.724-728.
Banco de Portugal (2012), Relatório anual do Banco de Portugal, Lisboa.
Banerjee, A.V. (1992), “A simple model of herd behavior”, The Quarterly Journal of
Economics, 107 (3), pp.797-817.
Bikhchandani, S., Hirshleifer, D., Welch, I. (1992), “A theory of fads, fashion, custom, and cultural change as informational cascades”, Journal of Political Economy, 100 (3). Bikhchandani, S., Sharma, S. (2000), “Herd behavior in financial markets”, IMF Staff
Papers, 47 (3), pp.279-310.
Boyson, N.M. (2010), “Implicit incentive and reputational herding by fund managers”,
Journal of Empirical Finance, 17, pp.283-299.
Chang, E.C., Cheng, J.W., Khorana, A. (2000), “An examination of herd behavior in equity markets: An empirical perspective”, Journal of Banking & Finance, 24, pp.1651-1679. Chen, G., Rui, O.M., Xu, Y. (2003), “When will investors herd? Evidence from the Chinese
stock markets”, Journal of Financial Research, 37, 2-40.
Chiang, T.C., Zeng, D. (2010), “An empirical analysis of herd behavior in global stock markets”, Journal of Banking & Finance, 34, pp.1911-1921.
Christie, W.G., Huang, R.D. (1995), “Following the pied piper: Do individual returns herd around the market?”, Financial Analysts Journal, July-August, 31-37.
Dhaene, J., Linders, D., Schountens, W., Vyncke. D. (2012), “The Herd Behavior Index: a new measure for the implied degree of co-movement in stock markets”, Insurance:
Mathematics and Economics, 50, pp.357-370
Demirer, R., Kutan, Ali M. (2006), “Does herding behavior exist in Chinese stock markets?”, Journal of International Financial Markets, Institutions & Money, 16, pp. 123-142.
Demirer, R., Kutan, A.M., Chen, C.D. (2010), “Do investors herd in emerging markets? Evidence from the Taiwanese market”, Journal of Economic Behavior & Organization, 76, pp.283-395.
Devenow, A., Welch, I. (1996), “Rational herding in financial economics”, European Economic Review, 40, pp. 603-615.
Do, V., Guo-Sze Tan, M., Westerholm, P.J. (2008), “Correlated Trading in Concentrated Market”, Journal of International Finance and Economics, Vol. 8 (4), pp. 148-163.
30 Economou, F., Kostakis, A., Philippas, N. (2011), “Cross-Country Effects in Herding Behavior: evidence from south European markets”, Journal of International Financial
Markets, Institutions & Money, 21, pp.443-460.
Economou. F., Gavriilidis, K., Goyal, A., Kallinterakis, V. (2015), “Herding Dynamics in Exchange Groups: Evidence from Euronext”, Journal of International Financial
Markets, Institutions and Money, 34, pp. 228-244.
Fang, H., Lu, Y.-C., Yiang, T.-Y. (2013), “The decomposition and causes of securities dealers’ cascades in the Taiwan stock market”, Investment Management and Financial
Innovations, 10(3), 30-39.
Falkenstein, E, (1996), “Preferences for stock characteristics as revealed by mutual fund portfolio holdings”, Journal of Finance, 51, pp. 111–135.
Froot, K.A., Scharfstein, D.S., Stein, J.C. (1992), “Herd on the Street: informational inefficiencies in a market with short-term speculation”, The Journal of Finance, 47(4), pp.1461-1484.
Garber, P.M. (2000), The First Famous Bubbles, Cambridge, MIT Press.
Gleason, C.K., Mathur, I., Peterson, M.A. (2004), “Analysis of intraday herding behavior among the setor EFTs”, Journal of Empirical Finance, 11, pp.681-694.
Graham, J.R. (1999), “Herding among Investment Newsletters: theory and evidence”,
Journal of Finance, 54(1), pp. 237-268.
Gavriilidis, K., Kallinterakis, V., Leite Ferreira, M.P. (2013a), “Institutional industry herding: Intentional or spurious?”. Journal of International Financial Markets, Institutions and
Money, 26 (1), pp. 192-214.
Gavriilidis, K., Kallinterakis, V. & Leite Ferreira, M.P. (2013b), On the Impact of Style Investing over Institutional Herding: Evidence from a Highly Concentrated Market. Investment Management and Financial Innovations, 10 (4), pp. 27-42.
Holmes, P., Kallinterakis, V., Leite Pereira, M. P. (2013), “Herding in a concentrated Market: A question of intent”, European Financial Management, 19(3), pp. 497-520. Horta, P.J.B., Lagoa, S., Martins, L.F., (2012), “Unveiling investor-induced channels of
financial contagion in the 2008 financial crisis using copulas”, Quantitative Finance, 16:4, 625-637.
Hsieh, S.-F. (2013), “Individual and institutional herding and the impact on the stock returns: Evidence from Taiwan stock market”, International Review of Financial
Analysis, 29, pp. 175-188.
Hwang, S., Salmon, M. (2004), “Market stress and herding”, Journal of Empirical Finance, 11, pp.585-616.
Kim, W., Wei, S.J. (2002), “Foreign portfolio investors before and during crisis”, Journal of
Internacional Economics, 56, 77-96.
IMF (2006), “Portugal: Financial System Stability Assessment, including Reports on the Observance of Standards and Codes on the following topics: Banking Supervision, Securities Regulation, and Insurance Regulation”, Country Report 06/378
31 Lakonishok, J., Shleifer A., Vishny R.W. (1992), “The impact of institutional trading on
stock prices”, Journal of Financial Economics, 32, pp.23-45.
Lobão, J., Serra, A.P. (2007), “Herding Behavior: evidence from Portuguese mutual funds”, in Gregoriou, G.N. (ed), Diversification and portfolio management of mutual
fund, Palgrave Macmillan UK, Chapter 8, pp. 167-197.
Lux, T. (1995), “Herd behavior, bubbles and crashes.” The Economic Journal, 105 (July), pp. 881-896.
Mobarek, A., Mollah, S., Keasey, K. (2014), Journal of International Financial Markets,
Institutions ans Money, 32, pp. 107-127.
My, T., Truong, H.(2011), “Herding behavior in an emerging stock market: Empirical evidence from Vietnam”, Research Journal of Business Management, 5(2), pp.51-76. Maug, E., Naik, N. (2011), “Herding and delegated portfolio management: The impact of
relative performance evaluation on asset allocation”, The Quarterly Journal of Finance, 1(2), pp. 265-292.
Nofsinger, J.R., Sias, R.W. (1999), “Herding and feedback trading by institutional and individual investors”, The Journal of Finance, 54 (6), pp.2263-2295.
Scharfstein, D., Jeremy, S. (1990), “Herd behavior and investment.”, American Economic
Review, 80, 465–79.
Shleifer, A., Vishny, R. (2011), “Fire Sales in Finance and Macroeconomics”, Journal of Economic Perspectives, 80-1, pp.29-48.
Sias, R.W. (2004), “Institutional Herding”, The Review of Financial Studies, 17 (1), pp. 165-206.
Tan, L., Chiang, T.C., Mason, J.R., Nelling, E. (2008), “Herding Behavior in Chinese Stock Markets: an examination of A and B shares”, Pacific-Basin Finance Journal, 16, pp.61-77.
Theriou, N., Mlekanis, G., Maditionos, D. (2011), “Herding by mutual fund managers in the Athens Stock Exchange”, European Research Studies, XIV(4), 142-154.
Wermers, R. (1999), “Mutual Fund Herding and the Impact on Stock Prices”, Journal of
33
Tables
Table 1 – Data on Euronext Index in 2015
Market Total market capitalization (million euros)
Weight of top 10 stocks (%)
Lisbon (PSI 20) 50,541.55 90.47
France (CAC 40) 1,244,411.86 52.58
Belgium (BEL 20) 365,614.56 82.72
Amesterdam (AEX) 485,168.98 78.43