UNIVERSIDADE DE LISBOA
FACULDADE DE CIÊNCIAS
DEPARTAMENTO DE QUÍMICA E BIOQUÍMICA
Chemical Characterization and Biological Activity of
Cork Sub-Products
Rui Filipe da Silva Lúcio Gomes
Mestrado em Química
Especialização em Química
Versão Definitiva Versão Pública
Dissertação orientada por:
Professora Doutora Isabel Alexandra Caldeira Ribeiro Monge da Silva
Professora Doutora Susana Maria Marinho de Bastos Pinto Pina dos Santos
The presented thesis work was performed at the Chemical Biology and Toxicology
(CBT) laboratory, incorporated into the Research Institute for Medicines
(iMed.ULisboa) at the Faculty of Pharmacy, Universidade de Lisboa, under the
supervision of Professor Isabel A. C. Ribeiro Monge da Silva (FFUL). The internal
supervision was performed by Professor Susana Maria M. B. P. Pina dos Santos (FCUL).
Samples analysed in this thesis were kindly provided by SOFALCA, Lda.
"Eu queria, como tu, não saber que os outros não valem nada para os poder admirar como tu! Eu queria que a vida fosse tão divinal como tu a supões, como tu a vives! Eu invejo-te, ó pedaço de cortiça a boiar a tona d'água, à merce dos ventos, sem nunca saber que fundo que é o Mar!"
Agradecimentos
Em torno da realização deste projeto, nomeadamente no ambiente académico, gostava de agradecer:
À minha orientadora, Professora Doutora Isabel Ribeiro, que me acompanhou ao longo este projeto tão interessante e amplo e me acolheu nele com uma dedicação e paciência enormes, transmitindo sempre conhecimentos indispensáveis para a realização deste trabalho;
À Professora Doutora Susana Santos, que aceitou ser a orientadora interna, demonstrando sempre uma disponibilidade soberba;
À SOFALCA, por nos terem facultado as amostras e por nos receberem tão bem nas suas instalações, fornecendo informação privilegiada;
Ao Diretor da Faculdade de Ciências da Universidade de Lisboa, Professor Doutor José Martinho Simões, e à Diretora da Faculdade de Farmácia da Universidade de Lisboa, Professora Doutora Matilde Fonseca e Castro, por possibilitarem um acordo entre as Faculdades que me permitiu desenvolver este trabalho num ambiente novo;
Ao João Ferreira, responsável do equipamento de LC-MS pelo tempo investido nas análises necessárias durante este meu trajeto na FFUL;
Gostava de agradecer também aqueles que, fora do ambiente académico, me ajudaram a encontrar a motivação para continuar e lutar contra as adversidades, em especial:
À minha família, em especial aos meus pais e irmã, com os quais eu sempre pude contar nos bons e nos maus momentos, e que me ajudaram a ultrapassar as dificuldades ao longo deste ano;
À Sofia Assis, que me motivou e apoiou incomparavelmente;
Aos meus amigos, uns mais outros menos presentes, mas sempre dispostos a ajudar, e que levo no coração: Catarina Carapeta, Marisa Maia, André Janeiro, Paulo Coelho, Fábio Marques, Rúben Henriques, Patrícia Gírio e Diogo Pereira;
Ao Dô Clube de Aikido, por mais um ano de amizade, companheirismo e aprendizagem que tanto me molda física e espiritualmente, contribuindo para o meu desempenho académico;
Abstract
Cork is the outer bark of the Mediterranean tree Quercus suber L., and it is used in several industries due to aesthetic look, thermal and sound isolation capacities, although one of the main application is the production of cork stoppers. The cork, after being cleaned and grinded, is boiled and compressed (simultaneously), in order to agglutinate using the endogenous resin. Afterwards, the block is cut with the necessary dimensions. Cork sub-products (CKSP) are generated in the cork processing industry, and have a high content in organic compounds. Nowadays, environment-friendly behaviours are of extreme importance, so finding a way to reuse/recycle industrial residues is mandatory.
This work aims the chemical characterization and biological activity evaluation of cork sub-products in order to find possible applications for these sub-products, assuring a more sustainable cork production. CKSP were supplied by SOFALCA Lda, a cork processing company. Samples were characterized in terms of physical and chemical properties. The pH, the conductivity, the refractive index, the total dried residue, the turbidity and dissolved oxygen content of samples were assessed. In order to evaluate the chemical composition of samples, total phenolic content and total flavonoid content were determined using Folin & Ciocalteu and aluminium chloride methods, respectively. Both methods were performed with a microscale approach so a previous method validation was required. To identify the compounds present in the samples, Liquid Chromatography with tandem Mass Spectrometry (LC-MS/MS) was performed. Identification was based on LC-MS/MS spectrum, as well as multi reaction monitoring (MRM) approach with several standard compounds and their specific transition.
Antioxidant activity of the samples was assessed by the 2,2-diphenyl-1-picrylhydrazyl (DPPH) assay, lipid peroxidation inhibition capacity assay and oxygen radical absorbance capacity (ORAC) assay.
Antimicrobial activity of samples was tested on planktonic cells by the disk diffusion assay and the broth microdilution method to assess the minimum inhibitory dilution, and on sessile cells using resazurin assay for biofilm quantification. Several microorganisms were used for the mentioned assays.
From the performed chemical and biological characterization, these sub-products revealed a great potential as antioxidant and antimicrobial complex mixture. Moreover, some sub-products revealed for the first time biofilm inhibition capacity that must be exhaustively studied in future work.
Keywords: Quercus suber L.; Cork sub-products; Cork sub-products constituents; antioxidant
Resumo
A cortiça é a casca obtida a partir da espécie Quercus suber L., uma árvore constituinte do ecossistema do montado vulgarmente conhecida como sobreiro, na qual funciona como casca. Frequentemente usada em diversas indústrias devido às suas capacidades isoladoras a nível térmico e acústico (como na construção civil e indústria automóvel), sendo uma das principais utilizações da cortiça a produção de rolhas. Esta matéria-prima é utilizada desde a antiguidade como vedante, tendo-se observado o aumento da sua importância económica a partir do século XX, quando se começou a utilizar a capacidade natural desta matéria em formar aglomerados. Hoje em dia cerca de 50 % da cortiça europeia tem origem portuguesa, representando uma importante fração da economia do país. Deste processo resultam vários tipos de subprodutos. Estes subprodutos apresentam um elevado conteúdo em compostos orgânicos que podem constituir um problema para o ambiente. Nos tempos atuais, estratégias e comportamentos amigos do ambiente são de extrema importância e, como tal, encontrar formas de reutilizar/reciclar resíduos industriais resultará numa mais-valia a nível económico e ambiental.
O presente trabalho tem como objectivo a caracterização química e biológica de subprodutos do processo de produção de derivados da cortiça, com vista a encontrar possíveis aplicações para estes resíduos, assegurando uma produção mais sustentável e amiga do ambiente. Para a realização deste trabalho foram necessárias amostras de subprodutos da indústria da cortiça, que foram cedidas pela Sociedade Central de Produtos de Cortiça, Lda. (SOFALCA).
Neste trabalho, foram realizados diversos ensaios em subprodutos da cortiça, com o intuito de caraterizar as propriedades físicas e químicas dos mesmos. Foi avaliado o pH, a condutividade, o índice de refração, o resíduo seco total, a turbidez e o oxigénio dissolvido. Sendo a cortiça um produto natural bastante rico em compostos fenólicos e flavonoides, foi analisado o conteúdo destes compostos nos subprodutos. O conteúdo em compostos fenólicos e em flavonoides foi avaliado pelo método de Folin & Ciocalteu e do cloreto de alumínio, respetivamente. Ambos os métodos foram realizados em microescala e, como tal, foi necessária uma validação prévia dos mesmos. Para a validação testou-se a linearidade, a gama de trabalho com base na homogeneidade de variâncias, o limite de deteção e o limite de quantificação e avaliou-se a repetibilidade do método. A avaliação do teor em compostos fenólicos e flavonóides foi obtida por comparação com a concentração em equivalentes de ácido gálhico e catequina, respetivamente. A identificação dos compostos presentes nos subprodutos foi feita recorrendo a cromatografia líquida associada a um sistema em tandem com um espectrómetro de massa do tipo triplo quadrupólo, com ionização por electrospray. A identificação dos compostos presentes nas amostras foi baseada nos espectros de LC-MS/MS obtidos e também recorrendo à abordagem de monitorização de reação múltipla, que utiliza padrões e as suas respetivas transições específicas.
A capacidade antioxidante dos subprodutos foi avaliada por métodos distintos, nomeadamente o método do 2,2-difenil-1-(2,4,6-trinitro)hidrazil (DPPH), o método de aferição da capacidade de inibição da peroxidação lipídica e da aferição da capacidade da absorver oxigénio radicalar (ORAC). Os subprodutos revelaram uma elevada capacidade antioxidante.
A actividade antimicrobiana dos subprodutos foi testada em células planctónicas usando o método da difusão de disco e o método da microdiluição para determinar a diluição mínima inibitória. Foi também estudada a capacidade de inibição no biofilme e quantificada a sua
viabilidade celular recorrendo ao método da resazurina. Foram utilizadas várias espécies de microrganismos para estes efeitos.
Em suma, os subprodutos estudados revelaram um grande potencial como fonte de compostos naturais com atividade antioxidante face a radicais livres. Apresentaram ainda propriedades antimicrobianas, com potencialidades mais específicas como a de diminuir a viabilidade do biofilme formado por algumas bactérias, ainda não reportado na literatura para amostras provenientes da indústria corticeira.
Palavras-Chave: Quercus suber L.; subprodutos da cortiça; constituintes de subprodutos da
Publication of Results
Communications
Gomes, R., Santos, S., Duarte, N. e Ribeiro, I.A.C., “Implementation of microscale methods for
quantification of phenolic and flavonoid compounds on natural products”, 8th iMed. ULisboa Postgraduate Students Meeting (iPSC), 14 e 15de Julho de 2016, Faculdade de Farmácia da
Abbreviation and Symbols List
[M-H-] – Deprotonated MoleculeAAPH - 2,2′-Azobis(2-methylpropionamidine) dihydrochloride AO – Antioxidant
AUC – Area under the curve BHI – Brain Heart Infusion BHT – Butylated Hydroxytoluene C – Catechin
C.I. – Confidence Interval CA – Caffeic Acid
CE – Catechin Equivalents CKSP – Cork Sub-Products
CLSI - Clinical and Laboratory Standards Institute DAD – Diode Array Detector
DOC – Dissolved Oxygen Content DPPH - 2,2-diphenyl-1-picrylhydrazyl ECM – Extra Cellular Matrix
ESI – Electro Spray Ionization
FFUL – Faculdade de Farmácia da Universidade de Lisboa (Faculty of Pharmacy, University of Lisbon)
GA – Gallic Acid
GAE – Gallic Acid Equivalents
GPYA – Glucose-Peptone-Yeast extract Agar HPLC – High Performance Liquid Chromatography IC50 – Half maximum inhibitory concentration ISO – International Standards Organization
J.C.G.M. – Joint Committee for Guides in Metrology
LC-ESI-MS/MS – Liquid Chromatography-Electrospray Ionization-Mass Spectrometry/Mass Spectrometry
LC-MS – Liquid Chromatography coupled to Mass Spectrometry LOD – Limit of Detection
LOQ – Limit of Quantification
m/z – Mass-to-charge ratio
MHA – Muller Hinton Agar MHB – Muller Hinton Broth
MID – Minimum Inhibitory Dilution MMR – Multi Reaction Monitoring MTP – Microtitier Plate
MTR – Methilicin Resistant MTS – Methilicin Susceptible
N – Number of replicates
n – Refraction index
NATA – National Association Testing Authorities NMR –Nuclear Magnetic Ressonance
OD – Optical Density
ORAC – Oxygen Radical Absorbance Capacity ppb – parts per billion
ppm – parts per million
R2 – Coefficient of determination RI – Refractive Index
RNS – Reactive Nitrogen Species ROS –Reactive Oxygen Species
RPMI - Roswell Park Memorial Institute SD – Standard Deviation
TDR – Total dried residue TE – Trolox Equivalents TFC – Total Flavonoid Content TIC – Total Ion Current TPC – Total Phenolic Content TSA – Trypto-caseín Soy Agar TSB – Trypto-caseín Soy Broth UV – Ultra violet
WHO – World Health Organization λ – Wavelength
Index
Agradecimentos ... V Abstract ... VI Resumo ... VII Publication of Results ... IX Abbreviation and Symbols List ... X Index of Figures ... XV Index of Tables ... XVI Index of Annexes ... XVII
Chapter 1 Introduction ... 1
1.1 Discovering cork and it’s applications ... 2
1.2 Chemical composition of Cork ... 3
Chapter 2 Physical and chemical characterisation of CKSP ... 8
2.1 Introduction... 9
2.2 Material and reagents ... 10
2.2.1 Equipment ... 10 2.2.2 Samples ... 10 2.3 Methods ... 10 2.3.1 pH measurement ... 10 2.3.2 Conductivity ... 10 2.3.3 Refraction index ... 11 2.3.4 Turbidity ... 11
2.3.5 Total dried residue ... 11
2.3.6 Dissolved Oxygen Content ... 11
2.3.7 Total Phenols and Flavonoids Quantification ... 13
2.3.2 Total Phenolic content (TPC) ... 15
2.3.3 Total Flavonoid Content (TFC) ... 16
2.3.4 Characterization of samples content by LC-MS/MS... 16
2.4. Results ... 18
2.4.1 Physical and chemical characterisation ... 18
2.4.2 Validation ... 18
2.4.3 TPC and TFC content ... 20
2.4.4 LC-MS results ... 20
2.5. Conclusion ... 21
Chapter 3 Antioxidant activity ... 22
3.2 Materials and reagents ... 25 3.2.1 Materials ... 25 3.2.2. Equipment ... 25 3.3 Methods ... 25 3.3.1 Samples preparation ... 25 3.3.2 DPPH radical-scavenging activity... 25
3.3.3 Inhibition of lipid peroxidation ... 26
3.3.4 Oxygen Radical Absorbance Capacity (ORAC) ... 27
3.4 Results ... 29
3.4.1 DPPH radical-scavenging activity results ... 29
3.4.2 Inhibition of Lipid peroxidation ... 29
3.4.3 Oxygen Radical Absorbance Capacity (ORAC) ... 29
3.5 Conclusion ... 30
Chapter 4 Antimicrobial activity ... 31
4.1 Introduction... 32
4.2 Material and methods ... 33
4.2.1 Chemicals ... 33
4.2.2 Equipment ... 33
4.2.3. Samples ... 33
4.2.3 Microorganisms, culture conditions and sample preparation ... 33
4.3 Antimicrobial activity ... 34
4.3.1 Planktonic cells assays ... 34
4.3.2 Biofilm formation inhibition ... 35
4.3.3 Cells hydrophobicity ... 36
4.4 Results ... 37
4.4.1 Planktonic cells assays ... 37
4.4.2 Biofilm viability results ... 37
4.4.3 Cells hydrophobicity results ... 37
4.5 Conclusions... 38
Chapter 5 Final remarks and future perspectives ... 39
References ... 41
Index of Figures
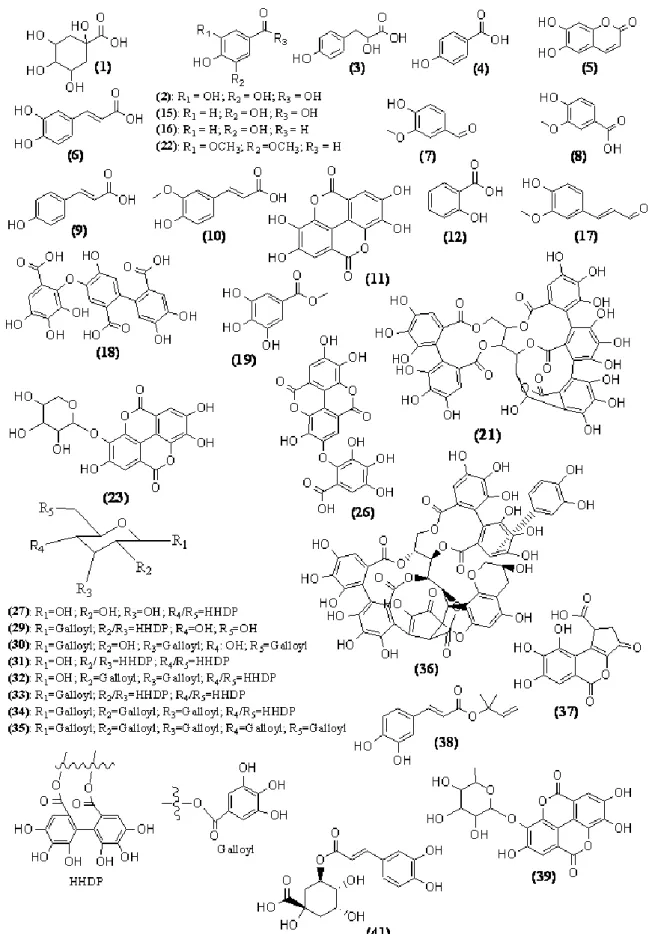
Figure 1.1 - Chemical structures of some of the identified phenolic compounds present in cork. 6
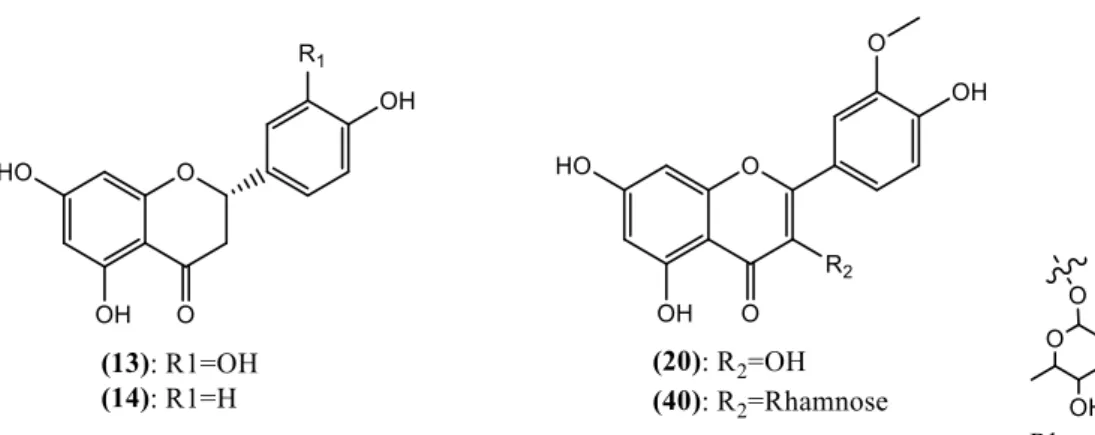
Figure 1.2 - Flavonoids identified as cork constituents. ... 7
Figure 2.1 - Scheme of total solid residue procedure and its respective samples. ... 11
Figure 2.2 - TPC and TFC obtained calibration curves and normalized residues. A – TPC calibration curve; B – TPC normalized residues; C – TFC calibration curve; D – TFC normalized residues. ... 18
Figure 3.1 - Caffeic acid and quercetin chemical structures A – Phenolic compound; B – Flavonoid... 24
Figure 3.2 - Reaction of DPPH radical with a hydrogen donor. ... 25
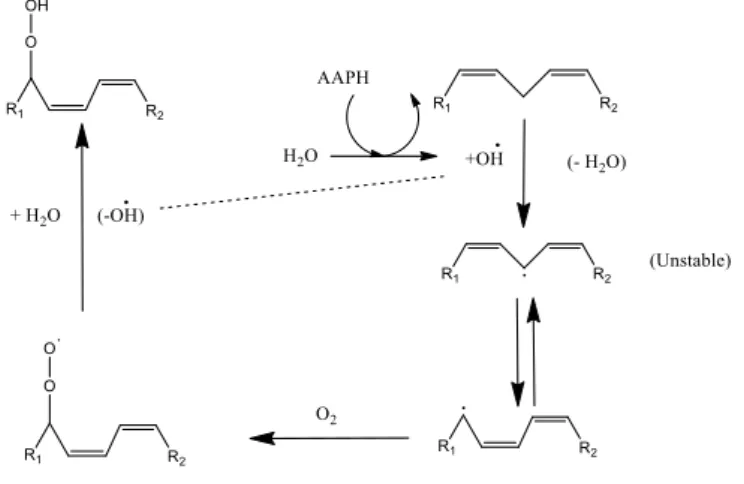
Figure 3.3 - Lipid peroxidation cycle. ... 26
Figure 3.4 - AAPH azo initiator production of ROO. compounds. ... 27
Figure 3.5 - ORAC reaction scheme. ... 28
Index of Tables
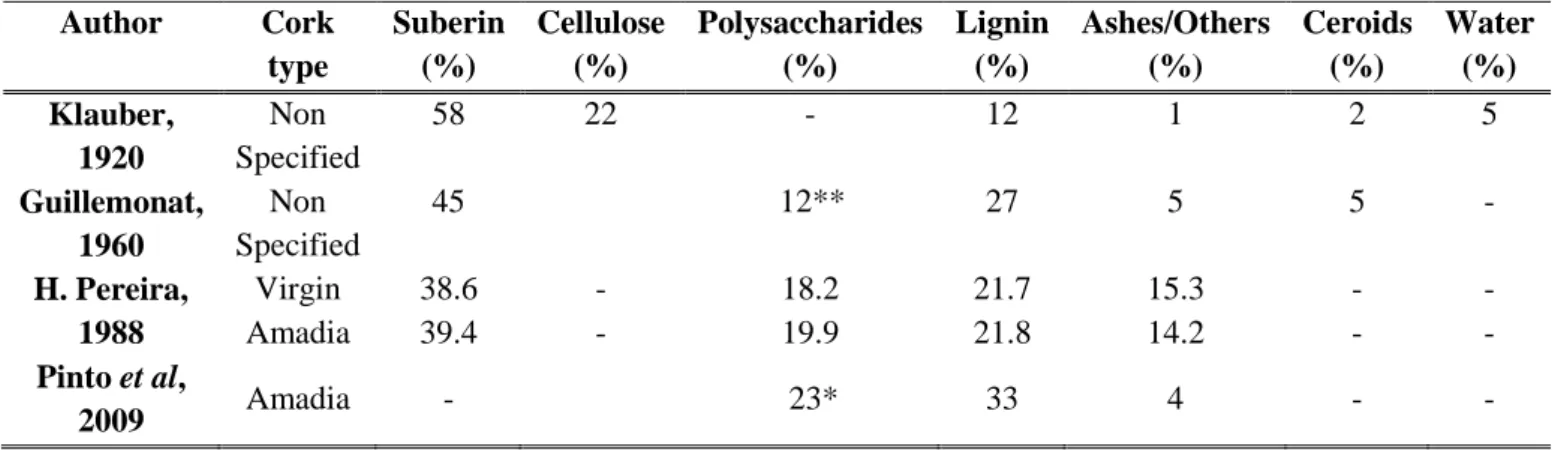
Table 1.1 - Cork chemical composition according to different authors. ... 4
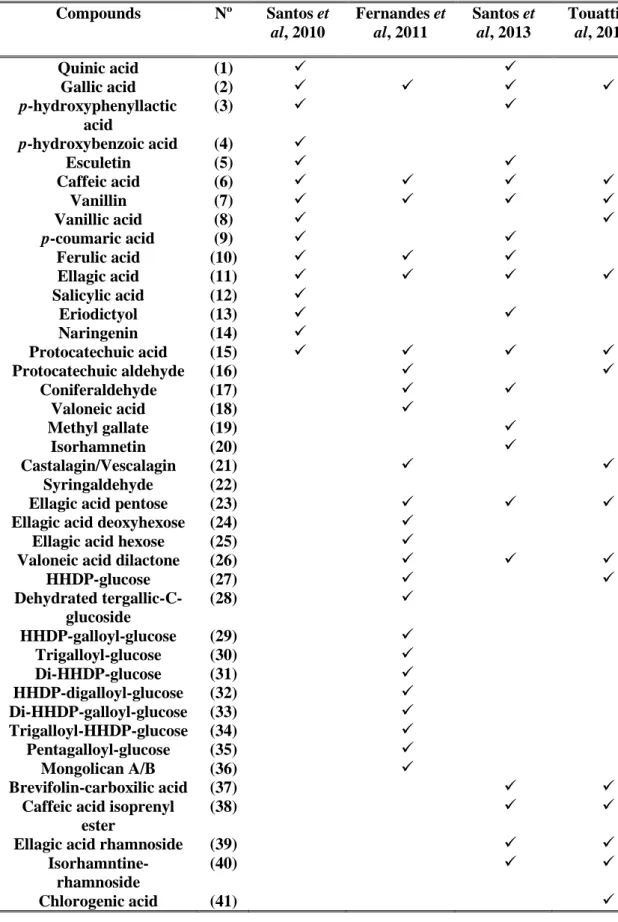
Table 1.2 - Identified compounds on cork related products over the last few years. ... 5
Table 2.1 - MRM specific transition information for the used standard compounds. ... 17
Index of Annexes
Annex I – Gomes, R., Santos, S., Ribeiro, I.A.C., “Implementation of microscale methods for
quantification of phenolic and flavonoid compounds on natural products”, Faculdade de
Chapter 1 Introduction
“You must never be fearful of what you are doing when it is right.”
1.1 Discovering cork and it’s applications
Cork is the bark of a Mediterranean tree, commonly found in Portugal, Spain, Morocco, Algeria, Tunisia and in some parts of France and Italy, named Quercus suber L. (Souza, 2012). These trees have high life-span, are able to sequester carbon dioxide from the atmosphere (Demertzi et al., 2016) and can endure difficult weather conditions due to the protection made by the bark (Gil, 2015a). The EU is the world’s biggest cork producer (80%), being almost 50% of the production originated from Portugal, playing a very important role in the economy and ecosystems of the country (Sierra-Pérez et al., 2015).
There are three types of cork, with different economic and application interests. Producers have to wait about 20 to 30 years to remove the first produced cork, known as “virgin cork”. After that, the cork-oak tree, by being exposed to several environmental agents, starts producing a new coating bark. This produced bark presents a traumatic nature due to recent exposition to environmental factors. After the removal of this second cork, the oak tree manages to produce a specific cork that reveals a homogeneous structure and growth, appropriate for the stoppers production. Both types of cork possess an inner tissue that differs from the virgin cork and conceals them different chemical composition (Silva, 2010).
Cork oak is extracted from the tree using cutting tools, where axes are usually the election tool, with a very cautious procedure, due to the risk of damaging the tree while cutting the oak, leading to death of the inner cells. That damage might interrupt the oak production around that spot, or in the worst case scenario, expose either the tree or the cutting material to parasites that have a host preference for Quercus trees, like Biscogniauxia mediterranea, commonly known as charcoal canker (Henriques, 2015) due to infected oak being similar to charcoal. B. mediterranea is known to be one of the higher impact factors on the wrecking of the montado ecosystem, with the capacity to kill cork-oak trees (Santos, 2003). Along with increased temperatures, wildfires and urbanization, these factors constitute serious problems to the cork production sector (Oliveira and Costa, 2012).
Nevertheless, cork is a widespread use material, and cork based products can be
obtained through a sustainable removal (Silva, 2010). Cork is mainly used as a sealing agent since the ancient times, but only on the XX century a great commercial growth occurred (Gil, 2015a). It is so effective that champagne can be preserved in the original bottles for around 170 years. This was an occasional discover in 2010 when exploring a shipwreck on the Baltic Sea (Jeandet et al., 2015). The shipwrecked champagne was chemically analysed and the results, compared to today’s wines, allowed to conclude that besides having an extremely high sugar content (providing usual tastes for that time period) it revealed low levels of acetic acid, responsible for the specific taste of spoiled wines (Jeandet et al., 2015).
Despite being used as stoppers, cork has many applications on nanotechnology, textiles (Nunes et al., 2013), can be used as sorbent in different industries (e.g. pharmaceutical and wastewater treatment (Mestre et al., 2007; Sfaksi et al., 2014) and on the construction industry field. Cork can be used as a construction material due to the low thermal and electrical conductivity with low abrasion values that are independent from humidity and temperature. It is a flexible light weighted material capable of thermal, acoustic and vibration isolation (Gil, 2015b), and can be used as an aggregate for concrete (Matos et al., 2015). This versatile material has been applied to new industries, like furniture, toys and automobile. In the last case, the luxury and decorative properties of cork are being used in gears and brake knobs, steering wheels and door panels for some brands prototypes, like Mercedes-Benz (Gil, 2015b). Still in the automobile industry, the weight and isolating properties of cork might make it a serious candidate to be used on renewable energies based cars (Gil, 2015b).
1.2 Chemical composition of Cork
In 1920, Klauber wrote the first report on cork composition, where he identified some of the main families of constituents. Yet, the first studies on the chemical composition of cork are dated from 1787 by Brugnatelli, to 1807 and 1815 by Chevreul, (Silva, 2010). Later on, Guillemont (1960) and Pereira (1988), amongst others, also presented extra composition results. Pereira studied the chemical composition of two different types of cork and was able to identify specific monosaccharides like glucose, xylose, arabinose, galactose, mannose and rhamnose. The results obtained by Klauber, Guillemonat, Pereira and Pinto regarding the chemical composition of cork are presented in Table 1.1.
From the chemical constitution of cell walls of cork, compounds are classified according to their structural and non-structural role. As structural compounds, suberin is a lipidic polimeric structure, responsible for the mechanical properties and the hydrophobic profile of cork (Fortes et al., 2004). Also cellulose, one of the main structural polysaccharides, was identified as a structural constituent in 1927 by Zetsche and Rosenthal (Fortes et al., 2004). Moreover, other polymeric macro molecules like lignin (obtained from cinnamyl alcohols (Markham, 1982) and polysaccharides are also part of the structural composition (Fortes et al., 2004). Yet, the exact knowledge about the chemical structure of the main components of cork remains unknown (Fortes et al., 2004).
Regarding the non-structural constituents, these are classified as extractives and inorganic. The first are low molecular mass compounds extractable using an adequate solvent with no alteration to the mechanical properties of the cell walls, while the inorganics are commonly known as ashes (Fortes et al., 2004). Tannins and polyphenols can be obtained from the extractive fraction of cork (Gabrielli et al., 2016; Gil, 2015a). The presence of elagitannins and phenolic compounds (e.g. vanillin, coniferaldehyde, coumarins, ellagic, gallic, protocatechuic and caffeic acids, and synaptic aldehyde) has been reported by some authors (Santos et al., 2010), alongside with other several phenolic compounds and flavonoids (Conde
et al., 1998).
Nowadays, studies concerning the phenolic constituents of cork can be found on the literature (Santos et al., 2013). Although the results vary and when comparing the reported composition results caution must be taken, due to the direct influence that the used method plays on the final outcome (Pereira, 2013), on top of the natural variability of cork from the same forest, (Pereira, 2013) and from the same tree (Conde et al., 1998).
Studies towards the identification of phenolic extracts of cork allowing to identify compounds with molecular weight ranging 138 to 1176 g mol-1 have been reported. Some phenolic compounds, flavonoids and tannins are reported to be constituents of cork products (Table 1.2). Structures of some identified compounds are presented in Figure 1.1 and Figure
1.2.
Over time, several of these phenolic and flavonoid compounds have been reported to present useful properties. An extensive research about the health benefits of natural phenolic and flavonoid compounds led to a high interest on these two families of compounds. Both families of compounds reveal radical scavenging, antioxidant and cytotoxic properties (Laranjinha e Cadenas, 1999). Moreover, their capacity to act as a natural protecting agent against microorganisms has been studied (Gil, 2015a).
Both natural hydroxybenzoic and hydroxycinnamic acids and their respective derivatives have antioxidant activity (Shahidi and Ambigaipalan, 2015). Hydroxybenzoic acids include gallic, protocatechuic (Brewer, 2011), ellagic (Salem et al., 2016), vanillic,
p-hydroxybenzoic and syringic (Shahidi and Ambigaipalan, 2015), while hydroxycinnamic acids comprise of caffeic (Laranjinha and Cadenas, 1999), p-coumaric (Brewer, 2011), ferulic (Salem
et al, 2016) and chlorogenic acids (Shahidi and Ambigaipalan, 2015). Flavonoids, specifically
flavanones, like naringenin (Jabbari and Jabbari, 2016) and eriodictyol (Shahidi and Ambigaipalan, 2015) also reveal antioxidant capacity.
As antimicrobial agents, gallic and caffeic acids have been reported to inhibit growth of different types of bacteria such as Escherichia coli, Staphyloccocus aureus and Pseudomonas
aeruginosa (Lima et al., 2016). Also, p-hydroxybenzoic and protocatechuic acids were used to
assess the growth inihibion of Staphyloccocus aureus, Bacillus cereus, Escherichiea coli and
Pseudomonas aeruginosa (Gutiérrez-Larraínzar et al., 2012), and ellagic acid inhibited Vibrio chlorae, Shigella dysenteriae and Campylobacter spp (Landete, 2011). In addition, ferulic and
salicylic acids were able to significantly inhibit bacterial biofilm for Bacillus cereus and
Pseudomonas fluorescens when used simultaneously (Lemos et al., 2014).
Table 1.1 - Cork chemical composition according to different authors. 1
Author Cork type Suberin (%) Cellulose (%) Polysaccharides (%) Lignin (%) Ashes/Others (%) Ceroids (%) Water (%) Klauber, 1920 Non Specified 58 22 - 12 1 2 5 Guillemonat, 1960 Non Specified 45 12** 27 5 5 - H. Pereira, 1988 Virgin 38.6 - 18.2 21.7 15.3 - - Amadia 39.4 - 19.9 21.8 14.2 - - Pinto et al, 2009 Amadia - 23* 33 4 - - * Carbohydrates ** Cellulose + Polysaccharides 1 Cited by Silva (2010).
Table 1.2 - Identified phenolic compounds on cork related products over the last few years. Compounds Nº Santos et al, 2010 Fernandes et al, 2011 Santos et al, 2013 Touatti et al, 2015 Quinic acid (1) Gallic acid (2) p-hydroxyphenyllactic acid (3) p-hydroxybenzoic acid (4) Esculetin (5) Caffeic acid (6) Vanillin (7) Vanillic acid (8) p-coumaric acid (9) Ferulic acid (10) Ellagic acid (11) Salicylic acid (12) Eriodictyol (13) Naringenin (14) Protocatechuic acid (15) Protocatechuic aldehyde (16) Coniferaldehyde (17) Valoneic acid (18) Methyl gallate (19) Isorhamnetin (20) Castalagin/Vescalagin (21) Syringaldehyde (22)
Ellagic acid pentose (23)
Ellagic acid deoxyhexose (24)
Ellagic acid hexose (25)
Valoneic acid dilactone (26)
HHDP-glucose (27) Dehydrated tergallic-C-glucoside (28) HHDP-galloyl-glucose (29) Trigalloyl-glucose (30) Di-HHDP-glucose (31) HHDP-digalloyl-glucose (32) Di-HHDP-galloyl-glucose (33) Trigalloyl-HHDP-glucose (34) Pentagalloyl-glucose (35) Mongolican A/B (36) Brevifolin-carboxilic acid (37)
Caffeic acid isoprenyl ester
(38)
Ellagic acid rhamnoside (39)
Isorhamntine-rhamnoside
(40)
Figure 1.2 - Flavonoids identified as cork constituents.
AIM
This thesis aims to study subproducts resulting from the transformation of cork by SOFALCA, in an attempt to find a potential application for this kind of CKSP. The studies will focus on the samples constituents, their antioxidant properties, and on their antimicrobial properties towards several microorganisms.
Thesis outline
The thesis is organized in 5 chapters that cover the research aims previously mentioned. The introduction is presented in Chapter 1, the final remarks (alongside some future perspectives using this kind of samples) on Chapter 5 and the addressed research areas are organized as follows.
In Chapter 2, physical and chemical analysis are reported. CKSP were characterized in terms of pH, conductivity, refraction index, total solid residue, turbidity and dissolved oxygen. The phenolic and flavonoid contents were determined, and LC-MS was used to identify some of the present compounds.
In Chapter 3, the results of the antioxidant properties of cork sub-products can be found. The antioxidant properties were determined towards DPPH (mimicking RNS) and peroxyl radicals, known as endogenous ROS.
In Chapter 4, the antimicrobial properties of the samples were assessed, using several microorganisms strains, including also the ability to inhibit biofilm formation.
Chapter 2 Physical and chemical characterisation of CKSP
“All that is gold does not glitter,
Not all those who wander are lost; The old that is strong does not wither, Deep roots are not reached by the frost”
2.1 Introduction
CKSP are reported to be rich in phenolic compounds, where phenolic acids are the greater part (Santos et al., 2010). The presence of phenolic compounds like gallic acid, p-hydroxyphenyllactic acid and vanillin, amongst others, was reported in the literature (Santos et al., 2010).
Measuring pH using accurate and reliable methods in chemical, biological, clinical, industrial and environmental samples is of great importance (Ertürün et al., 2015). Based on the presence of certain compounds and their acid properties, the acidity of the medium varies and the pH of the CKSP is related to their components profile.
Another property that is related to the sample composition is the sample conductivity. The ability of a liquid sample to convey electricity is the specific conductance, also known as electrical conductivity. This ability is influenced by the presence of ionic compounds (Uwidia and Ukulu, 2013), and increases with the amount of ions in the sample.
CKSP refractive index can also be evaluated. Refractive index is a property intrinsic to all media, commonly used to evaluate the purity of the liquid since it is related with the density. It can be used either for quality control purposes, on food or cosmetic industries, or for environmental control (Räty and Peiponen, 2015).
Liquid Chromatography coupled to mass spectrometry (LC-MS) is one of the most used methodologies to identify a sample composition. LC-MS is used to identify some of the organic compounds present in natural products extracts, like CKSP (Conde et al., 1998; Fernandes et
al., 2011), allowing identification of phenolic compounds, flavonoids and tannins as the main
extractive compounds. Some phenolic compounds already reported to be cork constituents, like caffeic acid, are used in pharmaceutical, chemical and food industries (Daâssi et al., 2014).
On this part of the work, the available CKSP samples were submitted to several physical and chemical characterization assays such as evaluation of pH, conductivity, refraction index, total solids residue and dissolved oxygen content. The composition on phenolic and flavonoid compounds was also assessed using Folin & Ciocalteu and aluminium chloride methods and LC-MS/MS.
2.2 Material and reagents
The following reagents were used: aluminium chloride hydrate, Folin & Ciocalteu’s reagent, sodium carbonate and sodium thiosulphate padronized solution (1 mol L-1) purchased from Sigma Aldrich (Steinheim; Germany), manganese sulphate purchased from May and Baker chemicals (London, England); sodium azide adquired from Carlo Erba (Barcelona, Spain); conductivity sodium chloride standard solutions (1.413 mS cm-1 and 12.88 mS cm-1,) obtained from Crisom (Barcelona, Spain); pH standard solutions (pH values 4 and 7) from Metrohm (Herisou, Switzerland); sodium hydroxide and sodium nitrite obtained from V. Reis, Lda (Lisboa, Portugal); starch, methanol absolute, sulphuric acid and acetonitrile HPLC grade were obtained from Merck (Darmstad, Germany); formic acid purchased from AnalaR (Pool, England). The LC-MS standards (quinic acid, gallic acid, protocatechuic acid,
phydroxybenzoic acid, caffeic acid, vanillin, p-coumaric acid and ellagic acid) were obtained
from Extrasynthese (Genay, France).
2.2.1 Equipment
The following equipment was used: Metrohm 744 pH Meter using a Metrohm electrode (Precision ± 0.01); P Selecta Ultrasons bath; Hitachi UV 2000 spectrophotometer (Precision ± 10-3 A.U.); Wayne Kerr B905 automatic precision bridge with an Ingold conductivity cell type 980-k19/120 (platinum electrodes), (Precision ± 0.0001 mS); Bellingham + Stanley Abbe 5 refractometer (Precision ± 0.01); Heraeus drying oven; METTLER AE 200 balance (Precision ± 0.0001 g); SPECTROstar Omega micro plate absorbance reader (Precision ± 0.001), controlled by Omega software; Eutech Instruments TN-100 Turbidimeter.
2.2.2 Samples
Samples were collected from different points of cork production and for three distinct harvests.
2.3 Methods
2.3.1 pH measurement
The pH parameter is related to the concentration of [H+] in solution, where higher concentrations are numerically expressed as lower pH values, expressing the acidity of a solution. Before each set of pH measurements, electrode calibration was performed, using two standards solutions, with pH 4 and 7.
2.3.2 Conductivity
Conductance values were obtained using a Wayne-Kerr B905 automatic precision bridge (WKR, England) using an Ingold conductivity cell type 980-K19/20 with platinium electrodes and a cell constant of 1.004 cm-1, operating at 25 ºC and 1 kHz. Two Crison KCl standard solution were used to determine the cell constant. To obtain the samples conductivity,
𝑪𝒐𝒏𝒅𝒖𝒄𝒕𝒊𝒗𝒊𝒕𝒚 = 𝒄𝒐𝒏𝒅𝒖𝒄𝒕𝒂𝒏𝒄𝒆 × 𝒄𝒆𝒍𝒍′𝒔 𝒄𝒐𝒏𝒔𝒕𝒂𝒏𝒕 Equation 2.1
2.3.3 Refraction index
Refraction index (RI) stands for the path described by light in a medium and corresponds to the phase velocity of light in a medium divided by its velocity in vacuum (Räty and Peiponen, 2015). Therefore, such a parameter depends not only on the refractive index of the medium, but also on the molecular structure, the wavelength of the light, temperature and the pressure of the medium (Räty and Peiponen, 2015).
For the refraction index determination of CKSP, 3-5 drops of sample were placed on the lower prism assuring that all the surface was covered and no air bubbles were observed before both prisms were joined together. MilliQ deionized water was used as assay control. Assays were performed at 25 ºC using direct sunlight.
2.3.4 Turbidity
Turbidity is defined as the reduction of transparency of a medium (usually liquid) caused by the presence of undissolved matter (usually small particles), causing light to scatter (Lawler, 2005). This property can be evaluated by nephlometry, measuring directly the light scattering degree of the medium. It is a non-destructive method that allows the quantification of particles in a media.
Nephlometry was the selected method to evaluate turbidity of filtered and non-filtered CKSP. Before each set of measurements, a set of 4 standards (i.e. 0.02; 20; 100 and 800 NTU) were used to calibrate the equipment. Each sample was measured in triplicate and final results were presented as the mean ± SD.
2.3.5 Total dried residue
In liquid samples, the word “solid” is related to suspended or dissolved compounds, able to be physically isolated, after free water evaporation. For determination of the total dried residue (i.e. suspended and dissolved solids) the gravimetric method, according to Hach (2015), was used.
For the total dried residue (TDR), the samples were placed in a porcelain evaporating dish and were left inside a drying oven, with temperature set for 105 ºC (Figure 2.1) until the mass variation of the residue was equal or smaller than 4 mg. Before being weighed, the samples were cooled down inside a desiccator.
Figure 2.1 - Scheme of total solid residue procedure and its respective samples.
2.3.6 Dissolved Oxygen Content
Dissolved oxygen Content (DOC) was performed according to ISO standards (1983). The method is based on the reaction of dissolved oxygen with manganese (II) hydroxide.
Dissolved oxygen was achieved by the iodide equivalents, obtained by titration and subtracted of other reducing agents present in the solution.
i) Presence of oxidant/reducing agents
First, it was necessary to find if the samples presented oxidant or reducing agents. For that, two different procedures were performed:
Presence of oxidant agents
CKSP were added of 2 drops of phenolphthalein (1 g L-1 of an ethanolic solution), followed by 0.5 mL of concentrated sulphuric acid and approximately 0.5 g of iodide potassium. A few drops of starch indicator (10 g L-1) were added and. if the solution turned blue oxidizing substances were present (Solution A).
Presence of reducing agents
To the obtained solution (Solution A), 0.2 mL of iodine solution (0.005 mol L-1) were added. If the solution remained colourless, reducing agents were present.
ii) Oxygen and other reducing agents quantification
To a 50 mL sample aliquot, 1 mL of manganese sulphate 45 % (w/v) was added, followed by 1 mL of an alkali solution (sodium hydroxide 0.35 %; potassium iodide 30 %; and sodium azide 0.01 %) (w/v). The mixture was shaken and 1 mL of concentrated sulfuric acid was added. A few drops of starch (10 g L-1) were added, and titrated with a standard sodium thiosulphate solution (0.25 mol L-1).
In the presence of other reducing agents, a correction to the first titration was needed. In that way, to 50 mL of sample, 1.5 mL of concentrated sulphuric acid were added, followed by 2 mL of alkali solution, and 1 mL of manganese sulphate 45%. A few drops of starch solution were used as indicator, and it was titrated with a 4 g free chloride L-1 solution.
This second titration was used as a correction factor due to the presence of reducing substances that affect the true result obtained on the first titration. A correction was made, according to Equation 2.2 and Equation 2.3:
𝑂2( 𝑚𝑔 𝐿 ) = 𝑀𝑀 (𝑂2) × 𝑉𝑡𝑖𝑡 × 𝐶𝑡𝑖𝑡 × 𝑓1 4 × 𝑉𝑜𝑙𝑢𝑚𝑒𝑠𝑎𝑚𝑝𝑙𝑒 𝑓𝑜𝑟 1𝑠𝑡 𝑡𝑖𝑡𝑟𝑎𝑡𝑖𝑜𝑛 − 𝑀𝑀 (𝑂2) × 𝑉𝑜𝑙𝑢𝑚𝑒𝑡𝑖𝑡 2𝑛𝑑 𝑡𝑖𝑡𝑟𝑎𝑡𝑖𝑜𝑛 × 𝐶𝑡𝑖𝑡 4 × 𝑉𝑜𝑙𝑢𝑚𝑒𝑠𝑎𝑚𝑝𝑙𝑒 𝑓𝑜𝑟 2𝑛𝑑 𝑡𝑖𝑡𝑟𝑎𝑡𝑖𝑜𝑛 Equation 2.2 𝑓1 = 𝑉𝑜𝑙𝑢𝑚𝑒 𝑠𝑎𝑚𝑝𝑙𝑒 𝑓𝑜𝑟 1𝑠𝑡 𝑡𝑖𝑡𝑟𝑎𝑡𝑖𝑜𝑛 𝑉𝑜𝑙𝑢𝑚𝑒 𝑠𝑎𝑚𝑝𝑙𝑒 𝑓𝑜𝑟 1𝑠𝑡 𝑡𝑖𝑡𝑟𝑎𝑡𝑖𝑜𝑛 − (𝑉𝑜𝑙𝑢𝑚𝑒 𝑀𝑎𝑛𝑔𝑎𝑛𝑒𝑠𝑒 𝑠𝑢𝑙𝑝ℎ𝑎𝑡𝑒+ 𝑉𝑜𝑙𝑢𝑚𝑒 𝐴𝑙𝑘𝑎𝑙𝑖 𝑟𝑒𝑎𝑔𝑒𝑛𝑡) Equation 2.3
Where MM(O2) is the molar mass of oxygen; Vtit is the volume used on the titration; Ctit
is the concentration of the titrant, Volume sample for 1st titration is the volume of sample used for the
first titration (quantification), Volume sample for 2nd titration is the volume of sample used for the second
titration (correction), Volume Manganese Sulphate is the volume of manganese sulphate used for the respective titration, Volume Alkali Reagent is the volume of alkali reagent used for the respective titration.
2.3.7 Total Phenols and Flavonoids Quantification
The methods used for determination of total phenolic content (TPC) and total flavonoid content (TFC) have been described on the literature, however, when performing a large amount of samples, those can become time consuming and require high reagent needs. Therefore, in the present work, a microscale approach was adopted to quantify TPC and TFC. To assure method suitability a short method validation procedure was followed according to ISO standards
(1990; 1993).
2.3.7.1 Micro methods validation
For the validation of these two methods, some important aspects were evaluated to assure the method suitability such as linearity, working range, limit of detection (LOD), limit of quantification (LOQ), and repeatability.
2.3.7.1.1 Linearity
Linearity is a calibration characteristic, defined as the ability to induce a response that is directly proportional to the given analytical parameter (NATA, 2013). To obtain the calibration curve, a linear regression was applied to the obtained data. After obtaining the residuals standard deviation to the data using a linear (𝑦 = 𝑚𝑥 + 𝑏) and a quadratic regression (𝑦 = 𝑎𝑥2+ 𝑏𝑥 + 𝑐), the standard deviation of both the linear and the quadratic regressions, a F-test was used to assess the best model between the two previously mentioned regression, according to Equation 2.4 and Equation 2.5:
𝑫𝑺
𝟐= (𝑵 − 𝟐) × 𝒔
𝒚 𝒙 𝟐− (𝑵 − 𝟑) × 𝒔
𝒚𝟐 𝟐 Equation 2.4𝑷𝑮 =
𝑫𝑺
𝟐𝒔
𝒚𝟐𝟐 Equation 2.5Where 𝑠𝑦/𝑥2 stands for the residual variance when a linear regression is applied and 𝑠𝑦22
for the residual variance when a quadratic regression is applied, being N the number of concentration levels, which in this case, according to ISO Standards (1990), can be N=10. After obtaining the result of the test value (PG), it is compared with the tabled F value, for each specific number of degrees of freedom. If the test value is greater than the F value, it is possible to say that the linear regression does lead to a worse adjustment. On the order hand, if the test value is smaller than the F value, non-linear regression does not change the adjustment of the values in a significant way, and linear function can be accepted as the best function to describe the data on such a working interval.
Moreover the linearity assessment was also performed by evaluating the determination coefficient (R2) and by plotting the residuals against the concentration (logarithm of concentration). If a deviation lower than 15 % is observed then the results are within the
The residues were obtained according to Equation 2.6: 𝑁𝑜𝑟𝑚𝑎𝑙𝑖𝑧𝑒𝑑 𝑟𝑒𝑠𝑖𝑑𝑢𝑒 (%) = 𝐶𝑜𝑛𝑐.𝑖 𝐴𝑏𝑠.𝑖 × 𝐶𝑜𝑛𝑐.𝑛 𝐴𝑏𝑠.𝑛 × 100 Equation 2.6
Where Conc.i and Abs.i are the concentration and the absorbance of the i replicate, respectively;
Conc.n and Abs.n are the concentration and the absorbance of the point in the middle of the
calibration curve, respectively.
2.3.7.1.2 Working range
The working range is known to be the interval of a certain property, inherent to the method, where the most expected value of the analysis should be as near to the centre as possible, allowing determination through the best suited function. The working range can also be defined as the concentration range where the method can be used. The working range suitability is obtained by the homogeneity of variances.
The homogeneity of variances test, for the lower and upper range limits, using a total of 10 replicates per each, was evaluated. The variance is evaluated with an F-test. After obtaining the necessary data, the homogeneity of variances was assessed with the edges of the calibration curve. First, the mean of the replicates of each edge was calculated using Equation 2.7, and then the standard deviation was obtained according to Equation 2.8.
𝒚
̅ =
𝒊∑
𝒚
𝒊,𝒋 𝟏𝟎 𝒋=𝟏𝒏
𝒊; 𝒊 = 𝟏 𝒐𝒓 𝒊 = 𝟏𝟎
Equation 2.7𝒔
𝒊𝟐=
∑
(𝒚
𝒊,𝒋− 𝒚
̅ )
𝒊 𝟐 𝟏𝟎 𝒋=𝟏𝒏
𝒊− 𝟏
Equation 2.8After obtaining both values, where 𝑠12 stands for the standard deviation of the first standard solution and 𝑠102 for the standard deviation of the last standard solution, the test value is obtained by the division of the higher by the smaller value, i.e., using the formulas presented in
Equation 2.9 and Equation 2.10.
𝑷𝑮 =
𝒔𝟏𝟐 𝒔𝟏𝟎𝟐 if 𝒔𝟏𝟎 𝟐 is smaller than 𝒔 𝟏 𝟐 Equation 2.9𝑷𝑮 =
𝒔𝟏𝟎𝟐 𝒔𝟏𝟐 if 𝒔𝟏𝟐 is smaller than 𝒔𝟏𝟎𝟐 Equation 2.10Once the test value is calculated, it is possible to make decisions about the working range of the method. For instance, if the test value is smaller than the F tabled value, it means that the difference on variance between these two edges is not significant, and that work range
can be used. If not, adjustments on the work range should be made until the value of F tabled is greater than the test value.
2.3.7.1.3 LOD/LOQ
Two important parameters that must be determined are the Limit of Detection (LOD) and Limit of Quantification (LOQ). The first is described as the smallest amount of an analyte that can be reliably detected by a given method (J.C.G.M., 2008). The second, LOQ, is the minimum amount of analyte that can be quantified.
LOD and LOQ can both be calculated using the residual standard deviation of the linear
regression and the slope of the previous one, according to Equation 2.11 and Equation 2.12.
𝒀(𝑳𝑶𝑫) =
𝟑, 𝟑 × 𝒔
𝒚/𝒙𝒃
Equation 2.11𝒀(𝑳𝑶𝑸) =
𝟏𝟎 × 𝒔
𝒚/𝒙𝒃
Equation 2.12 2.3.7.1.4 RepeatabilityRepeatability is defined as the precision obtained from the measurements performed in repeatability conditions, i.e., same operator, same equipment, lab conditions, in a short period of time, and it can be expressed in different ways (Bettencourt, 2014). In these methods, the repeatability was assessed as the standard deviation of ten standard solutions (N=10) of gallic acid with a concentration of 2 and 10 ppm for the TPC assay and ten standard solutions of catechin with a concentration of 4 and 20 ppm for TFC assay.
2.3.2 Total Phenolic content (TPC)
TPC was obtained from Folin & Ciocalteu’s method, based on the reaction of Folin &
Ciocalteu reagent with the phenols present in the sample, allowing colour to change from strong
yellow to pale blue. The quantification was performed by measuring the samples absorbance and comparing to a calibration curve, as reported by Singleton et al. (1999) with few adjustments to the microscale approach.
For the calibration curve, a 100 ppm stock solution (II) of gallic acid (GA) was prepared from a previous stock solution (I) of GA 1000 ppm, both prepared on methanol/water [8:2] mixture. From the final stock solution (II), standard aqueous solutions with concentration ranging from 2 to 10 ppm were prepared.
From each standard solution, 262.5 µL were transferred to a 96-well microtiter plate (MTP), and 7.0 µL of Folin & Ciocalteu’s reagent was added. After 3 min, each well was supplemented with 30 µL of sodium carbonate aqueous solution (35 %). The MTP was kept under dark and at room temperature for 1 h, and the absorbance at λ= 725 nm was measured on a SPECTROstar Omega micro plate absorbance reader.
Samples were processed and diluted to fit the calibration curve (2-10 ppm of GAE), working range. Measurements were performed in triplicates, water was used as blank, and the final results were expressed as the mean ± SD of GA equivalents (ppb/GAE).
TPC was determined according to a linear function obtained from the calibration curve,
i.e., 𝑥 =𝑦−𝑏𝑚 ,
where x is the concentration of the sample, y is the absorbance value of the sample, b is the intercept value, and m is the slope.
2.3.3 Total Flavonoid Content (TFC)
TFC determination was performed according to the aluminium chloride method reported by Zhishen et al. (1999) with few adjustments. The method is based on the formation of stable aluminium-flavonoid complexes (Bag et al., 2015), resulting from the reaction of aluminium chloride with the flavonoids that originates a colour change from pale yellow to a strong pink.
Final complex absorbance at λ= 510 nm was measured and TFC was determined using a calibration curve, i.e., 𝑥 =𝑦−𝑏
𝑚 ,
where x is the concentration of the sample, y is the absorbance value of the sample, b is the intercept value, and m is the slope.
For the TFC quantification, a stock solution (SS) of catechin (C) at 1000 ppm was prepared and standard solutions, with concentration ranging 2-20 ppm, were obtained by dilution of SS. From each standard solution, 150 µL were transferred to a 96-well microtiter plate and 36 µL of an aqueous solution of sodium nitrite (5 %) (w/v) were added. After 5 min, each well was supplemented with 36 µL of an aqueous solution of aluminium chloride (2.5 %) (w/v) and, after 6 min, with 132 µL of an aqueous solution of sodium hydroxide (0.8 mol L-1). Absorbance was measured at λ= 510 nm on a SPECTROstar Omega microtiter absorbance reader.
The samples were processed to fit the calibration curve (2-20 ppm of C), quantification was performed in triplicates, water was used as blank, and the final results are reported as the mean ± SD of Catechin Equivalents (ppb/CE).
2.3.4 Characterization of samples content by LC-MS/MS
LC-MS is a combination of two distinct techniques that brought new perspectives when conceived. It coupled the liquid chromatography to the mass spectrometry, complementing other hyphenised techniques, by being able to analyse non-volatile and thermolabile compounds. Moreover, one of the most important benefits was the fact that aqueous matrix could be analysed with no previous extraction or derivatization, what led, mostly, to economic benefits (Nogueira, 2014).
The used equipment, commonly known as Tandem, consists on an High Performance Liquid Chromatography (HPLC) with a diode array detector (DAD) coupled to a MS/MS analyser, allowing to obtain some structural information, since the selected m/z can be fragmented again. In this case, electro spray ionization (ESI) was the ion source and the used mass analyser was a triple quadrupole.
For the LC-ESI-MS/MS analysis, a RP18 LiChro CART 250-4 (250 mm, 4 mm i.d.; 5 µm) column from Merck was used, in a WatersTM Alliance 2695 HPLC Separation Module
coupled to a WatersTM Micromass Quatromicro API Tandem Quadrupole Mass Spectrometer
equipped with a WatersTM electrospray ionisation source (ESI), controlled by WatersTM
Empower Software. The method was optimized for negative ESI mode with 135 min runs, and a
column temperature of 40 ºC. Mobile phase consisted of water: formic acid (95.5 %:0.5 %) (eluent A) and acetonitrile (eluent B). The following elution programme was used: isocratic for 0.1 min at 100% of eluent A; gradient for 70 min until 31.5% of eluent B; gradient for 30 min until 90% of eluent B; isocratic for 10 min with 90% of eluent B; gradient for 5 min until 100% of eluent A and isocratic for 15 min with 100% of eluent A.
Samples were kept at 4 ºC, injection volume was 20 µL and the used flow rate was 0.3 ml min-1. ESI capillary voltage was 3.00 kV, with a cone voltage set on 30 V and cone gas flow of 50 L per hour. Before being injected, samples were filtrated using a Schleider & Schuell paper filter nº595, and again using a 0.45 µm polypropylene syringe filter.
Chromatograms were obtained at λ= 254 nm and λ= 280 nm. Full mass scan MS data over the m/z range 100-1000 were obtained in order to have information about the molecular ion of each compound separated. To study the fragmentation pattern of the compounds present in samples, MS/MS experiments were performed using ionization energy of -20 keV and collision energies ranging from 0.5 to 50. Samples were also analysed using Multiple Reaction Monitoring (MRM) by comparing to a mixture of standards containing quinic, gallic, protocatechuic, p-hydroyphenyllactic, caffeic, p-coumaric and ellagic acids, and vanillin. Each compound on the standards mixture was fragmented using their specific transitions, as shown in
Table 2.1, and compared to samples.
Table 2.1 - MRM specific transition information for the used standard compounds.
Compound Information on specific transition Quinic acid 191>85 Gallic acid 169>125 Protocatechuic acid 153>109 p-hydroxyphenyllactic acid 137>93 Caffeic acid 179>135 Vanillin 151>135 p-coumaric acid 163>119 Ellagic acid 301>284
2.4. Results
2.4.1 Physical and chemical characterisation
After receiving the CKSP from SOFALCA, some physical and chemical characteristics were determined, like pH, conductivity, RI, TDR, turbidity and DOC, as a first approach to characterize those samples. All samples were analysed.
2.4.2 Validation
Neither Folin & Ciocalteu for determining TPC nor aluminium chloride method for determining TFC had been applied on the lab by a micro method approach, so validation of these two methods was necessary. Validation was then performed, according to ISO 8466-1
1990 and ISO 8466-2 1993, as mentioned in section 2.3.7.1.
2.4.2.1 TPC and TFC method validation
For the TPC method validation a working range of 2 to 10 ppm of gallic acid was chosen. The working range was first tested for 1 to 10 ppm, but the differences of the variances were significant, so the working interval had to be adjusted (i.e. 2 to 10 ppm). For the TFC the selected working ranged from 4 to 20 ppm of Catechin. Calibration curves were obtained from plotting the absorbance vs the concentration of the standards used for each method, on the working range. Linearity equations were obtained using a linear regression analysis given by
GraphPad, obtaining 𝑦 = 0.0755𝑥 − 0.0024 with a R2 of 0.9960 and y = 0.0141𝑥 − 0.0013 ,
with R2 of 0.9955 for TPC and TFC, respectively (Figure 2.2). The results for the method validation parameters for TPC and TFC are presented in Table 2.2.
Figure 2.2 - TPC and TFC obtained calibration curves and normalized residues. A – TPC calibration curve; B – TPC normalized residues; C – TFC calibration curve; D – TFC normalized residues.
A B
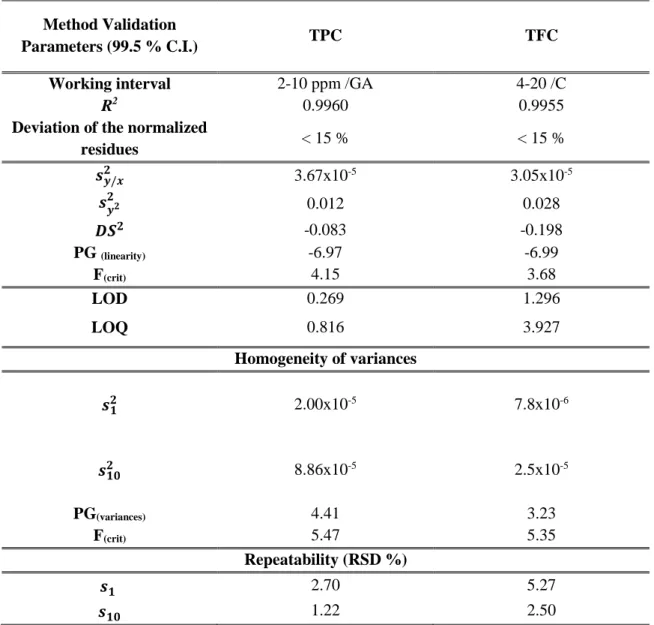
Table 2.2 - Linearity validation parameters for TPC and TFC.
Method Validation
Parameters (99.5 % C.I.) TPC TFC
Working interval 2-10 ppm /GA 4-20 /C
R2 0.9960 0.9955
Deviation of the normalized
residues < 15 % < 15 % 𝒔𝒚/𝒙𝟐 3.67x10⁻⁵ 3.05x10⁻⁵ 𝒔𝒚𝟐𝟐 0.012 0.028 𝑫𝑺𝟐 -0.083 -0.198 PG (linearity) -6.97 -6.99 F(crit) 4.15 3.68 LOD 0.269 1.296 LOQ 0.816 3.927 Homogeneity of variances 𝒔𝟏𝟐 2.00x10⁻⁵ 7.8x10⁻⁶ 𝒔𝟏𝟎𝟐 8.86x10⁻⁵ 2.5x10⁻⁵ PG(variances) 4.41 3.23 F(crit) 5.47 5.35 Repeatability (RSD %) 𝒔𝟏 2.70 5.27 𝒔𝟏𝟎 1.22 2.50
From the validation results presented in Table 2.2 it is possible to conclude that the chosen working range for TPC determination (2-10 ppm of GA) and for TFC determination (4-20 ppm of C) was suited for the linear regression model. F-test results reveal that there are not any significant differences on the variances of the lower and upper limits, on a 95 % Confidence Interval (CI), according to ISO standards (1990). LOQ for TPC and TFC were 0.816 ppm and 3.92 ppm respectively and were both inferior than the lower limit of the calibration curve, meaning that quantification is possible on the working range. As for repeatability, it was determined for 2 concentration levels of both GAE and CE, one on the lower limit and another on the upper limit, obtaining a relative standard deviation of 2.70 % and 1.22 % for TPC and 5.27 % and 2.50 % for TFC, respectively. With the reported conditions, the methods were suitable for the quantification of TPC and TFC.
2.4.3 TPC and TFC content
It is known that raw cork has extractable compounds where phenolic and flavonoids compounds are included (Gil, 2015a). These phenolic compounds have been reported to be active against microorganisms (Gil, 2015a), so determination of the sample content on those compounds is of great interest.
2.4.4 LC-MS results
As a first approach to LC-MS, a 130 min chromatography run was made. A total ion current (TIC) chromatogram was obtained revealing the peaks of possible isolated compounds. For each peak, full scan MS data over the m/z range of 100-1500 were obtained to reach information about the corresponding deprotonated molecule and further conduct MS/MS experiments.
2.5. Conclusion
CKSP samples were supplied by SOFALCA (Abrantes, Portugal), and sampling was performed in three different harvestings, allowing to study the CKSP composition on different seasons.
From the obtained physical and chemical characterization results CKSP can be a risk to the environment. Such a fact urges even more the need to find new applications for the CKSP studied through this work.
After quantification of TPC and TFC, it is possible to conclude that samples showed a high content of each family of compounds commonly present on natural products, and that might play an important role on biologic environments, due to their inflammatory, anti-bacteriological and, specially, their antioxidant activity. Since antioxidant activity can be an important and a valuable application for the compounds in these samples, it would be of great interest to study it, since these compounds can be applied on different areas.
Using LC-MS, identification of phenolic compounds was achieved, by comparing with the results obtained by other authors and using MRM with a mixture of standards. Several phenolic compounds were identified.
Chapter 3 Antioxidant activity
“If. 'If' always propelled my thoughts back to the present, because 'if' depended so much on keeping my wits about me. I couldn't properly sense things if I was distracted. 'If' demanded my full presence and participation in 'now. 'If', as much as it scared me, also kept me sane.”
3.1 Introduction
Due to the chemical composition of the cork from Quercus suber L. on phenolic and flavonoid compounds and based on the properties presented by these families of compounds that include antioxidant and radical scavenger capacity, that are not interdependent (Laranjinha and Cadenas, 1999), studies towards these kind of characterizations have been performed on the last few years (Santos et al., 2010; Santos et al., 2013; Touati et al., 2015).
Oxidative stress is a known disproportion between reactive oxygen species (ROS)/ reactive nitrogen species (RNS) and antioxidants (Biosciences), usually on physiological environment (Macdonald-Wicks et al., 2006). On normal physiological conditions, those ROS are neutralized by the antioxidant enzymes of the cell and other redox compounds that the cell might have. ROS are important to neutralize and it is not always possible to do so fast enough to avoid some cellular damage. Although there is not an official international definition of “antioxidant”, this refers to a compound that is able to prevent or delay oxidation of easily oxidisable material (Macdonald-Wicks et al., 2006).
Phenolic compounds and flavonoids are known to act as antioxidants due to their ability to stop the chain-reaction oxidations, since they have high susceptibility to react (Mann et al., 1994). This susceptibility, allied to their anti-inflammatory and antimicrobial properties (Santos
et al., 2010), makes them important to human health, as they have been gaining interest in the
nutraceutical and cosmetic markets (Laranjinha and Cadenas, 1999). Although flavonoids retain the most important structural characteristics to act as an antioxidant, some phenolic compounds, as caffeic acid, can also have such features. Specifically, an o-dihidroxy structure, responsible for the electron delocalization of the phenoxyl radical, and a side-chain conjugated with the phenolic ring on one edge and a carbonyl on the other, where both edges allow stabilization of the phenoxyl radical (Laranjinha and Cadenas, 1999) are the important structural characteristics. Flavonoids are widely found in edible and non-edible plants (Venturelli et al., 2016), and are characterized by having a 2-phenyl-4H-chromen-4-one structure. These phytochemicals are responsibles for organoleptic characteristics of the food they are found in, and the associated health benefits from their consumption (Ferreyra et al., 2012).
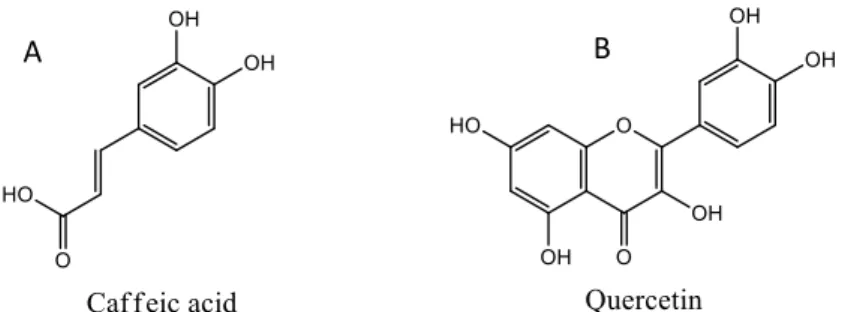
The term “phenolic” embraces a wide range of compounds, all aromatic containing hydroxyl substituents. Despite being similar to its parent compound, phenol, most are multiple substituted, being usually polyphenols. The fact that these compounds are very reactive must be taken into account when working with them, mainly due to the ability to take part of intra or inter molecular hydrogen bonds (Mann et al., 1994). Phenolic compounds can be synthetic, like butylated hydroxytoluene (BHT) or obtained from natural products, like vitamin E (α-tocopherol), gallic, protocatechuic, caffeic or rosmarinic acids, amongst others (Brewer, 2011). In addition, the fact that these compounds show reduced to absent adverse effects contributes to their growing interest (Santos et al., 2010; Custódio et al., 2015). Comparing the structures of caffeic acid with quercetin (Figure 3.1), can easily be detected the ArC3 moiety of caffeic acid in the quercetin structure, which is according the fact of caffeic acid being the precursor of flavonoids biosynthesis in plants (Laranjinha and Cadenas, 1999).
Figure 3.1 - Caffeic acid and quercetin chemical structures 2 A – Phenolic compound; B – Flavonoid.
It is known that botanical extracts have antioxidant activity, specifically, due to the presence of ellagic, gallic, caffeic and protocatechuic acids, vanillin, protocatechuic aldehyde, coniferaldehyde and sinalpehyde (Santos et al., 2010; Brewer, 2011; Custódio et al., 2015).
It becomes of great interest to evaluate antioxidant activity of some natural products, since they have a high content on known antioxidant families, like phenolic compounds or flavonoids (Santos et al., 2013). Since CKSP, evaluated on the present work show a high content on phenolic and flavonoid compounds, several assays were performed aiming to obtain antioxidant activity information towards several ROS/RNS, from different in vitro methods (Alam et al., 2013). An example is the DPPH assay that was used to test the capacity of scavenging RNS, where DPPH acts as one, being one of the few commercialized stable nitrogen radicals. The inhibition of lipid peroxidation was also evaluated using linoleic acid as the oxidizable material and AAPH as an oxidizing agent. To test the samples ability to inhibit the activity of peroxyl radical (as an oxidant), ORAC assay was used.
2 Addapted from Laranjinha and Cadenas, (1999)