THE STUDY OF DNA CONTENT AND PHENOLIC COMPOUNDS IN CULTIVARS OF OLIVE TREE
Thatiane Padilha de Menezes1, Adelson Francisco de Oliveira2, Flavia Cintia de Oliveira Castro1, Flavia Aparecida da Silveira1, Tesfahum Alemu Setotaw1,2
1Universidade Federal de Lavras, Lavras, MG- Brasil. E-mail: [email protected], [email protected],
[email protected], [email protected]
2Epamig. E-mail: [email protected]
ABSTRACT
Originate from the Mediterranean region, the olive tree (Olea europaea L.) is currently planted in various regions of the world, and Brazil is the largest consumer of the products derived from this tree. The objective of this work was to study the influence of total phenolic compound production on the DNA content of the olive cultivars collected in different months and times and evaluated through flow cytometry analysis. The experiment was conducted using(3x3x2) factorial design in split plot with three replications, where 3 months of harvesting (March, June and August), three time of collection (7h, 12h and 17h) and two cultivars (Arbequina and Ascolano 315). The total phenol production and genome size were not constant along the whole period of the experiment demonstrating the existence of relationship between among secondary metabolites produced and the precession of the flow citometry technique.
Keywords: Cultivars, flow cytometry, olive tree
ESTUDO DO CONTEÚDO DE DNA E COMPOSTOS FENÓLICOS EM CULTIVARES DE OLIVEIRA
RESUMO
Originária da região Mediterrânea, a oliveira (Olea europaea L.) é atualmente cultivada em diversas regiões do globo, sendo o Brasil um grande mercado consumidor dos produtos desta espécie de planta. Objetivou-se, neste trabalho, estudar a influência da produção de compostos fenólicos totais no conteúdo de DNA em cultivares de oliveira avaliadas por técnica de citometria de fluxo, em diferentes épocas e horários. O experimento foi conduzido em esquema fatorial (3 x 3 x 2), em parcelas subdivididas no tempo, com três repetições, sendo três meses de coleta
(março, junho e agosto), três horários de coleta (7h, 12h e 17h) e duas cultivares (Arbequina e Ascolano 315). A produção de fenóis totais e tamanho do genoma não foram constantes ao longo do período experimental, demonstrando haver uma relação entre metabólitos secundários produzidos pela planta e a precisão da técnica de citometria de fluxo.
Palavras-chave: Cultivares, citometria de fluxo, oliveira
INTRODUCTION
Initially used to count the blood cells, flow cytometry is currently an important biotechnology tool employed to study the plant cells. The application of this technology in the area of botany is related to the analysis of the DNA content either in relative term (analysis at the ploidy level) or in absolute term (estimating the genome size) (LAUREIRO et al., 2012). The developed method was based on the isolation and coloring of the plant nucleus (LAUREIRO et al., 2012).
Although the method is consolidated, the error in methodology can result in an artificial data. According to Laureiro et al. (2004), the interaction of nucleus- cytosol is the source of errors during the estimation of the plant DNA content through flow cytometry. These authors also reported the woody plants can present problems associated with the isolation of the nucleus probably due to the interference of secondary metabolites compounds. These compounds can prevent the access of the propidium iodide to the DNA and generating histograms with very high coefficient of variation. That can result misconception in quantification of the DNA.
Phenolic compounds are found among secondary ones produced by plants. These compounds are found in considerable amount in olive leaves the majority being Oleuropein and its derivative hydroxytyrosol (ERBAY & ICIER, 2010).
Taking into consideration the importance of the flow cytometry technique for the characterization of plant genome size, this work was developed with the objective of studying the influence of phenolic compound production in the precession ofthe flow cytometry to estimate the DNA content of olive cultivars at different months and time.
MATERIAL AND METHODS
Fé. To realize the analysis, new young leaves of the two varieties of olive were collected separately in three hours. The climatic conditions during the period of the experiment where recorded (Figure 1).
After collecting, the leaves were conditioned with humid cotton, packed in plastic bag, identified and transported to the Federal University of Lavras in Styrofoam box with gel. The preparation of the samples for the flow cytometry analysis was carried out in the Plant Tissue Culture laboratory of the Department of Agriculture-Universidade Federal de Lavras.
For the determination of the quantity of DNA one used approximately 30 mg of young leaves for each sample together with the standard reference, Pisum sativum (2C DNA content = 9.09 pg). With the help of scalpel the samples were grinded in Petri dish containing 1 mL of cold extraction buffer to release the nucleus (Dolezel et al., 1989). Subsequently the nucleus suspension was aspirated through Pasteur pipette and filtered using 50 µm of mesh. To coloring the nucleus the 25 µL of fluorochrome propidium iodide and 5 µL of RNase was added in each sample.
Figure 1. Mean monthly temperature and total precipitation during the period of the experiment
The nuclear DNA content (pg) of the samples was determined using the following equation:
DNAofthesample = G1 Sample
G1 standard X DNA standard Where:
G1 sample = the position of peak 1 of the sample
G1 standard = the position of G1 peak of the reference standard (Pisum sativum) DNA standard = 9.09 pg
The determination of the total phenolic compounds was performed simultaneously with the index of DNA. To do this, the leaves were dried in oven with forced air circulation for 48 hours,at 45◦C ± 5◦C and grinded using mill. Thereafter, the extracts were prepared using 50 % methanol. The method used to determine phenolic compounds was Folin-Ciocalteau according to Singleton & Rossi (1965). The spectrophotometer at 765 nm wave length was used to determine the absorbance of each extract. The results were expressed in milligram equivalent to Gallic acid per gram of dry sample (mg AGE g-1).
The experimental design was completely randomized (CR) with three replications was used using in 3 x 3 x 2 factorial combination subdivided in months (March, May, and July), three hours of collection (7:00h, 12:00h, and 17:00) and two cultivars (Arbequina and Ascolano 315). The data obtained was subjected for analysis of variance using the statistical program Sisvar (FERREIRA, 2011).
RESULTS AND DISCUSSION
The results of analysis of variance indicated the influence of the three factors (cultivars, months of collecting and hour of collection) in the characteristics studied. This demonstrates the individual and combined effect of the factors on the sensibility of the olive cultivars in relation of phenolic compound and reliability of flow cytometry.
The DNA content estimated in cultivars is distinct and recorded an average 2.93 pg for ´Arbequina´ and 2.45 pg for ´Ascolano 315´. Santos et al. (2003) estimated 3.19 pg of 2C DNA content for micropropagated olive (Olea europea spp. Maderensis). The difference in DNA
et al. (2002) the variation in DNA content between varieties can be occurred due to small expansion or deletion of the DNA sequence in the chromosome during hybridization.
The reliability of the results for the analysis of flow cytometry is related to the coefficient of variation. According to Galbraith et al. (2002), CVs less than 5% are considered satisfactory. In this study the CVs varied from 0.45% to 1.36% thus showing the reliability of our estimation. The histogram obtained in olive cultivars is presented (Figure 2).
In an average 36.69 mg GAE g-1of total phenolic compound was found in cultivar Arbequina and 37.96 mg GAE g-1 for cultivar Ascolano 315. The highest value in olive was recorded by Cavalheiro et al.(2014) 30,21±0,21 mg GAE g-1 in olive leaves of the cultivar Arbequina in Rio Grande do Sul. Possibly this difference can be related to the extraction method used. The authors also reported that the cultivars conditions and differences among cultivars can influence the concentration of phenolic compounds. It is possible to verify the differences in DNA content and concentration of total phenolic compounds in the two cultivars studied under different months and hour of collecting the materials(Table 1).
One observed that the DNA content is not constant along the study period for the two cultivars, being influenced also by hour of collection (Figure 3), except for cultivar Ascolano 315 in March and August at 12h and 17h. The concentration of total phenolic is similar in March and May at 7h and 12h collection. The variation in DNA content and concentration of total phenolic for cultivars Arbequina and Ascolano 315 during the experimental period 0.36 pg ; 21.04 mg GAE g-1 and 1.71pg ; 19.60 mg GAE g-1, respectively.
The environmental conditions can affect the production of phenolic compound in plants. It is observed in August, the concentration of phenolic compounds are higher in all the collection time (hours) studied. Probably the environmental condition can affected the production of phenols in plants. It can be noted that in this month, the initial period of flowering in olive trees and low rainfall when compared with other months of collection as verified in Figure 1. Such factors can be affected the production of secondary metabolites in plants. The secondary metabolites are produced as a mechanism of defense when the plant suffered some type of stress. This maybe related, for example, to the change in temperature, insect damage and water stress.
Figure 2. Histogram of flow cytometry of two olive cultivars collected in different hour and
months. (a) Arbequina 7h March; (b) Arbequina 12h March; (c) Arbequina 17h march; (d) Ascolano7h March; (e) Ascolano 12h March; (f) Ascolano 17h March; (g) Arbequina 7h May; (h) Arbequina 12h May, (i) Arbequina 17h May; (j) Ascolano 7h May; (k) Ascolano 12h May, (l) Ascolano 17h May; (m) Arbequina 7h August; (n) Arbequina 12h August; (o) Arbequina 17h August; (p) Ascolano 7h August; (q) Ascolano 12h August, (r) Ascolano 17h August, in Maria da Fé – MG, 2015.
Table 1. Decomposition of each month in each level of collecting hour and cultivar in Maria da
Fé-MG, Brazil, 2015.
Cultivar Hour Month ID Phenolic total
March 2.77 c 28.70 C 7h May 2.97 b 39.15 B August 3.03 a 44.34 A Arbequina March 2.79 c 28.66 B 12h May 2.94 b 25.41 B August 3.07 a 41.67 A March 2.91 b 37.81 B 17h May 2.82 c 37.98 B August 3.13 a 46.45 A March 2.87 b 31.04 B 7h May 2.53 c 29.51 B August 3.21 a 45.94 A Ascolano March 2.00 b 32.00 B 12h May 2.87 a 31.60 B August 2.02 b 49.11 A March 2.53 a 41.45 B 17h May 1.50 b 33.54 C August 2.53 a 47.49 A
The groups of mean with the same letter in column are not differ among them by Teste of Scott-Knott (p < 0.05).
Figure 3. The DNA content in cultivars of olive in different hours and season. (a) DNA content
in cultivars Arbequina and Ascolano in March; (b) DNA content in cultivars Arbequina and Ascolano in May; (c) DNA content in cultivars Arbequina and Ascolano in August in Maria da Fé – MG, Brazil, 2015.
According to Alves et al. (2015), cultivated plants with different water conditions can present qualitative and quantitative modifications in secondary metabolites.
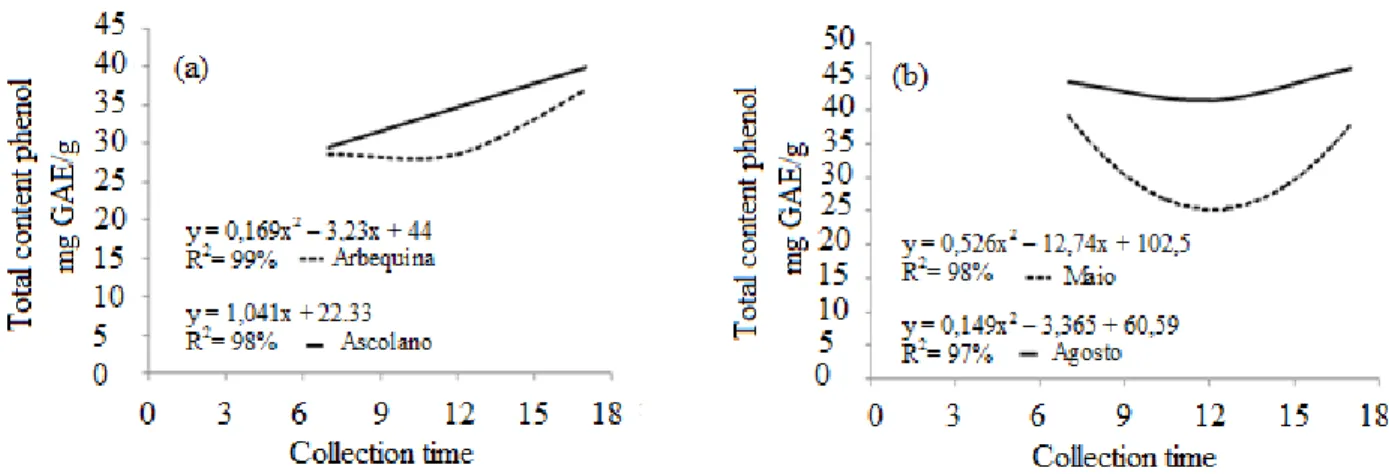
One verified that behavior of the cultivars in relation to DNA content and collection hour are distinct (Figure 4). The cultivar Ascolano 315 has quadratic behavior along the study period differently to Arbequina that presented linear behavior. For the quantification of phenolic totals, it is observed the inverse relation, where the cultivar Arbequina presented quadratic model for this character.
The variation in index of DNA can be related to the differences found in the concentration of total phenolic compounds, since this compound can suffer change in its production in function of the environment.
Noirot et al. (2000) observed that the estimated nuclear DNA content can be altered up to 20% due to the compounds present in cytosol.
It is also observed by Noirot et al. (2003) the caffeine and chlorogenic acid modified the accessibility of propidium iodide during the coloring of DNA in Petunia, the species used as standard reference. In this work also used propidium iodide during the sample preparation that can be influenced by phenolic compounds and resulting variation in DNA content that can generate errors in DNA estimation.
Besides this, these authors reported the difference in the genome size for various genotypes of coffee when evaluated different data like occurred in this study.
Figure 4. Total phenolic content in cultivars of olive in different hours and season. (a) Total
phenolic in cultivars Arbequina e Ascolano in March; (b) Total phenolic in cultivars Arbequina e Ascolano in May and August, in Maria da Fé-MG, Brazil, 2015.
Laureiro et al. (2004) reported that the influence of phenolic compounds in the accessibility of propidium iodide to the DNA is worrying since it reduces the reliability of the estimates already published.
Therefore, it is important the continuing new studies involving different fluorochromes for the estimation of genome size besides investigating secondary metabolites of the plants that can influence the efficiency of the fluorochromes used during the flow cytometry analysis. Since the existence of the possible relationship between production of secondary metabolite and the precession of flow cytometry analysis
CONCLUSION
The total phenol production and genome size were not constant along the whole period of the experiment demonstrating the existence of relationship between among secondary metabolites produced and the precession of the flow citometry technique.
The cultivars evaluated in this study presented variation in DNA content and total phenolic compounds when evaluated in different season and time of collection.
REFERENCES
ALVES, N. M.; LIMA, M. D. B.; PAULA, J. R.; SIMON, G. A. 2015. Lâminas de irrigação e sombreamento na produção de biomassa de Acariçoba (Hydrocotyle umbellata L.). Revista
brasileira de plantas medicinais,Botucatu, vol.17, n.2, pp. 210-214.
CAVALHEIRO, C. V.; ROSSO, V. D.; PAULUS, E.; CICHOSKI, A. J.; WAGNER, R.; MENEZES, C. R. DE.; BARIN, J. S. 2014. Composição química de folhas de oliveira (Olea
europaea L.) da região de Caçapava do Sul, RS. Ciência Rural, Santa Maria, vol. 44, n.10, p.
1874-1879.
FERREIRA, D. F.2011. Sisvar: a computer statistical analysis system. Ciência e
Agrotecnologia, Lavras, v. 35, n. 6, p. 1039-1042.
GALBRAITH, D. W.; LAMBERT, G. M., MACAS, J.; DOLEZEL, J.2001.Analysis of nuclear DNA content and ploidy in higher plants. Current Protocols in Cytometry, Somerset, v. 7, n. 6, p. 7-22.
LOUREIRO, J. C. M.; SANTOS, C. 2004.Aplicação da citometria de fluxo ao estudo do genoma vegetal. Boletim de Biotecnologia, São Paulo, v. 77, p. 18-29.
LOUREIRO, J.; CASTRO, M.; MONTEIRO DE OLIVEIRA, J.; ANTUNES, P.; CANHOTO, J.; CASTRO, S. 2012. Aplicações da citometria de fluxo em horticultura. Revista da
Associação Portuguesa de Horticultura, Lisboa, vol.108, p.25-28.
NOIROT, M.; BARRE, P.; DUPERRAY, C.; LOUARN, J.; HAMON, S. 2003.Effects of caffeine and chlorogenic acid on propidium iodide accessibility to DNA: Consequences on genome size evaluation in coffee tree. Annals of Botany, Oxford,vol. 92, n. 2, p.259-264. NOIROT, M.; BARRE, P.; LOUARN, J.; DUPERRAY, C.; HAMON, S. 2000.Nucleus-cytosol
interactions - A source of stoichiometric error in fl ow cytometric estimation of nuclear DNA content in plants. Annals of Botany, Oxford,vol. 86, n. 2, p. 309-316.
SANTOS, C.; BRITO, G.; PINTO, G.; FONSECA, H. 2003.In vitro plantlet regeneration of Olea
europaea ssp. maderensis. Scientia Horticulturae, Amsterdam, vol. 97, n.1, p. 83-87.
SINGLETON, V.L.; ROSSI, J.A.1965. Colorimetry of total phenolics with phosphomolybdic-phosphotungstic acid reagents. American Journal of Enology and Viticulture, Davis, v.16, p.144-158.
WILLIAMS, B. R.; MIRZOEVA, O. K.; MORGAN, W. F.; LIN, J.; DUNNICK, W.; PETRINI, J.H.2002.A murine model of Nijmegen breakage syndrome. Current Biology, London, v.12, n.8, p.648-653.