Association between molecular markers and behavioral phenotypes in the
immatures of a butterfly
Janaína De Nardin
1, Vanessa Buffon
2, Luís Fernando Revers
2and Aldo Mellender de Araújo
1 1Programa de Pós-Graduação em Genética e Biologia, Departamento de Genética, Universidade Federal
do Rio Grande do Sul, Porto Alegre, RS, Brazil.
2
Laboratório de Genética Molecular Vegetal, Centro Nacional de Pesquisa de Uva e Vinho, Empresa
Brasileira de Pesquisa Agropecuária (EMBRAPA) Uva e Vinho, Bento Gonçalves, RS, Brazil.
Abstract
Newly hatched caterpillars of the butterflyHeliconius erato phyllis routinely cannibalize eggs. In a manifestation of kin recognition they cannibalize sibling eggs less frequently than unrelated eggs. Previous work has estimated the heritability of kin recognition inH. erato phyllis to lie between 14 and 48%. It has furthermore been shown that the in-heritance of kin recognition is compatible with a quantitative model with a threshold. Here we present the results of a preliminary study, in which we tested for associations between behavioral kin recognition phenotypes and AFLP and SSR markers. We implemented two experimental approaches: (1) a cannibalism test using sibling eggs only, which allowed for only two behavioral outcomes (cannibal and non-cannibal), and (2) a cannibalism test using two sibling eggs and one unrelated egg, which allowed four outcomes [cannibal who does not recognize siblings, cannibal who recognizes siblings, “super-cannibal” (cannibal of both eggs), and “super non-cannibal” (does not cannibalize eggs at all)]. Single-marker analyses were performed usingc2tests and logistic regression with null markers as covariates.
Results of thec2tests identified 72 associations for experimental design 1 and 73 associations for design 2. Logistic
regression analysis of the markers found to be significant in thec2test resulted in 20 associations for design 1 and 11
associations for design 2. Experiment 2 identified markers that were more frequently present or absent in cannibals who recognize siblings and super non-cannibals; i.e. in both phenotypes capable of kin recognition.
Keywords: Kin discrimination, caterpillar-egg cannibalism, Lepidoptera,Heliconius, AFLP.
Received: March 15, 2017; Accepted: August 1, 2017.
Introduction
The evolution of morphological, behavioral and life history traits is underpinned by the evolution of a large number of loci (Lynch and Walsh, 1998; Ericksonet al.,
2004). Quantitative traits are under polygenic control. As a consequence, they frequently show continuous variation within and between populations (Falconer and Mackay, 1996); however, as in the case of threshold traits, their phenotypic variation does not need to be linear (Roffet al.,
1999). Evolutionary biologists have sought to examine the genetic basis of these traits. One approach relies on the use of molecular markers to identify quantitative trait loci (QTLs), i.e. genetic loci that contribute to quantitative traits (Lynch and Walsh, 1998; Ericksonet al., 2004).
Genetic mapping of QTLs has become a routine tool to study plants, animals and humans. The available meth-ods fall into two main categories that are based on related
genetic principles: linkage analysis and association studies (Olsonet al., 1999; Wuet al., 2002). Here we use a study
design that relies on association analysis. Genetic associa-tion studies are designed to identify genetic loci where allelic states are correlated with the phenotype of interest. The associations of interest are causal and identify loci whose different alleles have different effects on the pheno-type. However, even if the causal locus itself is not geno-typed it may be possible to identify it indirectly through association with genotyped loci that are located nearby in the genome (Astle and Balding, 2009). A recent advance is genome-wide association analysis, in which a large number of single locus tests are performed to examine marker loci covering the entire genome for association with the pheno-type (Bush and Moore, 2012). Each single-marker test as-sesses the segregation of a phenotype with respect to the marker genotype, indicating which markers are associated with the phenotypic trait of interest and pointing to the exis-tence of potential QTLs in the genomic neighborhood of as-sociated markers (Doerge, 2002).
DOI: http://dx.doi.org/10.1590/1678-4685-GMB-2017-0073
Send correspondence to Janaína De Nardin, Departamento de Genética, Universidade Federal do Rio Grande do Sul. Av. Bento Gonçalves, 9500, Prédio 43323, 91501-970 Porto Alegre, RS, Brazil. E-mail: [email protected].
Lepidoptera is a diverse clade that has long attracted the attention of biologists interested in ecological and evo-lutionary processes, from the classical studies of Edmund Ford (Ford, 1964, 1975) onManiola jurtinaand other
but-terflies and moths, to Kettlewell’s experiments (Kettlewell, 1955) on selection in industrial melanism, until recent stud-ies on butterflstud-ies of the genusHeliconius (Merrill et al.,
2015).
Heliconius butterflies are a well-established model
for studies of ecology, natural selection and speciation (Brown Jr, 1981; Jigginset al., 2005; Joronet al., 2011). As the most widespread species of the genus,Heliconius erato
is present in many habitats and forest types, from Mexico to northern Argentina. Of all subspecies,H. erato phyllishas the widest geographical distribution, as well as greatest en-vironmental tolerance (Ramos and Freitas, 1999).
The newly hatched caterpillars of H. erato phyllis
routinely cannibalize neighboring eggs. While the eggs of both sibling and unrelated individuals can be preyed upon, sibling eggs are cannibalized significantly less frequently than unrelated eggs (De Nardin and Araújo, 2011). This is an example of kin recognition, which can be strictly defined as the ability to identify a relationship as identical by de-scent (Hamilton, 1964a,b; Breed, 2014). In a recent study published by our group, we found a genetic component to the non-cannibalistic behavior, a characteristic associated with the recognition of relatedness (De Nardinet al., 2017).
We observed that the frequency of non-cannibalism in-creases in offspring of inbred crosses. Cannibalistic behav-ior is thought to be influenced by several genes, or QTLs, and the assumption is that the manifestation of a non-canni-balistic phenotype depends on a threshold for their joint ex-pression. Here, we present a preliminary study, in which we explored molecular marker genotyping strategies in order to search for associations between egg-cannibalism as a kin recognition behavioral phenotype, and AFLP and SSR al-leles and genotypes.
Material and Methods
Butterflies and experimental design
Heliconius erato phyllisfemales were captured from
2011 to 2014 in nine wild populations. These were distant from each other by at least 2 km until 160 km, and all of them were located in the state of Rio Grande do Sul, Brazil. Females were maintained in open air insectaries measuring approximately 3 x 2 x 2 m (length x width x height) at the Department of Genetics, Universidade Federal do Rio Grande do Sul, Porto Alegre, RS, Brazil. Females of this species are monandric, so that eggs laid by a single female are certain to be full siblings. The experimental design fol-lowed De Nardin and Araújo (2011). The females had al-ready mated in the wild. Eggs were collected daily with the aid of brushes and placed at the vertices of an equilateral tri-angle made of green paper cardboard with a side length of
0.5 cm. The triangles were kept at room temperature in Petri dishes (8 cm in diameter and 1.5 cm in height) and covered with a lightly moistened paper towel to prevent de-hydration of the eggs. Upon hatching of the first caterpillar, the presence/absence of cannibalism toward the remaining eggs was observed over a 45 minute period. We employed two experimental designs:
(1) Tests with sibling eggs only. In this case, when-ever cannibalism occurred, the caterpillar had either not recognized the sibling egg, or was hungry enough to canni-balize it anyway (evidence from previous experiments indi-cated that there was kin recognition). This behavioral phe-notype was represented as C. The absence of cannibalism likely meant that the caterpillar had recognized the egg as being that of a sibling; this phenotype was represented as NC.
(2) Tests with two sibling eggs and a non-related egg. These tests were valid for our purposes if the first egg to hatch was one of the siblings. In this case, the following phenotypes were possible: cannibalism of a sibling egg (no sibling recognition, represented as CNR), cannibalism of a non-related egg (sibling recognition; CR), cannibalism of both eggs (“super cannibal”; SC), and finally, no cannibal-ism at all (“super non-cannibal”; SNC).
Immatures hatched as part of these experiments were reared in the laboratory at a controlled temperature (25 °C) and were fed daily with Passiflora suberosa until they reached the adult stage. Adults hatched in experiment 1 were subjected to either outbred or inbred crosses, as de-scribed in the following. Outbred crosses: FNC x MC (four repeats), FC x M NC (four repeats), FC x MC (two repeats), and FNC x MNC (two repeats). Inbred crosses: FC x M C (two repeats), FNC x MNC (three repeats) and FNC x MC (one repeat). Adults hatched in experiment 2 were sub-jected to outbred crosses, as follows: FCR x MCNR (one repeat), FCNR x MNCS (two repeats), and FCS x MCS (one repeat). Finally, the egg-cannibalism experiments were repeated with the eggs from these crosses. Eggs of cat-erpillars hatched as part of experiment 1 were subjected to experimental design 1, eggs of caterpillars hatched as part of experiment 2 were subjected to experimental design 2.
Molecular markers
Total DNA for genotyping was extracted from adult individuals following the protocol described by Mega and Revers (2011) and diluted to a concentration of 50 ng/mL
for use in AFLP and SSR assays.
AFLPs markers were obtained from the AFLP Plant Mapping Protocol (Applied Biosystems, P/N 4303146F). Adapter ligation and pre-selective amplification were per-formed using the AFLP® Ligation and Preselective Ampli-fication Module for Small Genomes (Applied Biosystems, Foster City, CA, USA) andEcoRI andMseI restriction
Bio-systems), using 12 primer pair combinations:Eco
RI-TA-JOE (green fluorescence)/MseI-CAA, Eco
RI-TA-JOE/MseI-CAC, EcoRI-TA-JOE/MseI-CTG, Eco
RI-TA-JOE/MseI-CTT, EcoRI-TG-FAM (blue
fluores-cence)/MseI-CAA, EcoRI-TG-FAM/MSeI-CAC, Eco
RI-TG-FAM/MseI-CTG, EcoRI-TG-FAM/MseI-CTT, EcoRI-TT-NED (yellow fluorescence)/MseI-CAA, EcoRI-TT-NED/MSeI-CAC, EcoRI-TT-NED/MseI-CTG, EcoRI-TT-NED/MseI-CTT. PCR amplifications were
done in a total volume of 10mL containing 1.5mL of DNA
from the pre-selective amplification step, 0.5mL ofMseI 5
un primer, 0.5mLEcoRI 1 un primer, 1mL of 10x buffer,
0.3mL of MgCl250 mM, 0.1mL of dNTP 10 mM, 0.05 of mL Platinum Taq DNA polymerase (Invitrogen/Thermo
Fisher Scientific, Inc.) (5u/mL), and 6.05mL of water.
Cy-cling conditions followed the instructions in the AFLP Plant Mapping Protocol.
The samples obtained with theMseI-CAA andMse I-CAC extensions were analyzed on an ABI PRISM 310 Ge-netic Analyzer (Applied Biosystems) at the Laboratory of Plant Molecular Genetics (Embrapa Uva e Vinho, Bento Gonçalves, RS, Brazil) using 12mL of formamide, 0.3mL
of GeneScan Rox-500 and 1mL of undiluted PCR product.
Samples withMseI-CTG andMseI-CTT extensions were
analyzed on an ABI3730 Genetic Analyzer at the Human Genome and Stem Cell Research Center (Universidade de São Paulo, São Paulo, SP, Brazil) using 8.925mL of
forma-mide, 0.3mL of GeneScan Rox-500 and 1mL of undiluted
PCR product. A signal-detection threshold of 100 RFU was applied, and markers between 50 and 500 bp were selected for analysis. GeneMapper v.5 was used to generate a pres-ence/absence (1/0) matrix for each of the markers. Table 1 shows the total number of markers obtained from each combination of primers.
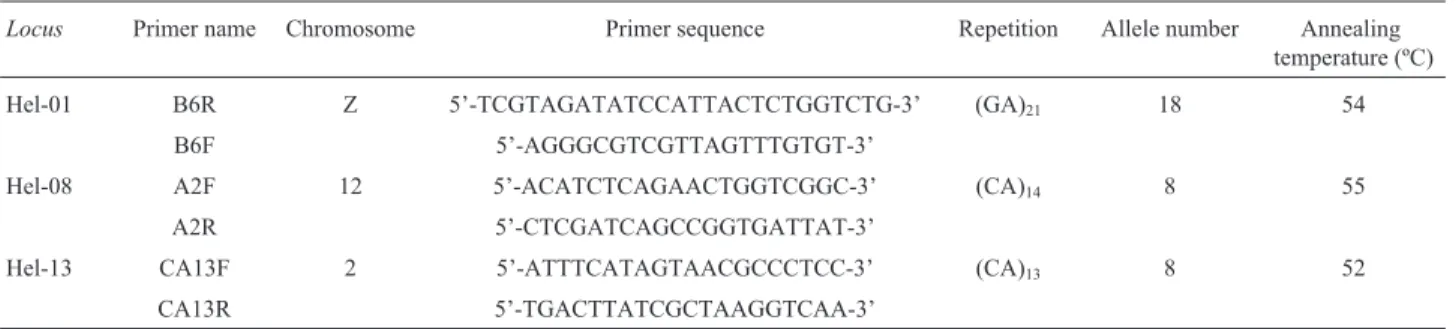
We analyzed three microsatellite loci: Hel-01, Hel-08 and Hel-13 (Flanaganet al., 2002), all labeled with FAM (blue fluorescence). Microsatellites, or SSR markers, are co-dominant and highly polymorphic (Hall et al., 2010), though more laborious to obtain than AFLPs (Ericksonet al., 2004). Details of the primers used are shown in Table 2. PCR amplification was performed in a total volume of 10 mL containing 1 mL of DNA (50 ng/mL), 0.3 mL of
MgCl250 mM, 0.1mL of dNTP 10mM, 1mL of buffer 10x,
0.1mL of primer forward+reverse (10mM), 0.05mL of
Plat-inumTaqDNA polymerase (5u/mL) and 7.45mL of water.
PCR products were analyzed on an ABI3730 Genetic Ana-lyzer at Macrogen Inc (Seoul, South Korea). Results were analyzed using GeneMapper 5. A presence/absence matrix, similar to that obtained for the AFLPs, was created for each allele. In addition, since microsatellites are co-dominant, a genotype table was also generated for each locus.
Statistical analysis
To identify AFLP and SSR markers associated with the phenotypes under consideration, we performed a chi-square (c2) single marker association test on the
pres-ence/absence matrix for each AFLP and SSR marker, using Microsoft Excel 2007 and PASW Statistics for Windows, version 18.0 (SPSS Inc., Chicago, USA). Yates’ correction was applied to the chi-square tests on the 2x2 contingency tables for AFLP markers and the cannibalism/non-canni-balism phenotype (experimental design 1). Markers found to be statistically associated with the phenotypes were sub-jected to a logistic regression analysis with three “null” markers as covariates. Null markers are not in linkage dis-equilibrium with the gene being tested for association (Se-takiset al., 2006) and are, thus, assumed to have a neutral
effect on the phenotype of interest (Abdurakhmonov and Abdukarimov, 2008). They were included in the regression analysis to reduce the effect of population structure (Bald-ing, 2006). Logistic regression was also performed using PASW Statistics for Windows, version 18.0.
In addition, a genotype association test was per-formed for all microsatellite markers, again through the
ap-Table 1- Polymorphic markers obtained with theEcoRI andMseI primers
used in this study.
ExtensionEcoRI ExtensionMseI Total
CAA CAC CTG CTT
TA 372 346 440 319 1477
TT 86 55 193 138 472
TG 242 65 406 352 1065
Total 700 466 1039 809 3014
Table 2- Microsatellite primers and PCR amplification conditions used in this work.
Locus Primer name Chromosome Primer sequence Repetition Allele number Annealing temperature (ºC)
Hel-01 B6R Z 5’-TCGTAGATATCCATTACTCTGGTCTG-3’ (GA)21 18 54
B6F 5’-AGGGCGTCGTTAGTTTGTGT-3’
Hel-08 A2F 12 5’-ACATCTCAGAACTGGTCGGC-3’ (CA)14 8 55
A2R 5’-CTCGATCAGCCGGTGATTAT-3’
Hel-13 CA13F 2 5’-ATTTCATAGTAACGCCCTCC-3’ (CA)13 8 52
plication of a c2 test. Finally, a furtherc2 test was
con-ducted on the full spectrum of alleles at each microsatellite locus. This analysis is different from the analysis of indi-vidual alleles described above, as it considers all alleles at a locus together.
Results
General information about butterfly families geno-typed as part of this work is shown in Tables 3 and 4. The Yates-correctedc2test identified associations between 72
of 3014 AFLP markers and the
cannibalism/non-canni-balism phenotype from experimental design 1 (see Table S1 for details on these markers). For 20 markers, the associ-ation remained statistically significant after logistic regres-sion (Table 5).
In the single-marker test of the phenotypes of experi-mental design 2 (cannibal that recognizes siblings, CR; cannibal that does not recognize siblings, CNR; “super can-nibal”, SC; and “super non-cancan-nibal”, SNC), a statistically significant association was found for 73 AFLPs (see Table S2 for details on these markers). For 11 markers, the associ-ation remained statistically significant after logistic regres-sion (Table 6).
Table 3- Genotyped families, for experiment 1 (two behavioral phenotypes: cannibals (C) and non-cannibals (NC)). The table shows the identification of
each family, the behavior displayed by parents, the inbreeding coefficient of the offspring (F), the absolute frequency of the behavior observed by the off-spring, the total number of offspring that was generated, the number of genotyped offsping, and the sex if genotyped parents.
Family Parent’s Behavior F Offspring’s Behavior Total number of
offspring
Number of genotyped offspring
Sex of genotyped parents
Mother Father C NC
1 C C 0.25 2 13 15 2 M
2 NC NC 0.25 6 2 8 2 M
3 NC C 0 17 12 29 7 M
4 C NC* 0 5 4 9 6 F, M*
5 NC C 0 16 3 19 8 F, M
6 C C 0 6 4 10 8 F
7 C NC* 0 12 2 14 10 F, M*
8 C C 0.25 2 12 14 12 M
9 NC C 0.25 6 14 20 10 M
10 C NC 0 20 18 38 9 F, M
11 NC C 0 13 21 34 10 F, M
12 C C 0 4 2 6 5 M
13 NC NC 0.25 4 14 18 8 F
14 NC C 0 7 6 13 7
-15 NC NC 0.25 4 10 14 4 F
16 C NC 0 17 14 31 6
-17 NC NC 0 13 9 22 6
-TOTAL 154 160 314 120 18
*Single individual. M = Male; F = Female.
Table 4- Genotyped families, from experimental design 2 (separation of four behavioral phenotypes: cannibal recognizing siblings (CR), cannibal that
does not recognize siblings (CNR), super cannibal (SC) and super non-cannibal (SNC)). Abbreviations are the same as in Table 3.
Family Parent’s behavior F Offsprig’s behavior Total number of
offspring
Number of genotyped offspring
Sex of genotyped parents
Mother Father CR CNR SC SNC
1 CR CNR 0 7 6 7 3 23 16 M
2 CNR SNC* 0 8 5 1 5 19 9 F, M*
3 CNR SNC* 0 15 4 3 15 37 24 F, M*
4 SC SC 0 2 4 2 3 11 7 F, M
Total 32 19 13 26 90 56 6
The results of association analyses between the mi-crosatellite markers (Hel-01, Hel-08 and Hel-13) and the phenotypes of experimental design 1 (C and NC) are shown in Table 7. For Hel-13, a significant association was found in the test considering all alleles together (P= 0.004; 7 df). Alleles 229 bp, 241 bp and 255 bp were more common in non-cannibals, and alleles 233 bp, 235 bp and 237 bp were more common in cannibals. ThePvalue for Hel-08 was
near significance (P= 0.051; 7 df). Allele 283 bp was more
common in non-cannibals, and allele 296 bp was more common in cannibals. Genotype association analysis iden-tified an association with the Hel-08 locus (P = 0.017;
18 df). Genotypes 273pb / 273pb and 273pb / 279pb were more common in cannibals, and genotypes 281pb / 283pb and 273pb / 283pb were more common in non-cannibals.
The analysis of the microsatellite markers and the phenotypes of experimental design 2 (CR, CNR, SC, and SNC) identified a single significant association based on the presence or absence of each individual allele, for the 403 bp allele at the Hel-01 locus (P= 0.027 in thec2test).
However, statistical significance was not maintained after logistic regression (P= 0.106). No associations were found
for these phenotypes in the joint analysis of all alleles and in the genotypic analyses.
After logistic regression, none of the markers showed a significant association with the phenotypes of both exper-imental designs. However, based on thec2test, five
mark-ers (AFLPs 78, 146, 315, 1484 and 1563) were found to be associated with the phenotypes tested in both experimental designs. Details of these markers can be found in Tables S1 and S2.
Discussion
Our preliminary study identified a number of associa-tions between molecular markers and phenotypes for both experimental designs employed here. For experimental de-sign 1, which distinguished between cannibal and non-cannibal phenotypes, associations with the non-non-cannibal phenotype were found for AFLPs 206, 1098, and 1120, and for the SSRs Hel-08 and Hel-13, as well as for the cannibal phenotype (49, 447, 1127, 1295). For experimental design 2, which distinguished between four behavioral phenotypes (cannibal that recognizes siblings, cannibal that does not recognize siblings, super cannibal and super non-cannibal),
Table 5- AFLP markers that showed significantPvalues inc2tests and logistic regression between the presence (1) and absence of allele (0) and the
can-nibal and non-cancan-nibal phenotypes. The extensions used (toEcoRI andMseI) to obtain the fragment, and also the fragment size (bp) are also indicated. In columns “Non-cannibal” and “Cannibal” are shown the absolute frequencies observed for the presence and absence of the band for each behavioral phe-notype. The Mendelian segregation of markers was tested when possible, and are represented in bold in column Marker.
Marker Extensions bp Non-cannibal Cannibal c2Yates Pc2 PLogistic Regression
EcoRI- MseI- 0 1 0 1
49 TG CTG 90 50 15 35 27 5.119 0.024a 0.048
55 TG CTG 96 57 8 62 0 6.192 0.013b 0.008
97 TG CTG 130 58 7 62 0 5.150 0.023b 0.027
206 TG CTG 219 31 34 49 13 12.059 0.001b 0.003
275 TG CTG 280 65 0 56 6 4.627 0.031a 0.034
276 TG CTG 281 62 3 49 13 6.292 0.012a 0.040
447 TA CTG 83 56 9 42 21 5.728 0.017a 0.026
531 TA CTG 156 57 8 63 0 6.304 0.012b 0.016
983 TT CTG 205 47 10 51 1 5.693 0.017b 0.050
1092 TG CTT 100 54 11 62 1 7.143 0.008b 0.040
1098 TG CTT 103 27 38 42 21 7.150 0.007b 0.029
1120 TG CTT 124 15 50 32 31 9.418 0.002b 0.026
1127 TG CTT 130 59 6 43 20 8.677 0.003a 0.008
1295 TG CTT 267 56 9 36 27 11.923 0.001a 0.000
1306 TG CTT 277 64 1 53 10 6.643 0.010a 0.020
1358 TG CTT 344 65 0 56 7 5.642 0.018a 0.017
1484 TA CTT 127 61 4 49 14 5.570 0.018a 0.031
1563 TA CTT 205 64 1 49 14 11.306 0.001a 0.000
2018 TA CAA 196 68 0 64 6 4.207 0.040a 0.033
2314 TG CAA 232 65 3 57 13 5.436 0.020a 0.032
apresence of marker most common in cannibals.
a number of observations were made. Certain markers, such as AFLP 473, were more common in super non-cannibals (SNC); others, including AFLP 2151, were more common in cannibals that recognize siblings and in super non-cannibals, both being phenotypes related to kin recog-nition. On the other hand, there were markers, such as AFLPs 1122 and 2168, that were absent in these pheno-types.
The striking frequency of “kin recognition” behav-ioral phenotypes observed in the offspring of family 3, which was obtained as part of experiment 2 (Table 4), is particularly noteworthy. The family produced a total of 37 offspring. Of these, 40.5% cannibalized unrelated eggs only, 40.5% did not cannibalize any eggs, 11% were canni-bals that did not recognize siblings, and 8% were super-cannibals. These figures mean that 81% of the offspring from this family showed kin recognition behavior. This high prevalence of kin recognition within a family is in ac-cordance with our previous report, in which we presented
evidence for the heritability of kin recognition (De Nardin
et al., 2017). Another possibility, which cannot be entirely
discarded, is that this unusual spectrum of phenotypes is due to the effect of genes associated with cannibalism itself, rather than kin recognition.
Hamilton (1964a,b) showed how altruism could evolve if ‘genes for altruism’ had the effect of increasing the fitness of relatives, even in the case of costs to the altru-ist. Thompsonet al.(2013) formulated a set of testable
hy-potheses describing the evolution, expression and features expected for such genes for altruism. Genes underlying al-truism: (i) should satisfy Hamilton’s Rulerb > c, whereris
the genetic relationship between the altruist and recipient,b
is the benefit for the recipient, andcthe cost to the altruist;
(ii) should be environmentally sensitive; (iii) should in-crease in number and complexity with increasing social-behavioral organization; (iv) should coevolve with or de-pend on the previous evolution of genes for kin recognition; (v) may reside in regions of low recombination, to show
Table 6- AFLP markers that showed significantPvalues inc2tests and logistic regression, for association between the presence (1) and absence (0) of
al-lele and phenotypes “cannibals which recognize siblings” (CR), “cannibals which does not recognize siblings” (CNR), “super cannibal” (SC) and “super non-cannibal” (SNC). The extensions used are indicated (EcoRI andMseI) to obtain fragment, and also the fragment size (bp). In columns “CR”, “CNR”, “SC” and “SNC” the absolute frequencies are shown for the presence/absence of the band for each behavioral phenotype. The Mendelian segregation of markers was tested when possible, and is represented in bold in column Marker.
Marker Extensions bp CR CNR SC SNC c2 Pc2 PLogistic Regression
EcoRI- MseI- 0 1 0 1 0 1 0 1
473 TA CTG 104 14 5 10 5 8 3 3 14 14.5 0.002d 0.025
942 TT CTG 148 17 2 7 8 6 5 16 1 14.0 0.003b, c 0.035
1122 TG CTT 125 19 0 9 6 10 1 17 0 17.0 0.001b, c 0.020
1171 TG CTT 165 14 0 13 2 11 0 7 10 14.1 0.003d 0.024
1185 TG CTT 176 19 5 13 2 11 0 8 9 21.1 < 0.001d 0.002
1466 TA CTT 114 5 14 5 10 10 1 8 9 13.0 0.005a, b, d 0.040
2133 TA CAA 82 11 8 9 6 11 0 17 0 15.0 0.002a, b 0.009
2151 TA CAA 96 2 17 10 5 3 8 2 15 16.4 0.001a, d 0.021
2168 TA CAA 108 19 0 11 4 8 3 17 0 10.9 0.012b, c 0.026
2215 TA CAA 146 11 8 8 7 7 4 17 0 10.7 0.014a, b, c 0.040
2493 TT CAA 78 13 6 8 7 7 4 2 15 13.3 0.004d 0.031
apresence of marker most common in CR .
bpresence of marker most common in CNR.
cpresence of marker most common in SC.
dpresence of marker most common in SNC.
Table 7- Microsatellite markers that resulted in a statistically significant association between the presence/absence of the mark and behavioral
pheno-type. The name of the locus, allele size (bp), the absolute frequencies of presence/absence of alleles for each behavioral phenotype, the value ofc2with
Yates correction, the correspondingPvalue, and the value ofPresulting logistic regression are all shown.
Locus bp Non-cannibal Cannibal c2Yates Pc2 PLogistic regression
0 1 0 1
Hel-08 283 31 34 48 19 6.91 0.009 0.034
Hel-13 229 45 21 27 38 8.34 0.002 0.014
co-expression and modular genetic architecture; (vi) should be at least partially additive, and (vi) should exhibit strong pleiotropy. From our own experience in the field and labo-ratory (De Nardin J, 2012, MSc thesis, Universidade Fed-eral do Rio Grande do Sul, Porto Alegre, RS, Brazil; De Nardin and Araújo, submitted), the avoidance of sibling egg-cannibalism by caterpillars ofH. erato phyllisis
com-patible with Hamilton’s rule. We furthermore observed, both in the field and experimentally, an environmental de-pendency of cannibalistic behavior (Huff, De Nardin and Araújo,unpublished results). If there are genes for
canni-balism, condition (ii) above could be fulfilled.
Association analyses have been used as a tool for the identification of population-wide polymorphisms associ-ated with particular phenotypes (Parker TB, 2007, Doctoral thesis. Oregon State University, USA). These associations arise due to the joint transmission of phenotypes and geno-types over many generations. Association analysis does not model these transmissions directly, although linkage analy-sis does. Relationships between individuals are central to linkage analysis; in association analysis, these relationships are usually distant or unknown, and where present, close re-lationships are a complicating factor (Astle and Balding, 2009). Population structure, or stratification, can lead to spurious associations (association without linkage) be-tween a candidate marker and the phenotype. Several meth-ods have been developed to reduce such spurious associa-tions (Pritchardet al., 2000; Wanget al., 2005; Yuet al., 2005; Zhuet al., 2008; Zhanget al., 2009; Thorntonet al., 2014). Here, this was achieved by using null markers as covariates in the logistic regression analysis (Wanget al., 2005; Setakiset al., 2006).
Because our analyses included families, genetic structure was an issue. However, our experiments could not reasonably have been performed in a random population sample. The kin recognition phenotypes studied here (can-nibal/non-cannibal) could not have been determined other than through a laboratory-based behavioral test. Therefore, we have chosen to perform various kinds of crosses be-tween parents with different behavioral phenotypes, and from different populations. We have included inbred crosses in our approach, which we know occur in nature (Di Mare and Araújo, 1986). Moreover, all behavioral pheno-types, both from experiment 1 and experiment 2, were pres-ent in the offspring of all families. That is, the subgroups are phenotypically similar in terms of the characteristics here analyzed, despite possible genetic differentiation. Fur-thermore, we corrected spurious associations by logistic re-gression using neutral, unlinked markers, a common practice in genetic association studies. Of the 72 associa-tions initially identified by thec2test in experiment 1, only
20 remained statistically significant after logistic regres-sion with null markers. Of the 73 associations initially found in experiment 2, 11 remained significant. Setakiset al. (2006) conducted a simulation study to compare the
merits of different methods that use null (unlinked) markers, to protect against critical substructures in genetic association studies. One of the most important findings from their study was that simple statistical procedures, based on logistic regression, performed well in all scenarios considered. Methods based on logistic regression do not re-quire an estimate of the number of underlying subpopulations; in fact, they dispense entirely with the no-tion of subpopulano-tion. One possible explanano-tion for their effectiveness is that each null marker included in the re-gression absorbs part of the effect of population stratifica-tion, but because this effect is shared across many markers, none of the markers is individually significant. Wanget al.
(2005) showed that it is possible to control for population structure within a logistic regression model by including the genotype of a single marker that is informative about ancestry among the covariates.
To detect a QTL using single-marker tests is a simple procedure that can be performed with any statistical analy-sis software, and which has the potential to identify a signif-icant number of markers (Doerge, 2002). However, some issues need to be considered in the statistical analysis of the results. The first is sample size. A large sample size pro-vides more opportunities for the observation of recombina-tion events, allowing to estimate parameters with high accuracy and, therefore, results in a greater ability to detect QTLs (Doerge, 2002). The size of the sample used here was not large. This was in particular the case for experiment 2, which may explain the lower number of associations found for that design. Another statistical problem associated with the use of small sample sizes is that they exaggerate the ef-fect of a QTL on the phenotype in what is called the Beavis effect (Beavis, 1994; Ericksonet al., 2004). Furthermore,
single-marker analysis can only detect QTLs with a rela-tively large influence on the trait of interest. The current study design is likely to have a relatively modest power to identify QTLs. A further problem is introduced by the in-vestigation of many markers using independent statistical tests, or multiple testing. This problem is related to the level of statistical significance which is established by the inves-tigator and can lead to the detection of false positives. Typically, researchers tolerate the incorrect detection of a QTL in 5% of the cases (Doerge, 2002). Associations that appear purely by chance are called “false positives”, or type I errors. Type I errors can be minimized by establishing more stringent criteria for statistical significance, e.g. by applying a Bonferroni correction. However, as type I errors diminish, QTLs with small effect sizes are increasingly un-likely to be detected, thus increasing the probability of type II errors, or false negatives (Grisel, 2000).
sepa-rately (Doerge, 2002). The work presented here thus only represents a preliminary search for possible associations between genotype and phenotype. It does not aim at the ex-act mapping of QTLs, and to do so would require a single segregating population originating from a cross between individuals of contrasting phenotypes, and a fairly large number of offspring of at least 50 to 250 individuals would be needed to allow preliminary mapping (Collard et al.,
2005), which was not possible here.
The ability to detect a QTL depends on the magnitude of its effect on the trait of interest, the size of the segregat-ing population evaluated, the frequency of recombination between the marker and the QTL, as well as the heritability of the trait. The larger the effect size and the size of the pop-ulation, the greater the heritability, and the smaller the dis-tance between the QTL and the marker, the easier it be-comes to detect the QTL (Ferreira and Gratapaglia, 1995). We have previously estimated the heritability of the non-cannibalism phenotype to lie around 20% (De Nardinet al.,
2017); this relatively low value makes it difficult to detect the underlying QTLs.
QTLs affecting various quantitative characteristics, such as life span, starvation, reproductive success, number of sensory bristles, sex comb teeth and ovarioles, flight ve-locity and metabolic traits, courtship song, locomotor be-havior and male mating and aggressive bebe-havior have been mapped in Drosophila melanogaster (reviewed by
Ed-wards and Mackay, 2009). Studies in honeybees (Apis
mellifera)have identified QTLs that influence the
expres-sion of foraging and defensive behavior in colonies, spe-cific individual behavior, the tendency of individuals perform guard and stinging behavior (reviewed by Arecha-valeta-Velascoet al., 2003), as well as hygienic behavior
(Lapidge et al., 2002). Caillaud and Via (2012) studied
QTLs related to feeding behavior in the pea aphid
Acyr-thosiphon pisum. It should be emphasized that all of these
studies deal with traits that can be measured on a continu-ous scale, while the phenotypes studied here, although they are also quantitative traits, are observed in a nonlinear way.
Linkage maps are available for Heliconius melpo-mene(Jigginset al., 2005) andHeliconius erato(Tobleret al., 2005; Kapanet al., 2006). This has enabled the
estima-tion of the sizes of these species’ genomes. Both comprise 21 chromosomes, with a total of 1616 cM or 292 Mb forH.
melpomene(Jigginset al., 2005) and 2400 cM or 395 Mb
for H. erato(Tobler et al., 2005). These maps were
ob-tained by crossing individuals with contrasting phenotypes for a trait of interest (either within or even between spe-cies), and analyzing a large number of offspring (> 70 indi-viduals) from each cross. We could not implement this approach for several reasons: (i) our phenotyping strategy depended on testing for cannibalism, which used three eggs at a time, meaning that not all offspring generated by a fe-male butterfly reached adulthood; (ii) numerous tests had to be cancelled, either because cannibalism could not be
de-tected unambiguously (due to bite marks on an egg not be-ing clearly visible), because the stipulated test duration was exceeded, or because the eggs dried up during the test; (iii) many females died prematurely; (iv) many females laid only few eggs. It is important to note that all linkage maps are unique products of the population (derived from two specific parents) and the types of markers used (Collardet al., 2005). Therefore, even if we had performed many
crosses between individuals of different populations, we would not be able to tell with certainty that all associations found here would be observed in other individuals from other populations.
We are aware of the potential problems inherent in our methodology, as well as of the limitations of this kind of preliminary study. Specifically, QTL analysis by a single marker does not allow to establish the location of a particu-lar locus, thus preventing a linkage map. Nevertheless, our data indicate the likely presence of associations between AFLP and SSR markers and the behavioral phenotypes studied. We tested around 3,000 markers, an average of 7.6 markers per Mb. The sampling of genetic variability how-ever was sufficiently broad to ensure the reliability of the data and conclusions. Nevertheless, additional studies will be necessary to validate the associations found here, and to construct a linkage map of the markers used here, with the ultimate aim of identifying and mapping the main genetic factors involved in the control of the assessed phenotypes and measuring the magnitude of their effect. Likewise, a larger number of markers will have to be tested in regions harboring association signals to define more accurately the location of the loci of interest.
Acknowledgments
We would like to thank our colleagues Ana Carolina Aymone, Ana Carolina da Silva, André Klein, Bruna Missaggia, Etiele Silveira, Luciana da Silva, Marcelo Cos-ta, Natasha Nonemacher Magni, Pietro Pollo, Rosana Huff, and Thiana Arisi for their help in caring for the butterflies and immature individuals. We also thank Estação Experi-mental Agronômica de Águas Belas (FEPAGRO, Rio Grande do Sul) and the Laboratory of Plant Molecular Ge-netics (Embrapa Uva e Vinho, Bento Gonçalves). Further-more, we would like to thank the Conselho Nacional de Desenvolvimento Científico e Tecnológico (CNPq) for fi-nancial support and a PhD grant to Janaína De Nardin (141920/2012-2). Finally, we thank the Coordenação de Aperfeiçoamento de Pessoal de Nível Superior (CAPES), and the Postgraduate Program in Genetics and Molecular Biology (PPGBM) at UFRGS for providing financial aid and supporting this work.
References
of plant germplasm resources. Int J Plant Genomics 2008:574927.
Arechavaleta-Velasco ME, Hunt GJ and Emore C (2003) Quanti-tative traitlocithat influence the expression of guarding and
stinging behaviors of individual honey bees. Behav Genet 33:357-363.
Astle W and Balding DJ (2009) Population structure and cryptic relatedness in genetic association studies. Stat Sci 24:451-471.
Balding DJ (2006) A tutorial on statistical methods for population association studies. Nat Rev Genet 7:781-791.
Beavis WD (1994) The power and deceit of QTL experiments: Lessons from comparative QTL studies. In: Wilkinson DB (ed) Proceedings of the Forty-Ninth Annual Corn and Sor-ghum Industry Research Conference. American Seed Trade Association, Chicago, pp 250-266.
Breed MD (2014) Kin and nestmate recognition: The influence of W. D. Hamilton on 50 years of research. Anim Behav 92:271-279.
Brown Jr KS (1981) The biology ofHeliconiusand related
gen-era. Annu Rev Entomol 26:427-456.
Bush WS and Moore JH (2012) Chapter 11: Genome-wide associ-ation studies. PLoS Comp Biol 8:e1002822.
Caillaud MC and Via S (2012) Quantitative genetics of feeding behavior in two ecological races of the pea aphid, Acyr-thosiphon pisum. Heredity 108:211-218.
Collard BCY, Jahufer MZZ, Brouwer JB and Pang ECK (2005) An introduction to markers, quantitative trait loci (QTL) mapping and marker-assisted selection for crop improve-ment: The basic concepts. Euphytica 142:169-196. De Nardin J and Araújo AM (2011) Kin recognition in immatures
ofHeliconius erato phyllis(Lepidoptera; Nymphalidae). J
Ethol 29:499-503.
De Nardin J, Da Silva L and Araújo AM (2017) Kin recognition in a butterfly: inferences about its heritability. Ethol Ecol Evol 29:255-265.
Di Mare RA and Araújo AM (1986) A first survey of inbreeding effects inHeliconius erato phyllis(Lepidoptera;
Nympha-lidae). Rev Bras Genet 9:11-20.
Doerge RJ (2002) Mapping and analysis of quantitative traitloci
in experimental populations. Nat Rev Genet 3:43-52. Edwards AC and Mackay TFC (2009) Quantitative traitlocifor
aggressive behavior inDrosophila melanogaster. Genetics 182:889-897.
Erickson DL, Fenster CB, StenØien HK and Price D (2004) Quan-titative traitlocus analyses and the study of evolutionary process. Mol Ecol 13:2505-2522.
Falconer DS and Mackay TFC (1996) Introduction to Quantita-tive Genetics. 4th edition. Addison-Wesley Longman, Harlow, 480 p.
Ferreira ME and Gratapaglia D (1995) Introdução ao uso de marcadores RAPD e RFLP em análise genética. EMBRAPA-CENARGEN, Brasília, 220 p.
Flanagan NS, Blum MJ, Davison A, Alamo M, Albarrán R, Faulhaber K, Peterson E and McMillan WO (2002) Charac-terization of microsatellite loci in neotropical Heliconius
butterflies. Mol Ecol Notes 2:398-401.
Ford EB (1964) Ecological Genetics. Methuen, London, 335 p. Ford EB (1975) Ecological Genetics. 4th edition. Chapman and
Hall, London, 442 p.
Grisel JE (2000) Quantitative traitlocus analysis. Alcohol Res
Health 24:169-174.
Hall D, Tegström C and Ingvarsson PK (2010) Using association mapping to dissect the genetic basis of complex traits in plants. Brief Funct Genomics 9:157-165.
Hamilton WD (1964a) Genetical evolution of social behavior. I. J Theor Biol 7:1-16.
Hamilton WD (1964b) Genetical evolution of social behavior. II. J Theor Biol 7:17-52.
Jiggins CD, Mavarez J, Beltrán M, McMillan WO, Johnston JS and Bermingham E (2005) A genetic linkage map of the mi-metic butterfly Heliconius melpomene. Genetics 171:557-570.
Joron M, Frezal L, Jones RT, Chamberlain NL, Lee SF, Haag CR, Whibley A, Becuwe M, Baxter SW, Ferguson L, et al.
(2011) Chromosomal rearrangements maintain a polymor-phic supergene controlling butterfly mimicry. Nature 477:203-206.
Kapan DD, Flanagan NS, Tobler A, Papa R, Reed RD, Gonzalez JA, Restrepo MR, Martinez L, Maldonado K, Ritschoff C,et al. (2006) Localization of Müllerian mimicry genes on a
dense linkage map of Heliconius erato. Genetics 173:735-757.
Kettlewell HBD (1955) Selection experiments on industrial me-lanism in the Lepidoptera. Heredity 9:323-342.
Lapidge KL, Oldroyd BP and Spivak M (2002) Seven suggestive quantitative traitlociinfluence hygienic behavior of honey bees. Naturwissenschaften 89:565-568.
Lynch M and Walsh B (1998) Genetics and Analysis of Quantita-tive Traits. Sinauer Associates, Sunderland, 980 p. Mega NO and Revers LF (2011) Developing a rapid, efficient and
low cost method for rapid DNA extraction from arthropods. Cienc Rural 41:1563-1570.
Merrill RM, Dasmahapatra KK, Davey JW, Dell’Aglio DD, Hanly JJ, Huber B, Jiggins CD, Joron M, Kozak KM, Llaurens V,et al.(2015) The diversification ofHeliconius
butterflies: What have we learned in 150 years? J Evol Biol 28:1417-1438.
Olson JM, Witte JS and Elston RC (1999) Tutorial in biostatistics genetic mapping of complex traits. Stat Med 18:2961-2981. Pritchard JK, Stephens M and Donnelly P (2000) Inference of
population structure using multilocus genotype data. Genet-ics 155:945-959.
Ramos RR and Freitas AVL (1999) Population biology and wing color variation inHeliconius erato phyllis(Nymphalidae). J
Lepid Soc 53:11-21.
Roff DA, Tucker J, Stirling G and Fairbairn DJ (1999) The evolu-tion of threshold traits: Effects of selecevolu-tion on fecundity and correlated response in wing dimorphism in the sand cricket. J Evol Biol 12:535-546.
Setakis E, Stirnadel H and Balding DJ (2006) Logistic regression protects against population structure in genetic association studies. Genome Res 16:290-296.
Thompson GJ, Hurd PL and Crespi BJ (2013) Genes underlying altruism. Biol Lett 9:20130395.
Tobler A, Kapan D, Flanagan NS, Gonzalez C, Peterson E, Jiggins CD, Johntson JS, Heckel DG and McMillan WO (2005) First-generation linkage map of the warningly col-ored butterflyHeliconius erato. Heredity 94:408-417.
Wang Y, Localio R and Rebbeck TR (2005) Bias correction with a single null marker for population stratification in candidate gene association studies. Hum Hered 59:165-175.
Wu R, Ma CX and Casella G (2002) Joint linkage and linkage dis-equilibrium mapping of quantitative traitlociin natural
pop-ulations. Genetics 160:779-792.
Yu J, Pressoir G, Briggs WH, Bi IV, Yamasaki M, Doebley JF, McMullen MD, Gaut BS, Nielsen DM, Holland JB,et al.
(2005) A unified mixed-model method for association map-ping that accounts for multiple levels of relatedness. Nat Genet 38:203-208.
Zhang L, Li J, Pei YF, Liu Y and Deng HW (2009) Tests of associ-ation for quantitative traits in nuclear families using
princi-pal components to correct for population stratification. Ann Hum Genet 73:601-613.
Zhu X, Li S, Cooper RS and Elston RC (2008) A unified associa-tion analysis approach for family and unrelated samples cor-recting for stratification. Am J Hum Genet 82:352-365.
Supplementary material
The following online material is available for this article: Table S1 – Significant AFLP markers: association of allele presence/absence with cannibalism phenotypes.
Table S2 – Significant AFLP markers: association of allele presence/absence with cannibalism/kin recognition pheno-types.
Associate Editor: Loreta B. Freitas