Acta Scientiarum
http://www.uem.br/acta ISSN printed: 1679-9275 ISSN on-line: 1807-8621
Doi: 10.4025/actasciagron.v38i1.26045
Interference of genotype-by-environment interaction in the
selection of inbred lines of yellow melon in an agricultural center in
Mossoró-Assu, Brazil
Isaias Porfírio Guimarães1, Júlio César DoVale2*, Rafaela Priscila Antônio3, Fernando Antônio Souza de Aragão4 and Glauber Henrique de Sousa Nunes1
1
Departamento de Fitotecnia, Universidade Federal Rural do Semi-Árido, Mossoró, Rio Grande do Norte, Brazil. 2
Departamento de Fitotecnia, Universidade Federal do Ceará, Avenida Mister Hull, 2977, Campus do Pici, 60356-000, Fortaleza, Ceará, Brazil. 3
Empresa Brasileira de Pesquisa Agropecuária Semi-Árido, Petrolina, Pernambuco, Brazil. 4
Empresa Brasileira de Pesquisa Agropecuária Agroindústria Tropical, Fortaleza, Ceará, Brazil. *Author for correspondence. E-mail: [email protected]
ABSTRACT. The aims of this study were to i) identify the influence of the GxE interaction in the selection of inbred lines of melon, and ii) test the efficiency of different indexes in the selection of inbred lines with a higher yield potential and better quality fruit. For these purposes, 98 inbred lines of yellow melon and two commercial controls, Vereda and AF-646, were evaluated in a randomized block design with two replications, at the conditions present in Mossoró and Baraúna. Analyses of the following traits were performed: fruit yield, mean fruit weight, pulp thickness, pulp firmness and soluble solids content. A complex portion of the GxE interaction was predominantly detected for all traits. The recommendation in this case is to promote selection in each environment. Alternatively, selection based on the average behavior of the inbred lines is the strategy that generates the greatest gains, approaching those obtained through direct selection in each specific environment. The selection indexes aimed at reducing the expression of all traits proved to be best for both locations. The index constructed for Baraúna allowed the selection of a greater number of inbred lines with a higher yield potential and better quality fruit and, thus, greater efficiency.
Keywords: Cucumis melo L, segregant populations, genetic gains, inbred lines extraction, hybrids, selection indexes.
Interferência da interação genótipo por ambiente na seleção de linhagens de melão
amarelo no agropolo Mossoró-Assu, Brasil
RESUMO. Objetivou-se com esse estudo: i) identificar a interferência da interação GxE no processo de seleção de linhagens de melão e; ii) testar a eficiência de índices na seleção de linhagens com maior potencial produtivo e melhor qualidade de fruto. Para isto, avaliaram-se 98 linhagens de melão amarelo e duas testemunhas, Vereda e AF-646, em blocos casualizados com duas repetições, em Mossoró e Baraúna, localizadas no Agropolo produtor desta hortaliça. Avaliaram-se os caracteres produtividade de frutos, massa média de frutos, espessura de polpa, firmeza de polpa e sólidos solúveis. Detectou-se uma predominância da porção complexa na interação GxE em todos os caracteres. A recomendação, neste caso, é promover a seleção em cada ambiente. Alternativamente, a seleção baseada no comportamento médio das linhagens é a estratégia que gera ganhos mais próximos àqueles obtidos pela seleção direta em cada ambiente específico. Os índices de seleção, com o propósito de reduzir a expressão de todos os caracteres, se mostraram melhores para ambas as localidades. Àquele construído para Baraúna permitiu selecionar um maior número de linhagens com elevado potencial produtivo e com melhores qualidades de fruto, sendo assim, mais eficiente.
Palavras-chave: Cucumis melo L, populações segregantes, ganho genético, extração de linhagens, híbridos, índices de seleção.
Introduction
The fruit of the melon (Cucumis melo L.) is one of the fruits most valued by the consumer in many countries. The harvested area of this crop worldwide was 1.19 million hectares in 2013, with production of 29.46 million tons being recorded. Currently, the
production, accounting for 99.98% of national melon production in 2014, with the states of Ceará (59.75%) and Rio Grande do Norte (39.56%) being the major producers. (Ministério do Desenvolvimento, Indústria e Comércio Exterior [MDIC], 2015).
Mossoró-Assu, in Rio Grande do Norte State, and Vale do Jaguaribe, in Ceará State, are the main melon-producing areas in Brazil. Although various types of melon are cultivated there, yellow melon is still the most commonly produced because it is easy to grow and exhibits a good harvest point, long postharvest life and has great demand in the European market. The majority of producers use cultivars such as Fito 10000, AF-682, AF-646, AF-4945, Jangada, Vereda, Frevo, Goldmine, Goldex, HY Brix, Mandacaru, Gold Mine, Rochedo, Amaral RZ and Natal RZ from the Syngenta, Sakata, Seminis, Fitó, Rijk Zwaan and Clouse companies. These genetic materials are employed for the purpose of circumventing the various difficulties encountered in these growing regions, including a high incidence of fungal diseases (Podosphaera xanthii, Pseudoperonospora cubensis, Rizhoctonia solani,
Macrophomina phaseolina and Fusarium oxysporum),
bacterial diseases (Acidovorax avenae), viruses (PRSV-W, WMV and ZYMV) and pests such as
Bemisia Tabaci – biotype B and Liriomyza spp, in
addition to abiotic stress due to salinity and high temperatures.
Considering the importance of this crop and the demands of the productive sector, the Federal Rural University of the Semi-Arid (Ufersa), in partnership with Embrapa, began a genetic improvement program aimed at producing simple hybrids in mid-2000. A major motivation for the implementation of this program was the fact that most of the hybrids used by Brazilian producers come from other countries, including the USA, Spain, France and Holland. Accordingly, an increase in yield and fruit quality is possible, as the varieties currently used in Mossoró-Assu may not be the most suitable. It is noteworthy that the Brazilian melon yield is far behind that of the leading producers in the world. Therefore, in addition to increasing productivity, melon breeding programs aim to generate cultivars that provide high-quality fruit. The attributes that determine fruit quality include sweetness, crunchiness, internal pulp thickness and firmness, among others. The latter two attributes are important mainly to ensure that the fruits can tolerate the conditions of transport and reach the market shelves at a high quality.
In melon breeding programs, the selection of dozens or hundreds of individuals is performed
every cycle. The various methods that are generally applied for this purpose focus mainly on just one trait. However, the evaluation of only one trait may not be adequate to represent the economic substance of a plant and can result in the development of economically poor types, due to the failure to consider other traits of economic importance or negative correlations with these traits. Therefore, it is important to practice balanced selection, that is, to facilitate the largest possible number of economically important traits, which appears possible through the adoption of selection indexes.
The Mossoró-Assu region exhibits great climate and soil diversity. Thus, a GxE interaction is very likely, which plays a leading role in phenotypic manifestations. Studies have demonstrated the presence of this type of interaction in experiments evaluating melon cultivars (Nunes, Madeiros, Grangeiro, Santos, & Sales Junior, 2006; Freitas, Crisóstomo, Silva, Pitombeira, & Távora, 2007). Thus, it is advisable to assess lines for a selection effect in more than one environment to estimate the magnitude of the GxE interaction effect. However, research of the influence of variance components on such estimates is scarce for melons. Nevertheless, such studies are necessary for the calculation of genetic parameters and selection gains in segregating populations.
In this context, the aim of this study was to identify the influence of the GxE interaction on the selection of lines of yellow melon at the agricultural center of Mossoró-Assu and to test the efficiency of selection indexes to identify the most promising inbred lines of yellow melon.
Material and methods
The experiments were conducted in the municipalities of Mossoró (5º 11' S, 37° 21' W, elevation 18 min.) and Baraúna (5º 05' S, 37° 38' W, elevation 95 min.), located in the Mossoró-Assu region, RN, Brazil. The climatic conditions during the experiments were as follows: Mossoró (Tmax = 32.1, Tmin = 27.4°C, relative humidity =
67.7%, pluviometric precipitation = 0.0 mm) and Baraúna (Tmax = 29.8, Tmin = 27.1°C, relative
humidity = 69.2%, pluviometric precipitation = 5.0 mm).
GxE interaction in yellow melon 53
was applied when the lines were in the eighth generation of selfing, selecting 98 lines according to their fruit quality, earliness and yield.
The parents, AM-02 and Gold Mine, are hybrids of andromonoecious yellow melon varieties with white flesh (Table 1). Gold Mine is resistant to races 1 and 2 of Podosphaera xantii (the causal agent of powdery mildew) and exhibits excellent fruit quality and good productivity.
Table 1. Characteristics of the parents used for obtaining the yellow melon progeny grown in two localities of the agricultural center of Mossoró-Assu, Rio Grande do Norte State, 2013.
Characteristics Parents
AM-02 Gold Mine
Genetic
structure Single cross (hybrid) Single cross (hybrid)
Botanic group inodorus inodorus
Commercial
type Yellow melon Yellow melon
Agronomic ability
High content of soluble solids;Resistant to race
1 of P. xanthii;
High productivity, yellow-golden skin,
white flesh, very vigorous and robust; Resistant to R. solani.
High content of soluble solids; Resistant to races 1 and 2 of P.
xanthii;
High productivity, adapted to the rainy season, very vigorous and robust plants; fruit slightly oval round, yellow-gold shell, slightly wrinkled, firm cream-green flesh and
crisp, with small hollow seeds and a sweet flavor.
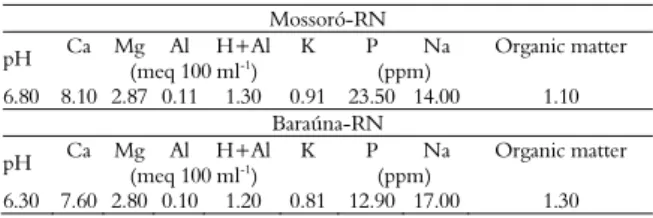
The experiments were conducted from September to December 2009. Seeds were sown in polystyrene trays and subsequently transplanted to the field. Pesticides were applied to control powdery mildew, the leaf miner fly and whitefly. Fertilization was based on soil analysis (Table 2): Mossoró (12 ton. manure, 400 kg KCl, 120 kg urea, 300 kg K2O, 90 kg P2O5) and Baraúna (6 ton manure,
560 kg KCl, 90 kg urea, 250 kg K2O, 120 kg P2O5).
The harvest was initiated at 62 and 61 days after sowing at Mossoró and Baraúna, respectively.
Table 2. Soil fertility analysis at two localities in the agricultural center of Mossoró-Assu, Rio Grande do Norte State, 2013.
Mossoró-RN
pH Ca Mg Al H+Al K P Na Organic matter
(meq 100 ml-1) (ppm)
6.80 8.10 2.87 0.11 1.30 0.91 23.50 14.00 1.10 Baraúna-RN
pH Ca Mg Al H+Al K P Na Organic matter
(meq 100 ml-1) (ppm)
6.30 7.60 2.80 0.10 1.20 0.81 12.90 17.00 1.30
The experiments were carried out in a randomized block design with two replications. Each plot consisted of a 5-m long row of plants, which were separated by 0.5 m. Each hill contained a single plant and a 2-m pathway, which was maintained between the rows.
The following traits were evaluated: a) fruit yield, obtained by weighing all fruit from the plot
(ton ha-1); b) mean fruit weight, obtained from the
sum of the fruit mass divided by the number of fruits (kg); c) pulp thickness, the sides of each half of the fruit were measured with a ruler to calculate mean values (cm); d) pulp firmness, obtained by halving the fruit lengthwise and using a penetrometer to measure the resistance in the edible middle region (four readings were performed per fruit in different regions), which was equidistant in relation to the length and pulp thickness. The results were expressed in pounds (lb) and subsequently converted to Newtons (N), with 1 N = 1 lb x 4.45; and e) soluble solids content, determined by reading a few drops of fruit juice in a digital refractometer (°Bx). A random sample of eight fruits per plot was used to evaluate pulp thickness, pulp firmness and soluble solids content.
First, analyses of variance were performed (for the environment) according to the following statistical Equation 1:
ij j i ij
Y =
µ
+b +g +ε
(1)where:
Yij is the observed value for the trait in the i-th
genotype, in the j-th repetition;
μ is the overall mean for the trait (fixed); bj is the effect of j-th repetition (fixed); gi is the effect of the i-th genotype (fixed);
εij is the effect of the error associated with the i-th genotype in the j-th repetition (random).
Subsequent analyses of variance (considering both environments) were carried out according to the following statistical Equation 2:
( )
ijk j i k ik ijk
Y =
µ
+b +g +a + ga +ε
(2)where:
Yijk is the observed value for the trait in i-th
genotype, in the j-th repetition and in the k-th environment;
μ is the overall mean for the trait (fixed); bjis the effect of the j-th repetition (fixed); gi is the effect of the i-th genotype (fixed); akis the effect of the k-th environment (fixed);
(ga)ik is the effect of the interaction between the i-th genotype and the k-th environment (fixed);
εijk is the effect of the error associated with the i-th genotype in the j-th repetition and the k-th environment (random).
2
j j j
GS =DS ×H (3)
where:
GSj is the gain due to direct selection in
environment j;
DSjis the selection differential in environment j;
H2
j is the coefficient of genotypic determination
of the trait in environment j.
The gains from the indirect response to selection in both environments were calculated using the Equation 4:
2 ( ) ( )
j j j j j
GS ′ =DS′ ×H ′ (4)
where:
GS j'(j) is the gain in the environment j’, with
selection based on environment j;
DS j'(j)is the selection differential in environment j’, with the best-performing individuals in environment j;
and H2
j' is the coefficient of genotype
determination of the trait in environment j'.
The gains from the indirect selection, based on the means in both environments, were calculated using the Equation 5:
2
(m) (m) j
GS =DS ×H (5)
where:
GS j(m) is the gain in environment j, with selection based on the mean of four environments;
DS j(m) is the selection differential in environment j, with the best-performing individuals in the four environments;
H2
jis the coefficient of genotype determination
of the trait in the environment j (Cruz, Regazzi, & Carneiro, 2004). The applied selection intensity was 25%.
Selection indexes for Mossoró and Baraúna localities were constructed with the aim of increasing or decreasing the expression of all traits simultaneously. Thus, we employed the classical indexes proposed by Smith (1936) and Hazel (1943). These indexes consist of a linear combination of the phenotypic value of several traits of economic importance. The weighting coefficients were estimated to maximize the correlation between the selection index and the phenotypic aggregate (Cruz et al., 2004). This phenotypic aggregate was established through another linear combination that takes breeding values into consideration, which are weighted by their respective economic values.
The selection index (SI) and genotypic aggregate (PA) can be described as follows in Equations 6 and 7:
1 1 2 2
1 ...
n
n n i i
i
SI b x b x b x b x b x
=
′
= + + + =
= (6)1 1 2 2
1 ...
n
n n i i
i
PA a g a g a g a g a g =
′
= + + + =
= (7)where:
n is number of traits; p is number of tested inbred lines;
b is a vector with 1 x n dimensions of the weightings of the selection index to be estimated;
x is a matrix with n x p dimensions of the means phenotypic traits;
a is a vector with 1 x n dimensions of previously established economic weights;
g is matrix with n x p dimensions of unknown breeding values of the n considered traits. Therefore, to estimate the selection index for each inbred line, it was necessary to estimate the vector b, which was obtained so that the correlation between SI and AP was maximized. Thus, the following Equation 8 was considered:
1
b=P Ga− (8)
where:
b is an estimator vector with n x 1 dimensions of the weighting coefficient of the selection index;
P-1 is the inverse matrix of the phenotypic
variances and covariances among the traits, with n x n dimensions;
G is the matrix of genetic variances and covariances among traits with n x n dimensions.
The gain expected for trait j when selection was performed based on the index was obtained by Equation 9:
( ) ( ) 2
ˆ ˆ
ˆ
I
j I j I gjI I j
I
DS
g g β DS G b
σ
Δ = = = (9)
where:
ˆ
gjI
β is the estimator regression of the genetic
coefficient values of trait j for function index I;
I s o
DS =I −I is the selection differential given by the difference between the mean for selected individuals (Is) and the original population mean (Io) relative to the index;
GxE interaction in yellow melon 55
covariance between this trait and the other trait. Considering thatΔ = Δg g1( )I Δg2( )I Δgn I( ), we have
the following Equation 10:
ˆI i
g Gb
σ
Δ = (10)
where:
i is the selection differential in standard deviation units for index I, and, σˆIis the standard deviation of index I. The present study considered 10% of individuals. Economic weights were estimated from the genetic variation coefficients for each trait, following the suggestions of Cruz, Regazzi and Carneiro (2004). All analyses were processed using the software Genes (Cruz, 2013).
Results and discussion
The effect of the genotype (G) differed significantly (p ≤ 0.01) for all traits, except for that for pulp firmness (Table 3), demonstrating that there was at least one line with different mean values. Thus, an indication of genetic variability, allowing for genetic gains under selection, was observed. The effect of the environment (E) was also significant for all traits, demonstrating that the environments analyzed in the study contrast sufficiently to allow for different behaviors of the lines to discriminate between these traits. The interference from the environment is mainly due to soil conditions and climate. As a result, a pronounced effect was expected, as reported in studies involving the melon crop in the semiarid Brazilian region (Nunes, Andrade Neto, Costa Filho, & Melo, 2011a; Nunes et al., 2011b; Silva, Nunes, Costa, Aragão, & Maia, 2011).
Similarly, the effect of the G x E interaction was different for all traits. Thus, it is necessary to perform selection in each specific environment, as the alleles expressed in one environment may not be expressed in another. This is evident when observing the estimates of the ratios between the genetic differential and the G x E interaction (φ φG G A× ), as well as the different portions of this
interaction (Table 3). The ratios were always lower than unity, except for pulp thickness. The smaller this ratio is, the greater the contribution of the G x E interaction to phenotypic manifestations will be. Thus, the pronounced occurrence of this interaction necessitates the assessment of melon lines in each
environment in order to obtain more reliable results during selection.
Table 3. Mean squares of the combined analysis of variance, variance components and interaction portion for fruit yield (ton ha-1
), mean fruit weight (g), pulp thickness (cm), pulp firmness (N) and soluble solids content (°Bx) in yellow melon lines grown at two localities in the agricultural center of Mossoró-Assu, Rio Grande do Norte State, 2013.
Effects
Mean squares
Fruit yield
Mean fruit weight
Pulp thickness
Pulp firmness
Soluble solids content Genotype (G) 322.88**
0.44**
1.61**
3.85ns
4.51**
Environment (E) 577.44** 24.68** 12.65** 177.00** 22.94**
G x E 445.13** 0.54** 1.43** 5.32** 5.15**
Residue 177.41 0.17 0.84 3.40 1.95
Variance components
36.37 0.069 0.193 0.112 0.639
66.29 0.185 0.147 0.480 0.800
0.55 0.37 1.31 0.23 0.801
Interaction portion
Simple (%) 2.34 1.59 12.87 0.19 2.88
Complex (%) 97.66 98.41 87.13 99.81 97.22
rG 0.45 0.35 0.57 0.15 0.44
** and ns: significant at a 1% probability and non-significant, respectively, by Snedecor's
F distribution. : genetic differential between lines; and : differential of the
G x E interaction. rG: genetic correlation between the environments.
Two factors constitute the G x E interaction: a) the simple portion, which is linked to the differences in variability between the genotypes; and b) the complex portion, which depends on the genetic correlation of the genotypes in the environments (Cruz & Castoldi, 1991). In the present study, the complex portion of the interaction was predominant for all traits (> 87%). Predominance of the complex portion has also been reported in several previous studies involving traits related to melon yield and quality (Nunes et al., 2006). However, Nunes et al. (2011b) observed a prevalence of the simple portion of the interaction for yield and soluble solids content. It is likely that such differences are due to the different genotypes and environmental conditions analyzed during these studies.
Quantification of the factors that constitute the interaction is important because it reveals to the plant breeder the degree of difficulty at the time selection or cultivar recommendation. When the simple portion is predominant, the plant breeder’s work is facilitated because the genotype classification does not change across environments. However, a predominant complex portion can become a hindrance to researchers because there are genotypes that are well adapted to specific environments. In this case, the G x E interaction can be exploited by plant breeders through the selection of certain
G
φ
G A φ ×
G G A
φ φ×
G
genotypes for a given environment. The interaction is capitalized upon by increasing the phenotypic value of the trait. In the case of melon, due to the peculiarities involved in crop management, it would be possible to recommend a particular genotype for each farm. However, the adoption of a certain hybrid by a producer tends to be followed by the majority, partially due to the fact many small farmers work for large companies and therefore grow the same hybrid.
One implication of the effect of the G x E interaction can be observed in the estimates of variance components. In assessments involving a single environment, the genetic variance is overestimated due to the absence of an interaction, which cannot be estimated. This situation was evident in the present study, when the genetic differential and coefficients of genotype determination for the individual analyses were compared with those obtained in the combined analyses (Table 4). The discrepancy was even greater for fruit yield, likely because the genetic control is more complex and therefore more strongly influenced by the environment.
Table 4. Estimates of the genetic differential and coefficients of genotype determination and analyses of variance (individual and combined) for fruit yield (ton ha-1), mean fruit weight (g), pulp thickness (cm), pulp firmness (N) and soluble solids content (°Bx) in yellow melon lines grown at two localities in the agricultural center of Mossoró-Assu, Rio Grande do Norte State, 2013.
Parameter Location Fruit yield
Mean fruit weight
Pulp thickness
Pulp firmness
Soluble solids content
Mossoró 125.01 0.165 0.334 0.653 1.409
Baraúna 81.58 0.157 0.344 0.531 1.469
Combined 66.29 0.093 0.147 0.480 0.800
Mossoró 58.30 66.76 37.98 29.04 60.66
Baraúna 48.11 64.97 53.58 22.72 58.65
Combined 45.05 62.17 47.72 11.64 56.74
: genetic differential between lines; and : coefficient of genotype determination.
It is known that the G x E interaction also influences the estimated coefficient of genotype determination. This coefficient expresses the
same idea of heritability; i.e., phenotypic variation (total) is explained by genotypic factors. It is a fundamental parameter for the plant breeder, and its magnitude is related to success in selection processes. It indicates a strong relationship between phenotype and genotype when it is close to unity (or 100%). In the present study, the estimates are close to those observed by Silva, Nunes, Costa, Aragão and Maia (2011) for Galia melon lines in different environments of northeastern Brazil. They are also within the range of values observed in some studies conducted in other countries (Randhawa & Singh, 1990; Feyzian, Dehghani, Rezai, & Javaran, 2009). It is noteworthy that the coefficient of genotype determination is inherent to population and environmental conditions, as is heritability. Thus, comparisons between the estimates obtained in this study and those obtained in others should be made carefully and only as a means of providing initial guidance regarding the true magnitude of the observed genetic variation (Cruz et al., 2004).
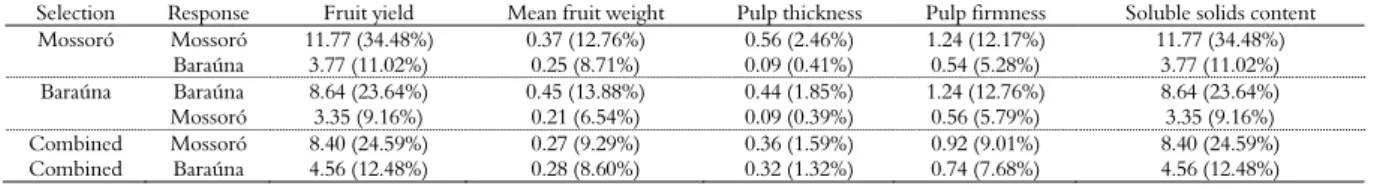
The G x E interaction also directly influences the obtained selection gains, due to the lack of correlation between the genotype means in the evaluated environments (DoVale, Fritsche-Neto, Bermudez, & Miranda, 2012). Therefore, when selection is carried out in one environment and the response is observed in another, the gain expected in the presence of a strong interaction is reduced or may become negative. Accordingly, direct gains were always superior to indirect gains in all situations and for all traits (Table 5). This result confirms the existence of a strong G x E interaction. The reduction of gains through indirect selection occurs due to the reduced estimated genetic correlation between the two environments considered (Table 3). In other words, the covariance between the means of lines in both environments is very low (DoVale & Fritsche-Neto, 2013). This is further proof that the distinct performance of different lines in the two environments is not coincidental.
Table 5. Genetic gains through direct and indirect selection for fruit yield (ton ha-1), mean fruit weight (g), pulp thickness (cm), pulp firmness (N) and soluble solids content (ºBx) in yellow melon lines grown at two localities in the agricultural center of Mossoró-Assu, Rio Grande do Norte State, 2013.
Selection Response Fruit yield Mean fruit weight Pulp thickness Pulp firmness Soluble solids content
Mossoró Mossoró 11.77 (34.48%) 0.37 (12.76%) 0.56 (2.46%) 1.24 (12.17%) 11.77 (34.48%)
Baraúna 3.77 (11.02%) 0.25 (8.71%) 0.09 (0.41%) 0.54 (5.28%) 3.77 (11.02%)
Baraúna Baraúna 8.64 (23.64%) 0.45 (13.88%) 0.44 (1.85%) 1.24 (12.76%) 8.64 (23.64%)
Mossoró 3.35 (9.16%) 0.21 (6.54%) 0.09 (0.39%) 0.56 (5.79%) 3.35 (9.16%)
Combined Mossoró 8.40 (24.59%) 0.27 (9.29%) 0.36 (1.59%) 0.92 (9.01%) 8.40 (24.59%)
Combined Baraúna 4.56 (12.48%) 0.28 (8.60%) 0.32 (1.32%) 0.74 (7.68%) 4.56 (12.48%)
G φ
2
G H
G
φ 2
G
GxE interaction in yellow melon 57
A major objective of crop genetic improvement programs, such as the Melon Genetic Improvement Program at Ufersa, is to obtain cultivars that are widely adapted to regions with agricultural potential. However, the results obtained in this study show that the lines derived by the program exhibit potential for one environment per se, but not for the other. Nevertheless, it is worth noting that the genetic control of various traits related to melon yield and quality is due to the predominance of non-additive gene effects (Feyzian et al., 2009). Thus, even when there is inconsistent performance in the two environments, it is possible that these lines may be used in the formation of hybrids to be recommended for both Mossoró and Baraúna.
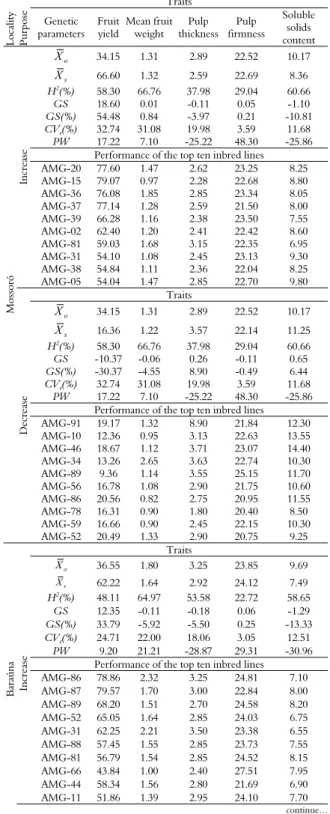
An alternative biometric procedure to mitigate the effect of G x E interactions and consequently increase the gains from indirect selection is the use of environment means to calculate the expected response. By adopting this procedure, gains closer to direct gains were observed (Table 5). Silva et al. (2011) applied this alternative procedure in Galia melons in four municipalities of Mossoró-Assu. These authors also observed a decreased interaction in relation to the gains associated with selection. Additionally, they did not recommend high-intensity selection. Following these recommendations, selection indexes were constructed for each specific environment with different purposes; i.e., to increase or decrease the expression of the traits simultaneously (Table 6). The index for Mossoró, generated from the coefficients of genotypic variation for each trait, was SIM = 17.22 FY + 7.10 MFW -
25.22 PT + 48.30 PF - 25.86 SS, where FY = fruit yield, MFW = mean fruit weight, PT = pulp thickness, PF = pulp firmness, and SS = soluble solids content. When the purpose was to increase the expression of all traits simultaneously, it was observed that the average values of some of these traits were reduced. This result was demonstrated by the mean of the selected individuals and thus the negative gains associated with selection (GS and GS [%]). Moreover, the total gain observed for all traits considered simultaneously was 17.45.
Based on the performance of the top ten inbred lines, it was verified that some of these lines exhibited fruit yields that outperformed 75 tons per hectare. Furthermore, the selection index made it possible to select inbred lines of yellow melon with a reduced mean fruit weight (< 2.0 kg) and a pulp firmness suitable for export (> 22 N). Moreover, the observed pulp thickness was below the recommended content of soluble solids. Fruit sweetness may be the trait that most strongly influences the price of melon fruit. Thus, although this index allows satisfactory gains in yield to be achieved, it does not allow the selection of an
inbred line that produces a content of soluble solids above 9ºBx, which is recommended for marketing (Nunes et al., 2004).
Table 6. Genetic parameters, purpose of selection, performance of the top ten inbred lines, and selection indexes for fruit yield (ton ha-1), pulp thickness (cm), pulp firmness (N) and soluble solids content (°Bx) in inbred lines of yellow melon grown at two municipalities in the agricultural center of Mossoró-Assu, Rio Grande do Norte State, 2013.
Loc
ali
ty
Pu
rpose
Traits
Genetic parameters
Fruit yield
Mean fruit weight
Pulp thickness
Pulp firmness
Soluble solids content
Mossoró
In
cr
ea
se
o
X 34.15 1.31 2.89 22.52 10.17
s
X 66.60 1.32 2.59 22.69 8.36
H2(%) 58.30 66.76 37.98 29.04 60.66
GS 18.60 0.01 -0.11 0.05 -1.10
GS(%) 54.48 0.84 -3.97 0.21 -10.81
CVg(%) 32.74 31.08 19.98 3.59 11.68
PW 17.22 7.10 -25.22 48.30 -25.86
Performance of the top ten inbred lines
AMG-20 77.60 1.47 2.62 23.25 8.25
AMG-15 79.07 0.97 2.28 22.68 8.80
AMG-36 76.08 1.85 2.85 23.34 8.05
AMG-37 77.14 1.28 2.59 21.50 8.00
AMG-39 66.28 1.16 2.38 23.50 7.55
AMG-02 62.40 1.20 2.41 22.42 8.60
AMG-81 59.03 1.68 3.15 22.35 6.95
AMG-31 54.10 1.08 2.45 23.13 9.30
AMG-38 54.84 1.11 2.36 22.04 8.25
AMG-05 54.04 1.47 2.85 22.70 9.80
Dec
reas
e
Traits
o
X 34.15 1.31 2.89 22.52 10.17
s
X 16.36 1.22 3.57 22.14 11.25
H2(%) 58.30 66.76 37.98 29.04 60.66
GS -10.37 -0.06 0.26 -0.11 0.65
GS(%) -30.37 -4.55 8.90 -0.49 6.44
CVg(%) 32.74 31.08 19.98 3.59 11.68
PW 17.22 7.10 -25.22 48.30 -25.86
Performance of the top ten inbred lines
AMG-91 19.17 1.32 8.90 21.84 12.30
AMG-10 12.36 0.95 3.13 22.63 13.55
AMG-46 18.67 1.12 3.71 23.07 14.40
AMG-34 13.26 2.65 3.63 22.74 10.30
AMG-89 9.36 1.14 3.55 25.15 11.70
AMG-56 16.78 1.08 2.90 21.75 10.60
AMG-86 20.56 0.82 2.75 20.95 11.55
AMG-78 16.31 0.90 1.80 20.40 8.50
AMG-59 16.66 0.90 2.45 22.15 10.30
AMG-52 20.49 1.33 2.90 20.75 9.25
Baraúna In
cr
ea
se
Traits
o
X 36.55 1.80 3.25 23.85 9.69
s
X 62.22 1.64 2.92 24.12 7.49
H2(%) 48.11 64.97 53.58 22.72 58.65
GS 12.35 -0.11 -0.18 0.06 -1.29
GS(%) 33.79 -5.92 -5.50 0.25 -13.33
CVg(%) 24.71 22.00 18.06 3.05 12.51
PW 9.20 21.21 -28.87 29.31 -30.96
Performance of the top ten inbred lines
AMG-86 78.86 2.32 3.25 24.81 7.10
AMG-87 79.57 1.70 3.00 22.84 8.00
AMG-89 68.20 1.51 2.70 24.58 8.20
AMG-52 65.05 1.64 2.85 24.03 6.75
AMG-31 62.25 2.21 3.50 23.38 6.55
AMG-88 57.45 1.55 2.85 23.73 7.55
AMG-81 56.79 1.54 2.85 24.52 8.15
AMG-66 43.84 1.00 2.40 27.51 7.95
AMG-44 58.34 1.56 2.80 21.69 6.90
AMG-11 51.86 1.39 2.95 24.10 7.70
... continuation
Dec
reas
e
Traits
o
X 36.55 1.80 3.25 23.85 9.69
s
X 21.40 1.81 4.13 23.55 11.99
H2(%) 48.11 64.97 53.58 22.72 58.65
GS -7.29 0.00 0.47 -0.07 1.35
GS(%) -19.94 0.24 14.46 -0.29 13.94
CVg(%) 24.71 22.00 18.06 3.05 12.51
PW 9.20 21.21 -28.87 29.31 -30.96
Performance of the top ten inbred lines
AMG-41 21.92 1.78 9.35 23.28 11.45
AMG-60 15.41 1.46 3.55 23.91 14.05
AMG-96 21.64 1.61 4.10 24.25 13.20
AMG-95 20.90 1.79 3.65 24.31 13.45
AMG-36 24.13 1.41 3.15 22.27 11.60
AMG-28 19.14 1.37 2.15 21.48 9.85
AMG-06 19.86 1.59 3.20 22.68 10.05
AMG-40 27.91 2.15 4.50 24.04 12.50
AMG-84 16.90 3.24 3.95 23.56 9.85
AMG-93 26.21 1.73 3.65 25.79 13.90
o
X = mean of the original population; Xs= mean of selected individuals;
H2(%)=coefficient of genotype determination as a percentage; GS =gains associated
with selection; GS = gains associated with selection as a percentage;
CVg(%)= coefficient of genotype variation as a percentage; and PW= phenotypic
weight.
The index described above aimed at reducing the expression of all traits simultaneously provided a total gain of -9.63 for the location of Mossoró. Much of this reduction was due to a considerable decrease in the fruit yield trait. Nevertheless, it was observed that among the ten lines selected as being the best, certain lines should be highlighted, such as AMG-91, AMG-86, and AMG-52, because their average productivity was very close to or above 20 tons per hectare, which characterizes a good yield. Additionally, these lines produce fruits with a low weight (suitable for export), the recommended pulp thickness and pulp firmness, and soluble solids content above the minimum recommended for export. Therefore, although the purpose of this index was to reduce the expression of various traits simultaneously, it was found to be more efficient in selecting inbred lines of yellow melon with a greater potential than when it was used to enhance expression.
Similar results were obtained for the conditions of Baraúna. The selection index simultaneously generated for this location was as follows: SIB = 9.20
FY + 21.21 MFW - 28.87 PT + 29.31 PF - 30.96 SS. When this selection index was employed to increase the expression of the traits, low fruit yields of the top ten inbred lines were generally observed, in addition to low values of the soluble solids content trait. However, when the index was used to decrease the expression of the traits simultaneously, the opposite pattern was observed; i.e., higher mean values than those obtained when the same criteria were applied in the conditions of Mossoró. The latter index is more efficient because it made possible the selection of a greater number of lines
that showed a higher yield potential and produced quality products for commercial endpoints (AMG-41 AMG-96 AMG-95 AMG-36 AMG-40, and AMG-93). Moreover, no inbred lines were included among the top ten lines for both sets of conditions with the same purpose, which emphasizes the strong presence of the complex type of genotype-by-environmental interaction and thus the need to promote selection in each specific environment.
Conclusion
The complex type of genotype-by-environmental interaction exists between Mossoró and Baraúna. Therefore, selection of inbred lines should be performed for each specific environment. The selection indexes aimed at reducing the expression of all traits proved to be best for both locations. The selection index constructed for Baraúna allowed for the selection of a greater number of inbred lines with a higher yield potential and better quality fruit and thus greater efficiency.
References
Cruz, C. D. (2013). Genes – a software package for analysis in experimental statistics and quantitative genetics. Acta Scientiarum. Agronomy, 35(3), 271-276. Cruz, C. D., & Castoldi, F. L. (1991). Decomposição da
interação genótipos x ambientes em partes simples e complexa. Revista Ceres, 38(219), 422-430.
Cruz, C. D., Regazzi, A. J., & Carneiro, P. C. S. (2004).
Modelos biométricos aplicados ao melhoramento genético. Viçosa, MG: UFV.
DoVale, J. C., & Fritsche-Neto, R. (2013). Genetic control of traits associated with phosphorus use efficiency in maize by REML/BLUP. Ciência Agronômica, 44(3), 554-563.
DoVale, J. C., Fritsche-Neto, R., Bermudez, F., & Miranda, G. V. (2012). Efeitos gênicos de caracteres associados à eficiência no uso de nitrogênio em milho.
Pesquisa Agropecuária Brasileira, 47(3), 385-392.
Feyzian, E., Dehghani, H., Rezai, A. M., & Javaran, M. J. (2009). Diallel cross analysis for maturity and yield-related traits in melon (Cucumis melo L.). Euphytica, 168(2), 215-223.
Freitas, J. G., Crisóstomo, J. R., Silva, F. P., Pitombeira, J. B., & Távora, F. J. A. F. (2007). Interação entre genótipo e ambiente em híbridos de melão-amarelo no Nordeste do Brasil. Ciência Agronômica, 38(2), 176-181. Hazel, L. N. (1943). The genetic basis for constructing
selection indexes. Genetics, 28(6), 476-490.
GxE interaction in yellow melon 59
Nunes, G. H. S., Madeiros, A. E. S., Grangeiro, L. C., Santos, G. M., & Sales Junior, R. (2006). Estabilidade fenotipica de híbridos de melão amarelo avaliados no Polo Agroindustrial Mossoró-Assu. Pesquisa Agropecuária Brasileira, 41(9), 57-67.
Nunes, G. H. S., Andrade Neto, R. C., Costa Filho, J. H., & Melo, S. B. (2011a). Influência de variáveis ambientais sobre a interação genótipos x ambientes em meloeiro. Revista Brasileira de Fruticultura, 33(4), 1194-1199.
Nunes, G. H. S., Santos Júnior, H., Grangeiro, L. C., Bezerra Neto, F., Dias, C. T. S., & Dantas, M. S. M. (2011b). Phenotypic stability of hybrids of Galia melon in Rio Grande do Norte state, Brazil. Anais da Academia Brasileira de Ciências, 83(12), 1421-1434. Nunes, G. H. S., Santos Júnior, J. J. S., Andrade, F. V.,
Bezerra Neto, F., Almeida, A. H. B., & Medeiros, D. C. (2004). Aspectos produtivos e de qualidade de híbridos de melão cultivados no agropolo Mossoró-Assu. Horticultura Brasileira, 22(4), 744-747.
Organização das Nações Unidas para Alimentação e Agricultura. (2014). Production quantitative and area
harvested of melons in the world. Rome, Italy: FAO. Recuperado de http://faostat3.fao.org/download/ Q/QC/E.
Randhawa, K. S., & Singh, M. J. (1990). Assentment of combining ability, heterosis and genetic variance for fruit quality in muskmelon (Cucumis melo L.). Indian Journal of Horticulture, 50(2), 127-130.
Silva, J. M., Nunes, G. H. S., Costa, G. G., Aragão, F. A. S., & Maia, L. K. R. (2011). Implicações da interação genótipos x ambientes por ganho de seleção em meloeiro. Ciência Rural, 41(1), 51-56.
Smith, H. F. (1936). A discriminant function for plant selection. Annals of Eugenics, 7(3), 240-250.
Received on December 13, 2014. Accepted on May 15, 2015.