ISSN 1678-992X
ABSTRACT: Several empirical models were proposed to predict feed intake (FI) of growing-finishing pigs reared under high environmental temperatures. However, these models have not been evaluated under conditions different from those in which they were developed. Twelve em-pirical models were evaluated using a database built after systematic literature review (observed data: 28 studies in which the FI was evaluated in pigs under high environmental temperatures). Model accuracy was assessed using the mean squared of prediction error (MSPE). Analyses were performed considering two scenarios: (1) general population, where all observed data were used in the simulation; (2) reference population, where data were filtered in order to simulate only scenarios with environment (temperature range) and animals (body weight and sex) similar to that used in the model development. Six models estimated FI values similar (p > 0.05) to those observed in the general population, while four models produced estimates similar to the observed values in the reference populations. Most models were more accurate when they were simulated using the reference population than when the simulation considered the general data-base. Moving the simulation from the general database to the reference population reduced up to 98 % of the MSPE, depending on the equation. Empirical models allow to accurately predict FI of growing-finishing pigs exposed to high environmental temperatures, especially in scenarios similar to the ones used for model development. Thus, population characteristics (body weight and sex) and environment (temperature range) must be considered in the model assessment. Keywords: consumption, heat stress, modelling, precision feeding, swine
Empirical models to predict feed intake of growing-finishing pigs reared
Dani Perondi1, Marcos Kipper2*, Ines Andretta2, Luciano Hauschild1, Raquel Lunedo1, Carolina Schell Franceschina2, Aline Remus1,3
1Universidade Estadual Paulista "Júlio de Mesquita Filho"/
Faculdade de Ciências Agrárias e Veterinárias – Depto. de Zootecnia, Via de Acesso Prof. Paulo Donato Castellane, s/n – 14884-900 – Jaboticabal, SP – Brasil.
2Universidade Federal do Rio Grande do Sul/Faculdade de
Agronomia – Depto. de Zootecnia, Av. Bento Gonçalves, 7712 – 91540-000 – Porto Alegre, RS – Brasil.
3Agriculture and Agri-Food Canada/Sherbrooke Research
and Development Centre, 2000 College St. – J1M 1Z3 – Sherbrooke – Quebec – Canada.
*Corresponding author <[email protected]>
Edited by: Thomas Kumke
Received September 09, 2016 Accepted April 04, 2017
Introduction
Precision feeding has great potential to improve sustainability of pig production by ensuring a better adjustment of nutrient supply to animal requirements (Pomar et al., 2011). However, the proper application of precision feeding techniques depends on procedures that accurately predict the voluntary feed consumption (Po-mar et al., 1991; Whittemore et al., 1995).
Control mechanisms of feed intake (FI) are complex and influenced by factors that are both extrinsic and in-trinsic to the animals (Wellock et al., 2004; Kyriazakis and Whittemore, 2006). The complexity of these physiological processes may hinder FI estimation. Among these factors, environmental temperature is considered one of the most important variables affecting FI in growing pigs (Le Bellego et al., 2002; Renaudeau et al., 2011). The increased heat caused by the digestion process impairs the pig thermal ho-meostasis. Thus, pigs tend to decrease FI in environments with high temperature (Le Bellego et al., 2002). Due to its great importance to pig production, the effect of environ-mental temperature on FI has been assessed in many proj-ects, including studies using modeling approach.
Several empirical models were proposed to predict FI based on animal and environmental characteristics. However, these models were usually developed using da-tabases limited to some experimental conditions, which leads to the need for ensuring accuracy of their FI pre-dictions even in different scenarios. Therefore, this study
was developed to evaluate the accuracy, trueness, and precision of empirical models in predicting FI of growing-finishing pigs exposed to high environmental tempera-tures.
Materials and Methods
Description of empirical models
The empirical models proposed to estimate FI of growing-finishing pigs according to the environmental temperature were searched on digital databases. Publica-tions in the last 20 years were considered in the litera-ture review. Twelve empirical models were found in six published papers. All models presented in the original publications were tested in the current study with any previous modification or calibration. These models are presented and labelled in Table 1.
Massabie et al. (1996) proposed two models for bar-rows and two models for gilts. Equations were based on one study performed for each sex. In these trials, pigs weighing 25-105 kg were exposed to increasing tempera-tures (16, 20, 24, and 28 °C). The body weight was not considered as an independent variable in these models.
The model proposed by Rinaldo et al. (2000) was ob-tained using gilts and barrows weighing 35-90 kg, which were reared between 20 and 30 °C. The temperature was used to categorize the model and was not considered as a continuous variable in the model. The body weight was used within a quadratic adjustment to describe FI.
Animal Science and Pastur
es
|
Resear
ch Ar
ticle
The model reported by Quiniou et al. (2000) was obtained using barrows weighing 30-90 kg, which were reared from 19 to 29 °C. Body weight and temperature were considered as independent variables in the model, both showing a quadratic fitting.
Two empirical models were proposed by Collin et al. (2001) considering pigs with 15-30 kg of body weight that were exposed to increasing temperatures (19 to 35 °C). Sex was not considered in the modelling procedure. The model Collin I assumed a quadratic fit of FI to envi-ronmental temperature, while the model Collin II con-sidered a non-linear regression.
Renaudeau et al. (2011) conducted a meta-analysis using data from 86 studies evaluating the performance of pigs reared under high temperature. Using mixed lin-ear modelling, the authors considered linlin-ear and qua-dratic effects of temperature and body weight and their interaction on FI. Two models (Renaudeau I and II) con-sidered the quadratic effect of body weight, tempera-ture and their interaction to estimate FI. Another model (Renaudeau III) was proposed using a non-linear adjust-ment that considered the upper critical temperature de-pending on body weight, followed by the calculation of parameter α, which indicates the magnitude of FI reduc-tion when the upper critical temperature is exceeded.
The model proposed by NRC (2012) also recom-mended the use of critical temperature. In this model, the critical temperature is linearly related to the body weight (reduced by 0.0375 °C for each increase of 1 kg on body weight). Thus, this model predicts FI consider-ing the environmental temperature, linear critical tem-perature, and body weight.
Systematic literature review and database building
The empirical models were challenged with a database built with information collected in scientific papers that described the effect of high environmental temperature on pig performance. These papers were sys-tematically searched on digital databases. The criteria for paper selection were: (1) FI data on growing-finishing pigs exposed to high environmental temperatures; (2) ad libitum access to feed and water; (3) detailed description of environment and animal characteristics; and (4) di-etary metabolizable energy level higher than 3,000 kcal kg–1 of feed (Noblet and Van Milgen, 2004).
Forty-six articles published in peer-reviewed sci-entific journals from 1979 to 2014 matched the first se-lection criterion. These studies were then evaluated ac-cording to other criteria (2, 3, and 4) and 18 articles were removed from the database (two applied feed restric-tion, 12 showed incomplete information on body weight and temperature, and four studies used metabolizable energy levels lower than 3,000 kcal kg–1 of diet).
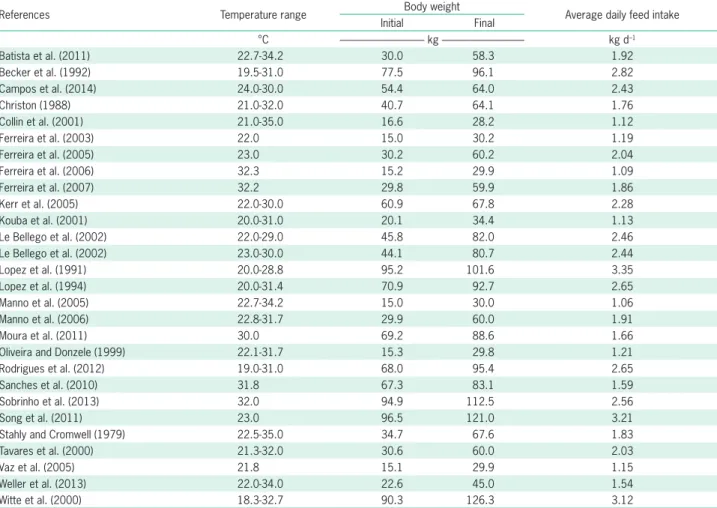
There-fore, 28 studies remained in the database (presented and briefly described in Table 2), totaling 226 observations and 1,968 animals. After selecting the papers, the infor-mation related to the proposed theoretical model and other additional variables were copied from sections material and methods and results in the original publi-cation, and transferred to an electronic spreadsheet.
The average initial body weight of pigs used in the database was 48.6 kg (from 14.7 to 103.3 kg) while the average final body weight was 70.9 kg (from 22.3 to 127.5 kg). Average temperature in thermoneutral envi-ronments was 21.5 °C (from 18.3 to 25.0 °C) while it Table 1 – Empirical models predicting feed intake (y) of growing-finishing pigs from environmental temperature (T) and body weight (BW).
References and model labels Equations1 Sex BW T
kg °C
Massabie et al. (1996)
Massabie I y = –0.051 × T + 3.53 Barrows 25 -105 16 - 28
Massabie II y = –0.050 × T + 3.47 Barrows 25 -105 16 - 28
Massabie III y = –0.040 × T + 3.10 Gilts 25 -105 16 - 28
Massabie IV y = –0.037 × T + 2.96 Gilts 25 - 105 16 - 28
Rinaldo et al. (2000)
Rinaldo y = –0.228 × BW2 + 42.7 × BW + 260.3 Mixed 35 - 90 20 - 30
Quiniou et al. (2000)
Quiniou y = –0.26 × BW2 + 73.6 × BW – 2.40 × T2 + 117 × T – 0.95 × BW × T – 1264 Barrows 30 - 90 19 - 29
Collin et al. (2001)
Collin I y = 97.0 + 5.24 × (T – 19) – 0.132 × (T2 – 192) × BW0.83 Mixed 15.5 - 25 19 - 35
Collin II y = (96.0 + 0.500 – 2.75 log(1 + exp(T – 24.7)/0.5)) × BW0.83 Mixed 15.5 - 25 19 - 35
Renaudeau et al. (2011)
Renaudeau I y = –0.105 × BW2 + 58.7 × BW – 2.40 × T2+ 134 × T – 0.923 × BW × T – 1.33 Mixed 14 - 101.5 14 - 36
Renaudeau II y = 1.30 × BW – 0.215 × T2 + 10.1 × T – 0.045 × BW × T + 65.2 Mixed 14 - 101.5 14 - 36
Renaudeau III y = a × BW0.69 Mixed 14 - 101.5 14 - 36
NRC (2012)
NRC y = 111 × BW0.803 + 111 × BW0.803 × (LCT – T) × 0.025 Mixed 25 - 90 -1Models predicting feed intake in g d–1, except for the model Renaudeau II in which results are expressed in g d–1 kg–1 of BW0.60; Variables considered in the models:
was 31.3 °C (from 27.0 to 35.0 °C) in high-temperature environments. The relative air humidity was reported only in 21 articles, with an average value of 64 % (from 37 to 83 %).
Calculations and statistical procedures
The empirical models were used to generate FI estimates from observed data (pig body weight and envi-ronment temperature) presented on the database. Calcu-lations were performed individually for each treatment (i.e. environmental temperature) of the original publi-cation. Repeated-measures over time were considered when available. The observed FI data (results presented in the original publications) were then compared to the estimated FI values (predicted by each empirical model). Comparisons were performed by ANOVA using the Gen-eral Linear Model procedure (PROC GLM).
Evaluating the model accuracy implies the as-sessment of closeness between its estimates and the observed values in terms of trueness and precision (Benchaar et al., 1998; Pomar and Marcoux, 2003). In the current study, the observed FI responses (obtained from previously published papers) were compared to the values estimated by the empirical models for the
same scenario. Inputs for data modelling (i.e. tem-perature and body weight) were obtained in the pre-vious published papers. The overall lack of accuracy was evaluated by the magnitude of the mean squared prediction error (MSPE). The MSPE was then decom-posed, following the proposition described by Theil (1966), into error of central tendency (ECT), error of regression (ER), and error due to disturbances (ED). The trueness of a measurement indicates the degree of agreement between the expected and reference value. In this study, the lack of trueness (ECT + ER values) was evaluated as the systematic error, which could be easily corrected using linear regression. The lack of precision was evaluated in terms of random error (ED), which indicates the degree of internal agreement be-tween independent measurements made under specific conditions.
The Pearson correlations were calculated consid-ering observed and predicted values. Scatterplot graphs comparing these values were generated and analyzed jointly with linear regressions. In this regard, estimated FI values were regressed (PROC REG procedure) against observed FI values to determine the coefficient of deter-mination (R2), which indicated the goodness of fit.
Table 2 – Reference and description of studies included in the database.
References Temperature range Body weight Average daily feed intake
Initial Final
°C --- kg --- kg d–1
Batista et al. (2011) 22.7-34.2 30.0 58.3 1.92
Becker et al. (1992) 19.5-31.0 77.5 96.1 2.82
Campos et al. (2014) 24.0-30.0 54.4 64.0 2.43
Christon (1988) 21.0-32.0 40.7 64.1 1.76
Collin et al. (2001) 21.0-35.0 16.6 28.2 1.12
Ferreira et al. (2003) 22.0 15.0 30.2 1.19
Ferreira et al. (2005) 23.0 30.2 60.2 2.04
Ferreira et al. (2006) 32.3 15.2 29.9 1.09
Ferreira et al. (2007) 32.2 29.8 59.9 1.86
Kerr et al. (2005) 22.0-30.0 60.9 67.8 2.28
Kouba et al. (2001) 20.0-31.0 20.1 34.4 1.13
Le Bellego et al. (2002) 22.0-29.0 45.8 82.0 2.46
Le Bellego et al. (2002) 23.0-30.0 44.1 80.7 2.44
Lopez et al. (1991) 20.0-28.8 95.2 101.6 3.35
Lopez et al. (1994) 20.0-31.4 70.9 92.7 2.65
Manno et al. (2005) 22.7-34.2 15.0 30.0 1.06
Manno et al. (2006) 22.8-31.7 29.9 60.0 1.91
Moura et al. (2011) 30.0 69.2 88.6 1.66
Oliveira and Donzele (1999) 22.1-31.7 15.3 29.8 1.21
Rodrigues et al. (2012) 19.0-31.0 68.0 95.4 2.65
Sanches et al. (2010) 31.8 67.3 83.1 1.59
Sobrinho et al. (2013) 32.0 94.9 112.5 2.56
Song et al. (2011) 23.0 96.5 121.0 3.21
Stahly and Cromwell (1979) 22.5-35.0 34.7 67.6 1.83
Tavares et al. (2000) 21.3-32.0 30.6 60.0 2.03
Vaz et al. (2005) 21.8 15.1 29.9 1.15
Weller et al. (2013) 22.0-34.0 22.6 45.0 1.54
The statistical analyses were performed consider-ing two scenarios: (1) general population, in which the entire database (all observed data) was included in the analysis; or (2) reference population, in which the da-tabase was filtered in order to perform the simulation using only scenarios with environment (temperature range) and animals (body weight and sex) similar to that used in the models development. All statistical proce-dures were performed using SAS software (Statistical Analysis System, version 9.3).
Results and Discussion
Results obtained considering the general pop-ulation (Table 3) and the reference poppop-ulation (Ta-ble 4) were used to evaluate the models in terms of lack of accuracy, trueness, and precision. The models with the lowest errors were considered the
best predictors (Benchaar et al., 1998; Pomar and Marcoux, 2003).
Half of the evaluated models estimated FI val-ues similar (p > 0.05) to those observed in the general population. Comparing estimated and observed values in populations similar to those used for the model de-velopment (reference populations) was possible only for seven equations. Simulations were not performed for Massabie III and IV models due to the limited number of observed values in the population similar to the those used for the model development. The Renaudeau I, II, and III models were not tested in reference populations since these equations were obtained by meta-analysis.
The predicted FI from Massabie I, II and III mod-els were similar (p > 0.05) to the observed values in general population, while Massabie I and II produced estimates similar to the observed values in reference populations. Although Massabie IV estimated had lower
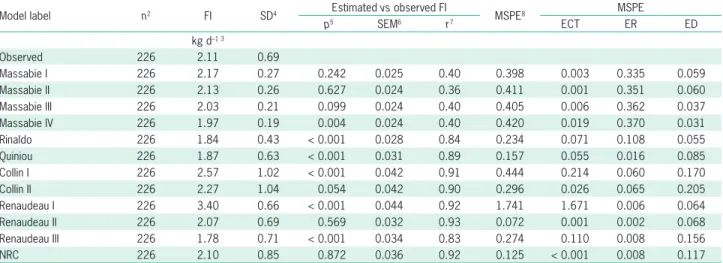
Table 3 – Agreement between the feed intake (FI) estimated by the empirical models and the observed values in the general population1.
Model label n2 FI SD4 Estimated vs observed FI MSPE8 MSPE
p5 SEM6 r7 ECT ER ED
kg d–1 3
Observed 226 2.11 0.69
Massabie I 226 2.17 0.27 0.242 0.025 0.40 0.398 0.003 0.335 0.059
Massabie II 226 2.13 0.26 0.627 0.024 0.36 0.411 0.001 0.351 0.060
Massabie III 226 2.03 0.21 0.099 0.024 0.40 0.405 0.006 0.362 0.037
Massabie IV 226 1.97 0.19 0.004 0.024 0.40 0.420 0.019 0.370 0.031
Rinaldo 226 1.84 0.43 < 0.001 0.028 0.84 0.234 0.071 0.108 0.055
Quiniou 226 1.87 0.63 < 0.001 0.031 0.89 0.157 0.055 0.016 0.085
Collin I 226 2.57 1.02 < 0.001 0.042 0.91 0.444 0.214 0.060 0.170
Collin II 226 2.27 1.04 0.054 0.042 0.90 0.296 0.026 0.065 0.205
Renaudeau I 226 3.40 0.66 < 0.001 0.044 0.92 1.741 1.671 0.006 0.064
Renaudeau II 226 2.07 0.69 0.569 0.032 0.93 0.072 0.001 0.002 0.068
Renaudeau III 226 1.78 0.71 < 0.001 0.034 0.83 0.274 0.110 0.008 0.156
NRC 226 2.10 0.85 0.872 0.036 0.92 0.125 < 0.001 0.008 0.117
1General population = all observed data were used in the simulation; 2n = Number of estimates or observations; 3Feed intake was estimated individually for each
treatment (i.e. environmental temperature) of the original publication; 4SD = Standard deviation; 5p = Probability comparing estimated and observed values (F test); 6SEM = Standard error of the mean; 7Correlation between estimated and observed values; 8MSPE = mean squared prediction error; composed by ECT = error of
central tendency; ER = error of regression; and ED = error due to disturbances.
Table 4 – Agreement between the feed intake (FI) estimated by the empirical models and the observed values in each reference population1.
Model label n2 Observed FI Estimated FI Estimated vs observed FI MSPE8 MSPE
Mean SD3 Mean SD p5 SEM6 r7 ECT ER ED
kg d–1 kg d–14
Massabie I 38 2.43 0.47 2.44 0.07 0.865 0.038 0.45 0.196 < 0.001 0.192 0.004 Massabie II 38 2.43 0.47 2.34 0.18 0.280 0.041 -0.03 0.266 0.008 0.227 0.031 Rinaldo 148 2.25 0.50 1.99 0.26 < 0.001 0.024 0.62 0.229 0.068 0.120 0.041
Quiniou 40 2.31 0.43 2.09 0.32 0.010 0.044 0.89 0.094 0.051 0.023 0.020
Collin I 42 1.13 0.12 1.15 0.15 0.597 0.015 0.78 0.009 < 0.001 < 0.001 0.009 Collin II 42 1.13 0.12 1.01 0.30 0.021 0.025 0.73 0.064 0.013 0.009 0.041 NRC 150 2.24 0.51 2.23 0.68 0.871 0.035 0.83 0.149 < 0.001 0.003 0.146
1Reference population = data were filtered in order to simulate using only scenarios with environment (temperature range) and animals (body weight and sex) similar
to that used in the model development; 2n = Number of estimates or observations; 3SD = Standard deviation; 4Feed intake was estimated individually for each
treatment (i.e. environmental temperature) of the original publication; 5p = Probability comparing estimated and observed values (F test); 6SEM = Standard error of
the mean; 7Correlation between estimated and observed values; 8MSPE = mean squared prediction error; composed by ECT = error of central tendency; ER = error
(–7 %, p < 0.05) FI compared to observed values in gen-eral population database, this equation presented the highest precision (i.e., lowest ED = 0.031) among all studied models in this general scenario. Applying the Massabie models to the reference population generated best estimates in terms of accuracy (MSPE = -0.202 and -0.145, respectively for Massabie I and II), precision (ED = -0.055 and -0.029), and trueness (ECT + ER = –0.145 and -0.117) than applying the same models in general database. The ER accounted for most of the error in both simulations (general and reference populations) per-formed with Massabie models, which may be partially explained by the linearity of the models. In addition, body weight was not accounted in the Massabie models, even though the effects of temperature on animal per-formance are usually age-dependent (Bruce and Clark, 1979). Another particularity of these models is that pigs used in the model development were exposed to differ-ent temperature levels during the whole growing-period. The FI estimates from the Rinaldo model were lower (p < 0.05) than the observed FI in general (–3 %) and reference populations (–12 %). Applying this model to the reference population generated similar accuracy (MSPE = –0.005), precision (ED = -0.014), and trueness (ECT + ER = 0.009) than applying it in general data-base. Most lack of accuracy of the Rinaldo model was due to the lack of trueness, which may be related to the temperature variation interval (20 to 30 °C) or the tropi-cal humidity condition used for the model development (Rinaldo et al., 2000).
The Quiniou model estimates were lower (p < 0.05) than the observed FI in general (–11 %) and refer-ence populations (–10 %). Using the referrefer-ence popula-tion improved accuracy (MSPE = -0.063) and precision (ED = –0.065), but worsened trueness (ECT + ER = 0.003) compared to using the model in general popula-tion. It is important to address that housing conditions used to generate the model (respiratory chambers) were
not considered when filtering the database (to obtain the reference population) due to the lack of available infor-mation. The accuracy of the model was limited by ED when applied to general population, while trueness was the limiting factor when applied to reference population. The Collin I model estimated higher (+22 %, p < 0.05) FI compared to observed values in general database. When applied to reference population, the FI values predicted by Collin I were similar (p > 0.05) to the observed values. The estimates from Collin II model were similar (p > 0.05) to the observed values in the general population, while lower (–11 %; p < 0.05) esti-mates than the observed values were obtained in refer-ence population. Applying Collin I and II models to ref-erence population improved accuracy (MSPE = –0.435 and –0.232, respectively for Collin I and II), precision (ED = –0.161 and –0.164), and trueness (ECT + ER = –0.272 and –0.069) comparing to the use in the general population. These improvements were particularly rel-evant for Collin I model and are probably because both models were developed using young pigs and short-term challenge. When applied to general database, the models did not completely estimate FI variation (ED, by defini-tion) observed in heavier pigs.
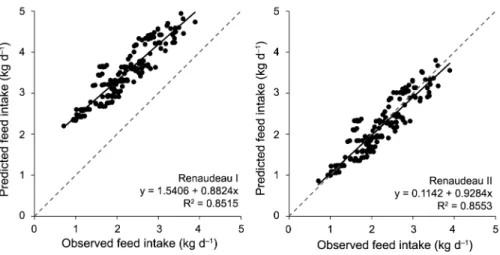
The estimates from Renaudeau I and III models differed from observed FI in the general database (mod-el I, + 61 %; mod(mod-el III, –16 %; p < 0.05). However, the estimates from Renaudeau II model were similar (p > 0.05) to the observed values. The Renaudeau II model showed the lowest MSPE among all tested mod-els, while both Renaudeau models showed the lowest ER. The Renaudeau II model showed also the lowest ECT among other Renaudeau models. The importance of ECT may be observed in Figure 1, in which the graph-ical comparison between estimates from Renaudeau I and II models is presented. Renaudeau III model showed higher ED (0.156) than Renaudeau I and II mod-els (0.064 and 0.068, respectively). Unlike the equations
presented earlier, the Renaudeau models were obtained by meta-analysis and fitted using variance-covariance components, which is recommended to obtain higher accuracy (St-Pierre, 2001). Therefore, it was expected that estimates from these models would be closer to the general population, as the modelling procedure took into account the variability among studies, and conse-quently, among different population scenarios.
The FI estimated by the NRC model was similar (p > 0.05) to the observed values in general and ref-erence populations. This model presented close MSPE (+0.024), ECT (+0.029), ER (-0.005), and the same ED values when applied in general or reference databases, which indicated that the model consistently predicted FI for both populations. The NRC model showed the low-est ECT among tlow-ested models. Although MSPE values were lower compared to most studied models, the major participant in the lack of accuracy of NRC model was the random error (i.e. ED), which is difficult to correct.
The models collected in literature to estimate FI based on independent variables (body weight, tempera-ture) presented linear, exponential, and logarithmic fits. The Renaudeau III model includes parameter α, which describes a negative relation between body weight and FI when the environmental temperature exceeds maxi-mum comfort temperature (upper critical temperature). Some authors reported FI reduction from 40 to 80 g d–1
for each 1 °C increase in environmental temperature (Quiniou et al., 2000; Renaudeau et al., 2011). Linear and quadratic fits estimate a constant rate of FI decrease as temperature and body weight increase. The NRC model also considered the critical temperature, which is affected by body weight. In this model, the deviations below the lower critical temperature and above the up-per critical temup-perature (in other words, when comfort temperature is not met) affect pig heat metabolism (pro-duction or loss) and FI.
The diversity on experimental characteristics (i.e. other than the aspects considered in the filtering to gen-erate the reference population) may have contributed to the high ED values observed for some models. One of the most important factors to be considered in the de-velopment of new models is the adaptation period, since several studies have shown that FI decreases during the first days of exposure to high temperature, but the pigs tend to recover their FI capacity afterwards (Renaudeau et al., 2008; Renaudeau et al., 2010). Therefore, it is not possible to perfectly describe the FI pattern of pigs in the short and long-term stress using only body weight and temperature in the modelling procedures (Whitte-more et al., 2001; Renaudeau et al., 2011). Moreover, the susceptibility to temperature effects and time required for recovery may vary among individuals of a given pop-ulation, which may reduce the precision of the models (Wellock et al., 2003). The use of modelling procedures that consider the variability among animals in the popu-lations challenged by high environmental temperatures (i.e. stochastic approach) would be a major step forward
for this area. Therefore, future research projects should be planned to provide the required information for the development of powerful mathematical models, which allow accurate FI estimates for pigs reared under high environmental temperatures, allowing precision feeding strategies to be applied in the field.
Acknowledgments
To São Paulo Research Foundation – FAPESP (Proj-ect n° 2012/03781-0), Coordination for the Improvement of Higher Level Personnel – CAPES, and Brazilian Na-tional Council for Scientific and Technological Develop-ment – CNPq for financial support.
References
Batista, R.M.; Oliveira, R.F.M.; Donzele, J.L.; Oliveira, W.P.; Lima, A.L.; Abreu, M.L.T. 2011. Digestible lysine levels for high lean disposition barrows from 30 to 60 kg kept under heat stress. Revista Brasileira de Zootecnia 40: 1925-1932 (in Portuguese, with abstract in English).
Becker, B.A.; Knight, C.D.; Buonomo, F.C.; Jesse, G.W.; Hedrick, H.B.; Baile, C.A. 1992. Effect of a hot environment on performance, carcass characteristics, and blood hormones and metabolites of pigs treated with porcine somatotropin. Journal of Animal Science 70: 2732-2740.
Benchaar, C.; Rivest, J.; Pomar, C.; Chiquette, J. 1998. Prediction of methane production from dairy cows using existing mechanistic models and regression equations. Journal of Animal Science 76: 617-627.
Bruce, J.; Clark, J. 1979. Models of heat production and critical temperature for growing pigs. Animal Production 28: 353-369. Campos, P.H.R.F.; Noblet, J.; Jaguelin-Peyraud, Y.; Gilbert, H.;
Mormède, P.; Oliveira, R.F.M.; Donzele, J.L.; Renaudeau, D. 2014. Thermoregulatory responses during thermal acclimation in pigs divergently selected for residual feed intake. International Journal of Biometeorology 58: 1545-1557. Christon, R. 1988. The effect of tropical ambient temperature on
growth and metabolism in pigs. Journal of Animal Science 66: 3112-3123.
Collin, A.; Noblet, J.; van Milgen, J.; Dubois, S.; Le Dividich, J. 2001. Effect of high ambient temperature on feed intake, performance and heat production in piglets. Journées de la Recherche Porcine 33: 9-16 (in French, with abstract in English).
Ferreira, R.A.; Oliveira, R.F.M.; Donzele, J.L.; Araújo, C.V.; Silva, F.C.O.; Fontes, D.O.; Saraiva, E.P. 2005. Reduction of crude protein levels of ration with amino acid supplementation to castrated swine maintained in a termoneutral environment from 30 to 60 kg. Revista Brasileira de Zootecnia 34: 548-556 (in Portuguese, with abstract in English).
Ferreira, R.A., Oliveira, R.F.M.; Donzele, J.L.; Lopes, D.C.; Orlando, U.A.D.; Resende, W.O.; Vaz, R.G.M.V. 2003. Reduction of crude protein level of ration to castrated swine from 15 to 30 kg maintained in a termoneutral environment (22 °C). Revista Brasileira de Zootecnia 32: 1639-1646 (in Portuguese, with abstract in English).
Ferreira, R.A.; Oliveira, R.F.M.; Donzele, J.L.; Saraiva, E.P.; Silva, F.C.O.; Orlando, U.A.D.; Vaz, R.G.M.V. 2007. Reduction of dietary crude protein levels and amino acid supplementation for 30 to 60 kg barrows maintained in a high environmental temperature. Revista Brasileira de Zootecnia 36 : 818-824 (in Portuguese, with abstract in English).
Kerr, C.A.; Giles, L.R.; Jones, M.R.; Reverter, A. 2005. Effects of grouping unfamiliar cohorts, high ambient temperature and stocking density on live performance of growing pigs. Journal of Animal Science 83: 908-915.
Kouba, M.; Hermier, D.; Le Dividich, J. 2001. Influence of a high ambient temperature on lipid metabolism in the growing pig. Journal of Animal Science 79: 81-87.
Kyriazakis, I.; Whittemore, C.T. 2006. Wittemore’s Science and Practice of Pig Production. 3ed. Blackwell, Oxford, UK. Le Bellego, L.; van Milgen, J.; Noblet, J. 2002. Effect of high
temperature and low-protein diets on the performance of growing-finishing pigs. Journal of Animal Science 80: 691-701.
Lopez, J.; Goodband, R.D.; Allee, G.L.; Jesse, G.W.; Nelssen, J.L.; Tokach, M.D.; Spiers, D.; Becker, B.A. 1994. The effects of diets formulated on an ideal protein basis on growth performance, carcass characteristics, and thermal balance of finishing gilts housed in a hot, diurnal environment. Journal of Animal Science 72: 367-379.
Lopez, J.; Jesse, G.W.; Becker, B.A.; Ellersieck, M.R. 1991. Effects of temperature on the performance of finishing swine. I. Effects of a hot, diurnal temperature on average daily gain, feed intake, and feed efficiency. Journal of Animal Science 69: 1843-1849.
Manno, M.C.; Oliveira, R.F.M.; Donzele, J.L.; Ferreira, A.S.; Oliveira, W.P.; Lima, K.R.S.; Vaz, R.G.M.V. 2005. Effect of thermal environment on performance of growing pigs from 15 to 30 kg. Revista Brasileira de Zootecnia 34: 1963-1970 (in Portuguese, with abstract in English).
Manno, M.C.; Oliveira, R.F.M.; Donzele, J.L.; Oliveira, W.P.; Vaz, R.G.M.V.; Silva, B.A.N.; Saraiva, E.P.; Lima, K.R.S. 2006. Effects of environmental temperature on performance of pigs from 30 to 60 kg live weight. Revista Brasileira de Zootecnia 35: 471-477 (in Portuguese, with abstract in English). Massabie, P.; Granier, R.; Le Dividich, J. 1996. Effect of ambient
temperature on zootechnical performance of growing-finishing pigs fed ad libitum = Influence de la température ambiante sur les performances zootechniques du porc à l’engrais alimenté ad libitum. Journées de la Recherche Porcine 28: 189-194 (in French, with abstract in English). Moura, M.S.; Kiefer, C.; Silva, C.M.; Santos, A.P.; Fantini, C.C.;
Lucas, L.S. 2011. Net energy and ractopamine to finishing gilts under high temperature environment. Ciência Rural 41: 888-894 (in Portuguese, with abstract in English).
National Research Council [NRC]. 2012. Nutrient Requirements of Swine. National Academies Press, Washington, DC, USA.
Noblet, J.; van Milgen, J. 2004. Energy value of pig feeds: effect of pig body weight and energy evaluation system. Journal of Animal Science 82: E229-E238.
Oliveira, R.F.M.; Donzele, J.L. 1999. Effect of environmental temperature on performance and on physiological and hormonal parameters of gilts fed at different levels of digestible energy. Animal Feed Science and Technology 81: 319-331.
Pomar, C.; Harris, D.L.; Minvielle, F. 1991. Computer simulation model of swine production systems. I. Modeling the growth of young pigs. Journal of Animal Science 69: 1468-1488. Pomar, C.; Hauschild, L.; Zhang, G.H.; Pomar, J.; Lovatto, P.A.
2011. Precision feeding can significantly reduce feeding cost and nutrient excretion in growing animals. p. 327-334. In: Sauvant D.; Milgen, J.; Faverdin, P.; Friggens, N., eds. Modelling nutrient digestion and utilisation in farm animals. Wageningen Academic, Wageningen, The Netherlands. Pomar, C.; Marcoux, M. 2003. Comparing the Canadian pork lean
yields and grading indexes predicted from grading methods based on Destron and Hennessy probe measurements. Canadian Journal of Animal Science 83: 451-458.
Quiniou, N.; Dubois, S.; Noblet, J. 2000. Voluntary feed intake and feeding behaviour of group-housed growing pigs are affected by ambient temperature and body weight. Livestock Production Science 63: 245-253.
Renaudeau, D.; Anais, C.; Tel, L.; Gourdine, J.L. 2010. Effect of temperature on thermal acclimation in growing pigs estimated using a nonlinear function. Journal of Animal Science 88: 3715-3724.
Renaudeau, D.; Gourdine, J.L.; St-Pierre, N. 2011. A meta-analysis of the effects of high ambient temperature on growth performance of growing-finishing pigs. Journal of Animal Science 89: 2220-2230.
Renaudeau, D.; Kerdoncuff, M.; Anais, C.; Gourdine, J. 2008. Effect of temperature level on thermal acclimation in Large White growing pigs. Animal 2: 1619-1626.
Rinaldo, D.; Le Dividich, J.; Noblet, J. 2000. Adverse effects of tropical climate on voluntary feed intake and performance of growing pigs. Livestock Production Science 66: 223-234. Rodrigues, N.E.B.; Tadeu Filho, E.; Zangeronimo, M.G.;
Cantarelli, V.S.; Rodrigues, P.B.; Rodrigues Filho, M.; Gomide, E.M.; Betarelli, R.P. 2012. Reduction in the protein level and addition of oil in diets for finishing pugs under different temperatures. Revista Brasileira de Zootecnia 41: 1878-1883. Sanches, J.F.; Kiefer, C.; Carrijo, A.S.; Moura, M.S.; Silva, E.A.;
Santos, A.P. 2010. Ractopamine levels for finishing barrows maintained in heat stress. Revista Brasileira de Zootecnia 39: 1523-1529 (in Portuguese, with abstract in English).
Sobrinho, D.C.S.; Oliveira Jr., G.M.; Roner, M.N.B.; Ferreira, A.S.; Oliveira, A.G.; Santos, W.G.; Gomide, A.P.C.; Morais, J.A.S. 2013. Digestible lysine levels for barrows housed in ambient of heat stress from 95 to 115 kg of weight. Revista Brasileira de Saúde e Produção Animal 14: 546-557 (in Portuguese, with abstract in English).
Stahly, T.S.; Cromwell, G.L. 1979. Effect of environmental temperature and dietary fat supplementation on the performance and carcass characteristics of growing and finishing swine. Journal of Animal Science 49: 1478-1488. St-Pierre, N.R. 2001. Invited review: integrating quantitative
findings from multiple studies using mixed model methodology. Journal of Dairy Science 84: 741-755.
Tavares, S.L.S.; Donzele, J.L.; Oliveira, R.F.M.; Ferreira, A.S. 2000. Influence of environment temperature on the performance and the physiological traits of barrows from 30 to 60 kg. Revista Brasileira de Zootecnia 29: 199-205 (in Portuguese, with abstract in English).
Theil, H. 1966. Applied Economic Forecasting. North Holland, Amsterdam, The Netherlands.
Vaz, R.G.M.V.; Oliveira, R.F.M.; Donzele, J.L.; Ferreira, A.S.; Brustolini, P.C.; Kiefer, C.; Orlando, U.A.D. 2005. Digestible sulphurous aminoacid requirement for swine barrows maintained in a thermoneutral environment from 15 to 30 kg. Arquivo Brasileiro de Medicina Veterinária e Zootecnia 57: 345-352 (in Portuguese, with abstract in English).
Weller, M.M.D.C.A.; Alebrante, L.; Campos, P.H.R.F.; Saraiva, A.; Silva, B.A.N.; Donzele, J.L.; Guimarães, S.E.F. 2013. Effect of heat stress and feeding phosphorus levels on pig electron transport chain gene expression. Animal 7: 1985-1993. Wellock, I.; Emmans, G.; Kyriazakis, I. 2003. Predicting the
consequences of social stressors on pig food intake and performance. Journal of Animal Science 81: 2995-3007. Wellock, I.; Emmans, G.; Kyriazakis, I. 2004. Modeling the effects
of stressors on the performance of populations of pigs. Journal of Animal Science 82: 2442-2450.
Whittemore, C.T.; Green, D.M.; Knap, P.W. 2001. Technical review of the energy and protein requirements of growing pigs: protein. Animal Science 73: 363-373.
Whittemore, C.T.; Kerr, J.; Cameron, N. 1995. An approach to prediction of feed intake in growing pigs using simple body measurements. Agricultural Systems 47: 235-244.