71 Radiol Bras. 2018 Mar/Abr;51(2):71–75
Magnetic resonance imaging: dynamic contrast enhancement
and diffusion-weighted imaging to identify malignant cervical
lymph nodes
Uso do contraste dinâmico e da sequência de difusão em ressonância magnética na identificação de linfonodos cervicais malignos
Murilo Bicudo Cintra1, Hilton Ricz2, Mahmood F. Mafee3, Antonio Carlos dos Santos4
Cintra MB, Ricz H, Mafee MF, Santos AC. Magnetic resonance imaging: dynamic contrast enhancement and diffusion-weighted imaging to identify malignant cervical lymph nodes. Radiol Bras. 2018 Mar/Abr;51(2):71–75.
Abstract
Resumo
Objective: To examine the potential of two magnetic resonance imaging (MRI) techniques—dynamic contrast enhancement (DCE) and diffusion-weighted imaging (DWI)—for the detection of malignant cervical lymph nodes.
Materials and Methods: Using DCE and DWI, we evaluated 33 cervical lymph nodes. For the DCE technique, the maximum relative enhancement, relative enhancement, time to peak enhancement, wash-in rate, wash-out rate, brevity of enhancement, and area un-der the curve were calculated from a semi-quantitative analysis. For the DWI technique, apparent diffusion coefficients (ADCs) were acquired in the region of interest of each lymph node. Cystic or necrotic parts were excluded. All patients underwent neck dissection or node biopsy. Imaging results were correlated with the histopathological findings. None of the patients underwent neoadjuvant treat -ment before neck dissection.
Results: Relative enhancement, maximum relative enhancement, and the wash-in rate were significantly higher in malignant lymph nodes than in benign lymph nodes (p < 0.009; p < 0.05; and p < 0.03, respectively). The time to peak enhancement was significantly
shorter in the malignant lymph nodes (p < 0.02). In the multivariate analysis, the variables identified as being the most capable of distinguishing between benign and malignant lymph nodes were time to peak enhancement (sensitivity, 73.7%; specificity, 69.2%) and relative enhancement (sensitivity, 89.2%; specificity, 69.2%).
Conclusion: Although DCE was able to differentiate between benign and malignant lymph nodes, there is still no consensus regarding the use of a semi-quantitative analysis, which is difficult to apply in a clinical setting. Low ADCs can predict metastatic disease, although inflammatory processes might lead to false-positive results.
Keywords: Lymph nodes/diagnostic imaging; Lymphatic metastasis/diagnostic imaging; Magnetic resonance imaging/methods; Diffu -sion magnetic resonance imaging.
Objetivo: Examinar o potencial das imagens de contraste dinâmico (DCE-MRI) e difusão (DW-MRI) em ressonância magnética na detecção de linfonodos cervicais malignos.
Materiais e Métodos: Foram realizadas DCE-MRI e DW-MRI em 33 linfonodos cervicais. Os valores de realce relativo máximo, realce relativo, tempo de pico, taxa de realce e lavagem, brevidade do realce e área sob a curva foram avaliados pela análise semiquantitativa (DCE-MRI). Os coeficientes de difusão aparente na DW-MRI foram obtidos na área de interesse. Foram excluídas partes císticas ou ne -cróticas dos nódulos. Todos os pacientes foram submetidos a dissecção cervical ou a biópsia. Os resultados de imagem foram corre-lacionados com os achados patológicos. Nenhum paciente foi submetido a tratamento neoadjuvante antes da dissecção do pescoço.
Resultados: Realce relativo, realce relativo máximo e taxa de realce aumentaram nos nódulos malignos (p < 0,009, p < 0,05 e p < 0,03, respectivamente). O tempo de pico foi reduzido nos nódulos malignos (p < 0,02). A análise multivariada identificou tempo de pico (sensibilidade, 73,7%; especificidade, 69,2%) e realce relativo (sensibilidade, 89,2%; especificidade, 69,2%) como variáveis capazes de distinguir os nódulos benignos e malignos.
Conclusão: Embora o DCE-MRI possa diferenciar os nódulos benignos e malignos, ainda não há consenso sobre a técnica de análise semiquantitativa, em razão de dificuldade de aplicação clínica. Valores baixos do coeficiente de difusão aparente podem predizer nó -dulo metastático, mas devem-se considerar também resultados falso-positivos, provavelmente secundários ao processo inflamatório. Unitermos: Linfonodos/diagnóstico por imagem; Metástase linfática/diagnóstico por imagem; Ressonância magnética/métodos; Di -fusão por ressonância magnética.
Study conducted in the Radiology Division of the Department of Internal Medi-cine, Faculdade de Medicina de Ribeirão Preto da Universidade de São Paulo (FMRP--USP), Ribeirão Preto, SP, Brazil.
1. MD, PhD, Head and Neck Radiology, Radiology Division, Department of In -ternal Medicine, Faculdade de Medicina de Ribeirão Preto da Universidade de São Paulo (FMRP-USP), Ribeirão Preto, SP, Brazil.
2. MD, PhD, Professor of Head and Neck Surgery, Faculdade de Medicina de Ribeirão Preto da Universidade de São Paulo (FMRP-USP), Ribeirão Preto, SP, Brazil.
3. MD, FACR, University of California San Diego (UC San Diego) Health System in La Jolla, San Diego, CA, USA.
4. MD, PhD, Professor of Neuroradiology, Faculdade de Medicina de Ribeirão Preto da Universidade de São Paulo (FMRP-USP), Ribeirão Preto, SP, Brazil.
Mailing address: Dr. Murilo Bicudo Cintra. FMRP-USP, Divisão de Radiologia, De-partamento de Clínica Médica. Avenida Bandeirantes, 3900, Monte Alegre. Ribeirão Preto, SP, Brazil, 14048-900. E-mail: [email protected].
INTRODUCTION
Malignant cervical lymph nodes constitute a negative prognostic indicator in the treatment of head and neck
cancer(1–4). Therefore, early detection of malignant lymph
nodes plays a crucial role in the clinical management and prognosis of head and neck cancer. The development of noninvasive imaging biomarkers for use in treatment plan-ning has the potential to improve treatment strategies.
Anatomical imaging techniques such as ultrasound, enhanced computed tomography, and contrast-enhanced magnetic resonance imaging (MRI) are capable
of detecting enlarged lymph nodes(5–8), particularly in the
cervical chains. However, such techniques are less
sensi-tive for identifying malignancy in some cases(9). Although
ultrasound-guided fine needle aspiration biopsy of lymph
nodes is capable of detecting malignancy, it is an invasive method that is operator-dependent and has a high rate of false-negative results(10).
In this study, we propose a novel method of MRI incorporating anatomical and vascular information to improve the evaluation of lymph nodes. The addition of diffusion-weighted imaging (DWI)—to determine the
ap-parent diffusion coefficient (ADC)—and dynamic contrast enhancement (DCE)—to quantify perfusion and vascu -larity—allows metastatic (malignant) lymph nodes to be distinguished from reactive (benign) lymph nodes. Our objective was to assess the ability of such methods to dif-ferentiate between benign and malignant lymph nodes.
MATERIALS AND METHODS
This was a prospective study in which patients un-der clinical suspicion of having head and neck cancer or
patients with biopsy-confirmed cancer in the initial stag -ing were recruited between August 2013 and October 2014. Patients who had undergone surgery of the head or neck, chemotherapy, or radiation therapy were excluded. All patients were screened for malignant cervical lymph nodes by an experienced head and neck neuroradiologist. The study was approved by the local institutional review board, and all participating patients gave written informed consent.
Data acquisition
All MRI scans were acquired in a 3 T scanner (Achieva; Philips Medical Systems, Best, The Netherlands), with a phased-array neck coil. The MRI protocol included the
following: three-dimensional (3D) T1-weighted images—
repetition time/echo time (TR/TE) = 7.2/3.3 ms; field of view (FOV) = 240 mm; voxel size = 1.0 × 1.0 × 1.0 mm; slice thickness = 1 mm; and flip angle (FA) = 8°; 3D
T2-weighted images—TR/TE = 2500/304 ms; FOV = 240
mm; voxel size = 1.0 × 1.0 × 1.0 mm; section thickness = 1 mm; and FA = 90°; DWI sequences—TR/TE = 5174/55
ms; FOV = 222 mm; voxel size = 1.39 × 1.58 × 2.00 mm;
section thickness = 2 mm; FA = 8°; directions = 4; and b values = 500 and 1000 s/mm2. In addition, we acquired DCE images using a 3D fast spoiled gradient-echo se
-quence with the following parameters: FOV = 300 mm; section thickness = 2 mm; gap = 1 mm; FA = 12°; TR/TE = 5.5/2.3 ms; voxel size = 0.9 × 0.99 × 2.0 mm; scan dura
-tion = 5 min. Using that protocol, we acquired non-con -trast-enhanced images in 13 dynamic acquisitions. For contrast-enhanced images, patients received a single dose of gadodiamide (Gd-DTPA-BMA, Omniscan; Nycomed, Oslo, Norway) injected into the antecubital vein at a con-centration of 0.1 mmol/kg body weight and at a rate of 2
mL/s, followed by a saline flush, both administered with a power injector (Spectris; Medrad, Indianola, PA, USA).
Twelve dynamic acquisitions were performed during and after the injection.
Imaging processing
Images were processed on a workstation (Philips Ex
-tended MR Workspace 2.6.3.5; Philips Medical Systems).
Lymph nodes located in tumor drainage cervical chains were chosen, and a region of interest (ROI) was drawn
on the solid portion of each node, for DWI and DCE. A head and neck radiologist with 5 years of experience de -lineated the ROIs, using T2-weighted, T1-weighted, or contrast-enhanced T1-weighted images. Necrotic, cystic, and hemorrhagic portions of the nodes were excluded. Single nodes and larger node masses were included. For DWI, the positioning of the ROI was determined by visual
identification of the lowest signal on the ADC map(11). For
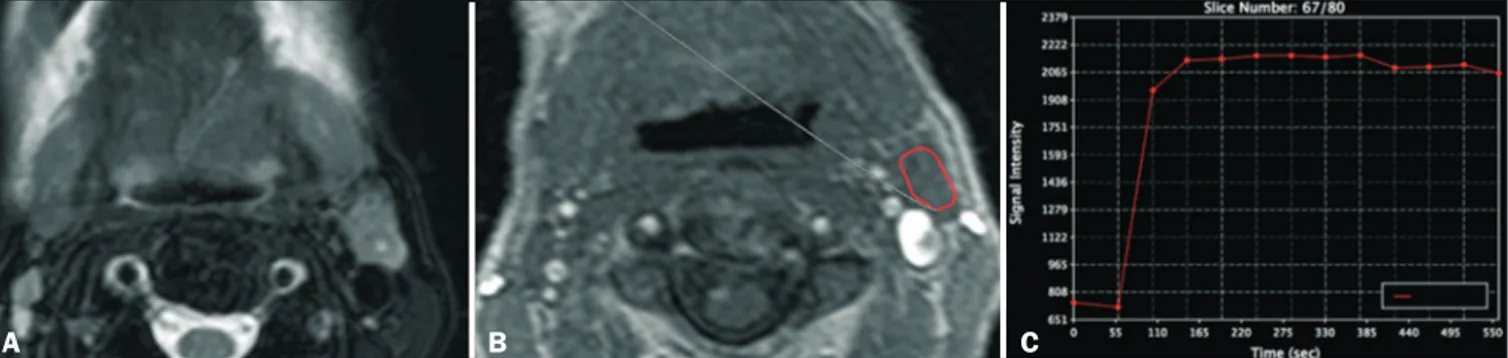
DCE acquisitions (Figure 1), time-signal intensity curves
were generated for each lymph node ROI and the fol-lowing parameters were evaluated: maximum relative
en-hancement (MRE); relative enen-hancement (RE); time to
peak enhancement, hereafter simply time to peak (TTP); wash-in rate (WiR); wash-out rate (WoR); brevity of
en-hancement (BrevE); and area under the curve (AUC).
Statistical analyses
All statistical analyses were performed with the IBM SPSS Statistics software package, version 22.0 for
Win-dows (IBM Corporation, Armonk, NY, USA). The
Shapiro-Wilk test showed that the data were not normally
distrib-uted. After correlation with histopathology, we analyzed
two groups of data: malignant and benign lymph nodes.
The Mann-Whitney U test was used in order to compare
the benign and malignant groups. Values of p < 0.05 were
considered significant. To identify further relationships among RE, TTP, WiR, and MRE, multivariate analysis (bi -nary logistic regression) was applied. In that analysis, TTP
and RE were the parameters found to be most capable of
differentiating between malignant and benign nodes. We
RESULTS
Our study sample comprised 19 patients (mean age, 55–68 years; 12 males and 7 females) with 33 lymph nodes
(Table 1). The diameter of the lymph nodes ranged from
0.7 cm to 6.8 cm (mean, 2.2 cm). Thirteen (39.4%) of the lymph nodes were benign, and 20 (60.6%) were malignant. The malignant lesions were confirmed by histopathology following surgical removal in 25 (75%) of the nodes and by fine needle aspiration biopsy alone in 8 (25%).
Malignant and benign lymph nodes both showed low
mean ADCs (0.786 ± 0.152 × 10⁻³ mm2/s and 0.790 ± 0.173 × 10⁻³ mm2/s, respectively). However, the differ-ence was not statistically significant. No statistically sig
-nificant differences were found among the ADC, WoR, BrevE, and AUC values in terms of their capacity to differ
-entiate between malignant and benign lymph nodes. From
the DCE images (Tables 2 and 3), we determined that the malignant lymph nodes presented significantly higher RE
(p < 0.009), MRE (p < 0.05) and WiR (p < 0.03), whereas
they presented significantly shorter TTP (p < 0.02). In the multivariate analysis, the differences between the values obtained for benign nodes and those obtained for
malig-nant nodes remained significant for TTP and RE.
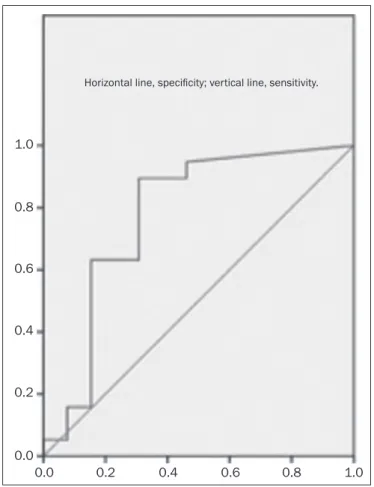
In the ROC curve analysis, the TTP cut-off value for malignant lymph node detection was 189.45 s. The TTP for the malignant nodes was significantly lower than
was that determined for the benign nodes. The
sensitiv-ity and specificsensitiv-ity of the TTP cut-off value to differentiate between benign and malignant lymph nodes were 73.7% and 69.2%, respectively (Figure 2). According to the ROC curve analysis, the RE cut-off value for malignant lymph node detection was 21.9%. The RE for the malignant nodes was significantly higher than was that determined for the benign nodes. The sensitivity and specificity of the Table 1—Demographic characteristics of the patients and histological
diagno-sis. Patient 1 2 3 4 5 6 7 8 9 10 11 12 13 14 15 16 17 18 19 Gender Male Male Female Female Male Female Male Male Female Male Female Male Male Female Male Male Female Male Male Age (years) 40 14 33 42 31 33 91 49 91 68 56 81 12 57 82 77 54 63 75 Diagnosis
Metastatic oropharyngeal SCC Metastatic nasopharyngeal carcinoma
Submandibular neuroendocrine carcinoma
Laryngeal SCC
Lesion of cervical muscle/IgG4-related disease
Inflammatory process Cutaneous SCC Nasopharyngeal carcinoma
Frontal skin SCC Laryngeal SCC Inflammatory process Undifferentiated carcinoma
Inflammatory process Pyriform sinus carcinoma
Melanoma Undifferentiated carcinoma
Inflammatory process Hypopharyngeal SCC Nonspecific inflammatory process
Number of nodes 1 1 1 2 2 3 1 2 1 2 2 2 2 2 3 1 1 2 2
SCC, squamous cell carcinoma; IgG4, immunoglobulin G4.
Table 3—Main DCE parameters, by group.
Group
Benign lymph nodes
Malignant lymph nodes
Total Values Mean N SD Mean N SD Mean N SD RE (%) 41.3 10 75.49 95.67 17 61.406 75.53 27 70.774 MRE (SI) 392.38 13 216.161 594.74 18 363.805 509.88 31 322.481 TTP (s) 199.98 12 73.387 146.47 18 71.799 167.88 30 75.998 WiR (L/s) 14.57 9 8.501 21.15 19 12.374 19.03 28 11.546
SI, signal intensity; SD, standard deviation.
Table 2—DCE parameters in the malignant and benign groups.
Group
Malignant lymph nodes Benign lymph nodes P-value N 19 13 TTP (s) Median (SD) 141 (73) 207 (75) 0.02 RE (%) Median (SD) 97 (61) 38 (67) 0.009 MRE (%) Median (SD) 598 (353) 392 (216) 0.05 WiR (L/s) Median (SD) 21 (12) 13 (8) 0.03
SD, standard deviation.
Figure 1. DCE MRI scan of a 72-year-old male patient with left oral tongue squamous cell carcinoma. A T2-weighted image (A) shows a stage IIa malignant lymph node, with a small necrotic center. The image on B shows the ROI (red outline) in the node during the DCE sequence. The image on C shows the time–signal intensity curve for the corresponding node.
B
RE cut-off value to differentiate between benign and ma
-lignant lymph nodes were 89.2% and 69.2%, respectively
(Figure 3).
DISCUSSION
No statistically significant differences were found among the ADC, WoR, BrevE, and AUC values in terms of
their capacity to differentiate between malignant and
be-nign lymph nodes. From the DCE images, we determined that the RE, MRE, and WiR were significantly higher in malignant lymph nodes, whereas the TTP was significantly
shorter. The multivariate analysis showed that the TTP
and RE differed significantly between benign and malig -nant nodes.
DCE
Others studies involving DCE have suggested that it
can be a useful tool to differentiate between benign and
malignant tumors(12), as well as between benign and
malig-nant lymph nodes(13). However, there have been few
stud-ies evaluating DCE parameters in metastatic disease of
the head and neck. Fischbein et al.(13) evaluated 68 lymph
nodes and demonstrated significant differences between
normal nodes and tumor-involved nodes, the latter showing longer TTPs, lower peak enhancement, a lower maximum slope, and a lower wash-out slope. In comparison with our study, that study employed different technical parameters
for DCE image acquisition, including the initial presence
of a contrast agent, the timing of the scan initiation, the
duration of acquisition, the size of the standardized ROIs,
and the partial volume effects in the ROI outlining, as well as demonstrating a different degree of interobserver vari-ability. Those differences could account for the discrepan-cies between the results of the two studies.
ADC
Although malignant and benign lymph nodes both
showed low ADCs in the present study, the difference between the two was not statistically significant. Most of the data in the literature suggest that ADCs are lower in
malignant lymph nodes. However, Sumi et al.(14) found
that ADCs were lower in malignant lymph nodes than
in benign nodes. That unexpected result could be due to the fact that those authors included necrotic areas in the
ROIs. Our finding that ADCs were lower in malignant nodes is consistent with the findings of Lee et al.(15) and
Holzapfel et al.(16). However, as previously mentioned, we
also found that the ADCs for benign nodes were similar to
those for malignant nodes, with no statistical difference
between the two. That finding could be related to the fact
that many causes of cervical lymphadenopathy, including
infectious disease, inflammatory/granulomatous disease,
autoimmune disease, and neoplasia, result in lymph node hyperplasia with high cellularity. Another point is that the Horizontal line, specificity; vertical line, sensitivity.
1.0
0.8
0.6
0.4
0.2
0.0
0.0 0.2 0.4 0.6 0.8 1.0
Figure 2. ROC curve for TTP. Figure 3. ROC curve for RE.
Horizontal line, specificity; vertical line, sensitivity.
1.0
0.8
0.6
0.4
0.2
0.0
tumor microenvironment is largely orchestrated by inflam -matory cells and participates in the neoplastic process, a processes that also results in increase cellularity secondary to hyperplasia due to lymph node reactions. Therefore,
al-though the ADC can quantify changes in diffusion behav
-ior, it cannot distinguish the cause of those changes(17–19).
In addition, in some neoplastic processes, other causes of cervical lymphadenopathy can mimic neoplasm on an
ADC map. Currently, there is no consensus regarding the technical parameters for ADC acquisition, which limits
the reproducibility and scalability of clinical studies.
Our findings indicate the potential of quantitative im -aging to differentiate between malignant and benign cer-vical nodes during the investigation of metastatic disease
prior to invasive procedures, potentially minimizing the
use of such procedures. However, there is still a need for further studies, with larger patient samples, in order to
confirm our findings.
Our study has some limitations. First, we evaluated a relatively small number of patients. In addition, the lack of
standardization in the literature regarding the acquisition of DCE time–signal intensity curve parameters and ADCs, together with the inflammatory environment generated by the neoplastic process, could explain the low ADC val -ues we found in benign lymph nodes. Furthermore, it is possible that artifacts occurred during DWI acquisition. The same radiologist performed all DWI measurements, in which we used single-shot echo-planar imaging, which
is highly sensitive to static magnetic field (B0) heteroge -neity, which produces nonlinear geometric distortion, pri-marily in the phase-encoding direction. Such artifacts
be-come more severe at higher magnetic field strengths and can alter the ADC, potentially reducing the capability of the ADC to differentiate between malignant and benign
lymph nodes.
CONCLUSIONS
We conclude that perfusion MRI has the potential to identify malignant lymph nodes. However, because of technical differences across studies and the lack of a con-sensus in the literature, quantitative imaging still cannot replace or preclude the need for invasive methods for the diagnosis of malignant nodes.
The high cellularity of malignant lymph nodes results
in a measurable decrease in their ADC, although other in
-flammatory processes cause high cellularity and can thus
mimic malignant nodes. Additional studies with larger
pa-tient samples should be conducted. Further standardiza
-tion of DWI and DCE techniques in different MRI scan -ners is fundamental to obtaining data that are reproduc-ible and comparable across studies.
REFERENCES
1. Hermans R. Posttreatment imaging in head and neck cancer. Eur J Radiol. 2008;66:501–11.
2. Leemans CR, Tiwari R, Nauta JJ, et al. Recurrence at the primary site in head and neck cancer and the significance of neck lymph node metastases as a prognostic factor. Cancer. 1994;73:187–90. 3. Cerezo L, Millán I, Torre A, et al. Prognostic factors for survival
and tumor control in cervical lymph node metastases from head
and neck cancer. A multivariate study of 492 cases. Cancer. 1992; 69:1224–34.
4. Dirix P, Vandecaveye V, De Keyzer F, et al. Diffusion-weighted MRI
for nodal staging of head and neck squamous cell carcinoma:
im-pact on radiotherapy planning. Int J Radiat Oncol Biol Phys. 2010; 76:761–6.
5. Fajardo L, Ramin GA, Penachim TJ, et al. Abdominal manifesta -tions of extranodal lymphoma: pictorial essay. Radiol Bras. 2016;
49:397–402.
6. Koifman AC. Normal, abnormal, and inconclusive: has the ultra
-sound pattern of healthy cervical lymph nodes been defined? Radiol Bras. 2016;49(5):ix.
7. Ogassavara B, Tucunduva Neto RR, Souza RR, et al. Ultrasound
evaluation of the morphometric patterns of lymph nodes of the head and neck in young and middle-aged individuals. Radiol Bras.
2016;49:225–8.
8. Queiroz RM, Abud LG, Abud TG, et al. Burkitt-like lymphoma of
the brain mimicking an intraventricular colloid cyst. Radiol Bras.
2017;50:413–4.
9. Curtin HD, Ishwaran H, Mancuso AA, et al. Comparison of CT and MR imaging in staging of neck metastases. Radiology. 1998; 207:123–30.
10. van den Brekel MW, Castelijns JA, Stel HV, et al. Occult metastatic neck disease: detection with US and US-guided fine-needle aspira
-tion cytology. Radiology. 1991;180:457–61.
11. Casselman JW, De Foer B, De Bondt BJ. Diffusion-weighted MR imaging of the head and neck. J Radiol. 2010;91(3 Pt 2):369–74. 12. Furukawa M, Parvathaneni U, Maravilla K, et al. Dynamic con
-trast-enhanced MR perfusion imaging of head and neck tumors at
3 Tesla. Head Neck. 2013;35:923–9.
13. Fischbein NJ, Noworolski SM, Henry RG, et al. Assessment of met -astatic cervical adenopathy using dynamic contrast-enhanced MR
imaging. AJNR Am J Neuroradiol. 2003;24:301–11.
14. Sumi M, Sakihama N, Sumi T, et al. Discrimination of meta-static cervical lymph nodes with diffusion-weighted MR imaging
in patients with head and neck cancer. AJNR Am J Neuroradiol. 2003;24:1627–34.
15. Lee MC, Tsai HY, Chuang KS, et al. Prediction of nodal metastasis in head and neck cancer using a 3T MRI ADC map. AJNR Am J Neuroradiol. 2013;34:864–9.
16. Holzapfel K, Duetsch S, Fauser C, et al. Value of diffusion-weighted
MR imaging in the differentiation between benign and malignant
cervical lymph nodes. Eur J Radiol. 2009;72:381–7.
17. Razek AAKA. Diffusion-weighted magnetic resonance imaging of head and neck. J Comput Assist Tomogr. 2010;34:808–15. 18. King AD, Ahuja AT, Yeung DK, et al. Malignant cervical lymphade
-nopathy: diagnostic accuracy of diffusion-weighted MR imaging.
Radiology. 2007;245:806–13.
19. Hwang I, Choi SH, Kim YJ, et al. Differentiation of recurrent tu -mor and posttreatment changes in head and neck squamous cell carcinoma: application of high b-value diffusion-weighted imaging.
AJNR Am J Neuroradiol. 2013;34:2343–8.