Cop
yright
© AE&M all rights r
eser
ved.
Effect of one time high dose
“stoss therapy” of vitamin D on
glucose homeostasis in high
risk obese adolescents
Preneet Cheema Brar1, Maria Contreras2, Xiaozhou Fan3,
Nipapat Visavachaipan4
ABSTRACT
Objective: To study the effect of using a one time high dose “stoss therapy” of vitamin D2 (ergocalciferol: VD2) on indices of insulin sensitivity {whole body sensitivity index: WBISI} and secretion {insulinogenic index: IGI} measured during an oral glucose tolerance test (OGTT) in obese adolescents with VDD (25 OHD; serum metabolite of vit D: < 30 ng/dL). Subjects and methods: In a randomized placebo controlled cross over design 20 obese adolescents with vitamin D deficiency (VDD) had baseline OGTT. Arm A received one time high dose 300,000 IU of ergocalciferol and Arm B received placebo. After 6 weeks the adolescents were reassigned to Arm A if they were in Arm B and vice versa. 25OHD, calcium, parathyroid hormone, comprehensive metabolic panel, urine calcium creatinine ratio were measured at each study visit. OGTTs to assess indices of sensitivity and secretion were done at baseline, 6 weeks and 12 weeks respectively. Results: Adolescents were obese and insulin resistant (mean ± SD: mean age = 15.1 ± 1.9 years; BMI: 32.7 ± 9.8; homeostatic model of insulin resistance: HOMA-IR: 4.2 ± 2.8). Stoss therapy with VD2 increased 25OHD from baseline (16.7 ± 2.9 to 19.5 ± 4.5; p = 0.0029) when compared to the placebo. WBISI (2.8 ± 1.9) showed a trend towards improvement in Rx group (p = 0.0577) after adjustment for covariates. IGI (3 ± 2.2) showed an improvement in both Rx and placebo groups. Conclusions: Our study demonstrated that using a high dose of VD2 (300,000 IU) did not have any beneficial effect on insulin sensitivity (whole body sensitivity index {WBISI}) and secretory indices (insulinogenic index {IGI}) in obese adolescents. High dose “stoss therapy” of VD2 did not appear to have any beneficial effect on glucose homeostasis on obese adolescents. Arch Endocrinol Metab. 2018;62(2):193-200
Keywords
Vitamin D; insulin resistance; prediabetes; obesity
1 Department of Pediatrics,
Division of Pediatric Endocrinology, New York University School of Medicine, New York, USA
2 Texas Tech University Health
Science Center, Department of Pediatrics, Amarillo, Texas, USA
3 Department of Population Health,
New York University School of Medicine, New York, USA
4 Bumrungrad International
Hospital, Bangkok, Thailand
Correspondence to: Preneet Cheema Brar 160 East 3nd street, L3,
New York 100016, New York, United States of America Preneet.Brar@nyumc.org Received on July/18/2017 Accepted on Oct/29/2017 DOI: 10.20945/2359-3997000000024
INTRODUCTION
L
ow vitamin D levels are consistently seen in 32-50% of obese adolescents (1-3). It is also thought that these low levels could be due to differences in vitamin D metabolizing enzymes in adipose tissue (4,5) and higher volumetric dilution of serum vitamin D, rather than just sequestration in adipose tissue, which could explain these lower levels of vitamin D in obese adolescents when compared to their lean peers.Vitamin D has been shown in both in vivo and in vitro studies to have effects on beta cell function and insulin sensitivity (6,7). The role of vitamin D in glucose homeostasis is well established and prospective studies have shown that vitamin D deficiency has an inverse and significant association with prediabetes and/or Type 2 diabetes (8,9).
There have been inconsistent results in randomized controlled trials done to study the effect of vitamin D supplementation on parameters of glucose homeostasis in insulin resistance states, in both adults and children, with some showing beneficial effects on insulin sensitivity (10-13) while others did not (14). In adults, the effect of vitamin D on prediabetes and/or T2DM showed beneficial effect in a study by Neyestani and cols. (15) and no effect in another (16). More recently studies using high dosing vitamin D (150,000-300,000 units) over a short duration (4-8 weeks) have also shown conflicting results on insulin sensitivity and secretion in adults with prediabetes (17,18).
Cop
yright
© AE&M all rights r
eser
ved.
and insulin resistance to assess the efficacy of using one time high dose of VD2 on indices of insulin sensitivity and secretion over a short period of time. To summarize we tested whether one time high dose of ergocalciferol (300,000 units) corrected the vitamin D deficiency and improved glucose homeostasis in obese adolescents with insulin resistance.
SUBJECTS AND METHODS
This was a randomized placebo controlled cross over design trial with inclusion criteria that were: a) obese adolescents (BMI: ≥ 95th percentile for age) who were 12-18 years; b) > Tanner 2 for puberty and had vitamin D deficiency defined as a 25(OH)D of ≤ 20 ng/mL (50 nmol/L). Exclusion criteria were: a) treatment with medication known to effect vitamin D, calcium and glucose metabolism, such as glucocorticoids, thiazolidinediones, metformin, anticonvulsants metabolized through cytochrome P-450 (phenytoin, carbamazepine, phenobarbital, sodium valproate); b) vitamin D supplementation greater than 400 IU daily in the preceding 3 months; c) history of nephrolithiasis or hypercalcemia; pregnancy; d) attendance at a tanning salon. The study was approved by the Ethics committee at New York University School of Medicine and consent was obtained from parents and patients.
We chose to use “stoss” therapy {German word stossen means “to push”} based on a recent global consensus for management of vitamin D deficiency (20). The Endocrine society consensus statement recommended 50,000 for 6 weeks for children and adolescents with vitamin D deficiency. Much higher dosing was recommended for obese adults at least 6,000-10,000 per day for 8 weeks (19). We decided to give 300,000 IU as a “stoss dose”, a practical choice to improve compliance. Subjects selected for the study were randomized, half to the treatment group (A) and half to the placebo group (B). At week 7, subjects were switched over and reassigned to receive vitamin D if they are in Group B and placebo if they were in Group A and the study lasted 12 weeks from start to completion.
Ergocalciferol (50,000 IU) capsules and placebo capsules were provided at the study visit based on the randomization scheme. Each subject got 6 capsules of study drug or placebo at the study visit totaling 300,000 IU of ergocalciferol or no ergocalciferol at all in the placebo capsules. Each arm of trial lasted 6
weeks with no washout period. Patients were blinded to treatment assignment during the entire study. Study design and recruitment are shown in the study consort diagram (Figure 1).
GCRC: General Clinical Research Center.
Modified consort diagram for subject recruitment testing
6 refused and 4 cancelled
6 week time interval 20 adolescents were consented and assents
were obtained. These adolescents were randomized to Rx or placebo. The study participants were blinded to the intervention
Cross over design was at week 6- 7 when every patient moved over to
the other arm of study serving as their own control
Week 6-7: Received ergocalciferol 300,000 GCRC. Second OGTT, 25(OH)D, calcium, PTH, CMP and
urine for calcium creatinine were obtained
Week 12: Final OGTT, 25(OH)D, calcium, PTH, CMP and urine
for calcium creatinine were obtained
Week 6-7: Received ergocalciferol 300,000 GCRC. Second OGTT, 25(OH)D, calcium, PTH, CMP and
urine for calcium creatinine were obtained
Week 0: Group A (N = 10):
Received ergocalciferol 300,000 in GCRC. Baseline OGTT, 25(OH)D,
calcium, PTH, CMP and urine for calcium creatinine were obtained
Week 0: Group B (N=10):
Received placebo in GCRC. Baseline OGTT, 25(OH)D, calcium, PTH, CMP
and urine for calcium creatinine were obtained Subjects recruited = 30
Inclusion criteria: * 12-18 year * BMI > 95%, Vitamin D ≤ 20 ng/mL
Exclusion criteria: * Medications which affect calcium metabolism &* Use of Vit D > 400 IU in past 3 months * Pregnancy * Attendance at tanning salon * History of kidney stones or hypercalcemia
Week 12: Final OGTT, 25(OH)D, calcium, PTH, CMP and urine
for calcium creatinine were obtained
Cop
yright
© AE&M all rights r
eser
ved.
and quantitation via tandem mass spectrometry. 25OHD2 and 25OHD3 concentrations were used to calculate total 25OHD levels. Glycosylated hemoglobin (HbA1C) were measured in red blood cells using HPLC method. Serum calcium (mg/dL), albumin (g/dL) and intact parathyroid hormone (PTH) (pg/ mL were measured. Calcium was corrected for the serum albumin {([4-albumin (g/dL)] x 0.8) + calcium (mg/dL)} (21). Intact PTH, 25(OH) D and spot urine calcium/creatinine ratio were checked at completion of the 6 week treatment phase (in week 7) to exclude vitamin D toxicity including hypercalciuria (urine calcium/creatinine ratio ≥ 0.2), hyperphosphatemia (serum phosphate > 5.7 mg/mL), hypercalcemia (serum calcium > 10.5 mg/dL), serum 25(OH) D > 150 ng/mL. Baseline labs were drawn at the same time as 0 minute OGTT.
Primary outcome
OGTT was done glucose solution (1.75 g/kg up to a maximum of 75 g) over a 2-minute period and blood samples were obtained at 0, 10, 30, 60, 90 and 120 minutes. Indices were calculated from OGTTs done at three time points: baseline; 7 week and 12 week time points.
Calculated insulin sensitivity parameter from OGTT
Whole body insulin sensitivity (WBISI) (22) is an insulin sensitivity measure that has been validated in obese children and adolescents (23) calculated as follows = 10,000/√(fasting glucose mg/dl × fasting insulinµIU/ ml)×(mean glucose × mean insulin) during OGTT 1 during OGTT. Higher WBISI levels indicate greater insulin sensitivity.
Calculated insulin secretory parameters from OGTT
Insulin index (IGI): is a measure of insulin secretion that has been validated in children against the hyperglycemic clamp [7], calculated as followed: IGI = [30-minute insulin – fasting plasma insulin (uIU/ mL)/[30-minute glucose – fasting plasma glucose (mg/dL)]. Adolescents with Type 2 diabetes have a significant reduction in IGI (24).
Secondary outcome
a. Pre- and post treatment 25 OHD; b. change in serum PTH; c. Biochemical evidence of vitamin D toxicity such hypercalciuria (urine calcium/creatinine ratio ≥ 0.2), serum phosphate > 5.7 mg/mL, serum calcium > 10.5 mg/dL, serum 25(OH) D > 150 ng/mL.
Statistical analysis
To estimate the effect of vitamin D treatment on the clinical features in this crossover study, we first examined the within patient comparison by using paired t-test. We next examined the treatment given one period (treatment/placebo) adjusted for the baseline values by using mixed regression models controlling for baseline measurements, age, gender, race, BMI, and seasons [winter: Dec-Feb; spring: Mar-May; summer: Jun-Aug; fall: Sep-Nov]. Koch’s test was used to examine the crossover effect on the association of treatment and clinical features. We further conducted stratified analyses according to baseline diabetes and pre-diabetes status, using the criteria plasma glucose at 0 minute ≥ 100 mg/ dL or at 120 minutes ≥ 140 in oral glucose tolerance test (OGTT), HbA1C ≥ 5.7% and HOMA -IR ≥ 3.4, and intact PTH ≥ 44 pg/mL. At last, plasma glucose concentration and insulin level at times 0, minutes, 30 minutes, 60 minutes, 90 minutes, and 120 minutes in insulin sensitivity test were compared between treatment and placebo groups by using the mixed regression models described above, as well as the mean levels at the first-phase (at and before 30 minutes), second phase (after 30 minutes), and whole period (0-120 minutes). All statistical tests were two-sided, and all statistical analyses were carried out using SAS 9.3.
RESULTS
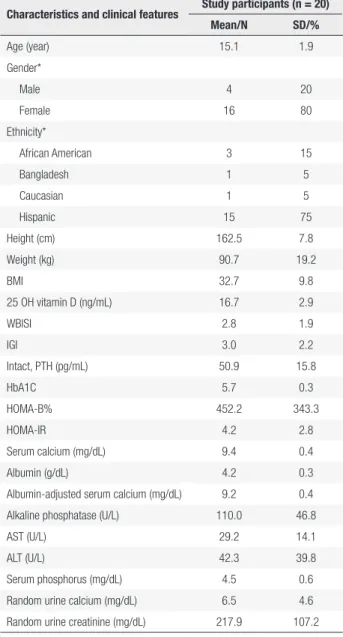
Of the twenty participants, 80% (n = 16) were females, and 75% (n = 15) were Hispanic, with mean age 15 year-old. The study participants were predominantly overweight, with mean BMI 32.7 (Table 1). The baseline clinical features of all participants were shown in Table 1 as well: Serum 25-OH vitamin D levels were 16.7 ± 2.9 ng/mL (reference range 12-20 ng/mL) (25); and WBISI were 2.8 ± 1.9 (reference range 1.84 ± 0.17); and IGI were 3.0 ± 2.2; and PTH were 50.9 ± 15.8 (reference range 15 – 75 pg/mL).
Cop
yright
© AE&M all rights r
eser
ved.
significant. Intact PTH decreased in treatment group (∆mean = -6.0, pt-test = 0.0538); however, this decrease was not significant compared to the changes in placebo group (adjusted p from mixed model = 0.1290). Additionally, alkaline phosphatase levels decreased in both treatment group (∆mean = -6.5, pt-test = 0.0334) and placebo group (∆mean = -7.5, pt-test = 0.0034), and AST and ALT only decreased in treatment group (∆mean = -2.0, pt-test = 0.0209 for AST, and ∆mean = -4.0, pt-test = 0.0106 for ALT). However, the decreasewere not significant compared to the changes in placebo group.
Since childhood diabetes and pre-diabetes status may have effects of vitamin D treatment on insulin sensitivity, we stratified the associations of VD2 treatment with WBISI and IGI by clinical diabetes measurements (Table 3). In contrast to the overall analysis, the means of IGI decreased in treatment (∆mean = -0.70, pt-test = 0.5606) in children with fasting serum glucose level ≥ 100 or ≥ 140 at time 0 and 120 minutes during the OGTT, although these differences were not significant. Children with HOMA-IR ≥ 3.4 and HbA1C ≥ 5.7% had similar trend of in both treatment and placebo group with the overall changes. When stratified by PTH, the treatment group with PTH ≤ 44 pg/mL had increased mean of WBISI (∆mean = 0.10, p
t-test = 0.5040), and decreased mean of IGI (∆mean = -0.30, pt-test = 0.5722).
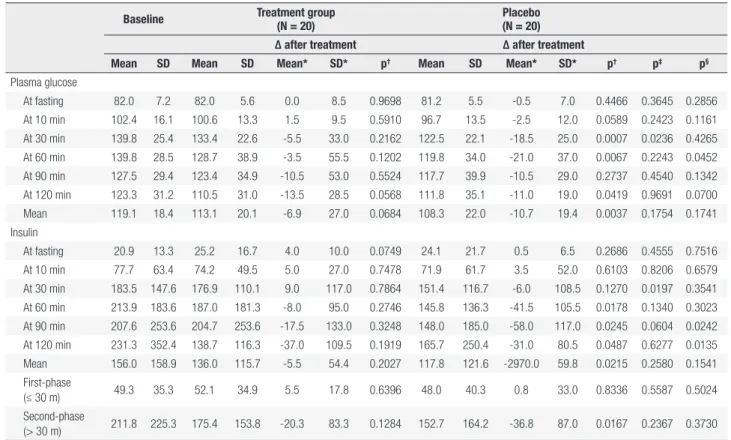
In the comparisons of the mean differences between treatment and placebo group at each time point of OGTT (Table 4: 0 min, 10 min, 30 min, 60 min, 90 min, 120 min), serum glucose level decreased slower in treatment group (∆mean = -5.5, pt-test = 0.2162) than placebo (∆mean = -18.5, pt-test = 0.0007) at 30 minutes, with p value from mixed model equals to 0.0236. While, insulin level increased in treatment group (∆mean = 9.0, pt-test = 0. 7864), and decreased in placebo (∆mean = -6.0, pt-test = 0.1270) at 30 minutes (p from mixed model = 0.0197). No significant differences between treatment and placebo at other time point of OGTT was found, as well as the mean values of all time points in both glucose and insulin levels.
DISCUSSION
Our study demonstrated that using high dose of VD2 (300,000 IU) in a cross over design trial did not have any beneficial effect on insulin sensitivity and secretory indices in obese adolescents when measured using an oral glucose tolerance test.
Table 1. Baseline characteristics and clinical features of the study population
Characteristics and clinical features Study participants (n = 20)
Mean/N SD/%
Age (year) 15.1 1.9
Gender*
Male 4 20
Female 16 80
Ethnicity*
African American 3 15
Bangladesh 1 5
Caucasian 1 5
Hispanic 15 75
Height (cm) 162.5 7.8
Weight (kg) 90.7 19.2
BMI 32.7 9.8
25 OH vitamin D (ng/mL) 16.7 2.9
WBISI 2.8 1.9
IGI 3.0 2.2
Intact, PTH (pg/mL) 50.9 15.8
HbA1C 5.7 0.3
HOMA-B% 452.2 343.3
HOMA-IR 4.2 2.8
Serum calcium (mg/dL) 9.4 0.4
Albumin (g/dL) 4.2 0.3
Albumin-adjusted serum calcium (mg/dL) 9.2 0.4
Alkaline phosphatase (U/L) 110.0 46.8
AST (U/L) 29.2 14.1
ALT (U/L) 42.3 39.8
Serum phosphorus (mg/dL) 4.5 0.6
Random urine calcium (mg/dL) 6.5 4.6
Random urine creatinine (mg/dL) 217.9 107.2
* Numbers of participants and percentage were calculated.
Cop
yright
© AE&M all rights r
eser
ved.
Table 2. Baseline values and changes after treatment in clinical features and the placebo group
Baseline Treatment group(N = 20) Placebo group(N = 20)
∆ after treatment ∆ after treatment
Mean SD Mean SD Median* IQR* p† Mean SD Median* IQR* p† p‡ p§
25 OH vitamin D
(ng/mL) 16.7 2.9 19.5 4.5 2.4 4.7 0.0029 17.2 4.7 0.0 2.2 0.5262 0.0059 0.4506
WBISI 2.8 1.9 2.7 1.4 -0.1 1.1 0.5377 3.1 1.5 0.3 1.9 0.3855 0.0577 0.4205
IGI 3.0 2.2 3.5 2.7 0.1 1.8 0.2878 4.3 6.3 0.1 1.2 0.3069 0.5971 0.0030
Intact, PTH (pg/mL) 50.9 15.8 45.6 11.8 -6.0 19.0 0.0538 50.3 14.3 0.5 16.0 0.8327 0.1290 0.1075
HbA1C 5.7 0.3 5.7 0.4 0.1 0.2 0.2674 5.7 0.4 0.1 0.3 0.3264 0.9052 0.2918
HOMA-B% 452.2 343.3 483.5 258.2 19.8 173.8 0.3889 543.9 532.2 34.2 288.5 0.2769 0.5740 0.0004
HOMA-IR 4.2 2.8 5.2 3.6 0.9 2.3 0.1079 4.9 4.5 0.2 1.3 0.2829 0.3403 0.3396
Serum calcium
(mg/dL) 9.4 0.4 9.3 0.4 0.0 0.4 0.4936 9.2 0.3 -0.1 0.5 0.0909 0.1287 0.2258
Albumin (g/dL) 4.2 0.3 4.2 0.9 -0.3 0.4 0.8346 4.1 0.3 -0.2 0.3 0.1670 0.8932 0.0200
Albumin-adjusted
serum calcium 9.2 0.4 9.1 0.7 0.1 0.4 0.8927 14.7 25.6 0.0 0.6 0.3750 0.3975 < 0.0001
Alkaline
phosphatase (U/L) 110.0 46.8 103.6 43.5 -6.5 13.0 0.0344 99.6 37.6 -7.5 15.0 0.0034 0.3105 0.4072
AST (U/L) 29.2 14.1 25.2 11.9 -2.0 5.5 0.0209 29.1 15.8 -0.5 6.0 0.9374 0.0870 < 0.0001
ALT (U/L) 42.3 39.8 36.2 32.4 -4.0 9.5 0.0106 40.6 36.7 -1.0 9.0 0.6514 0.2704 < 0.0001
Serum phosphorus
(mg/dL) 4.5 0.6 4.5 0.6 -0.1 0.5 0.7354 4.5 0.5 0.0 0.4 0.5965 0.6586 0.9649
Random urine
calcium (mg/dL) 6.5 4.6 8.6 7.8 2.7 6.2 0.1733 14.0 21.4 1.0 7.0 0.1411 0.3369 0.0007
Random urine
creatinine (mg/dL) 217.9 107.2 274.6 441.8 -12.7 106.5 0.5034 199.2 108.3 -9.9 89.7 0.4150 0.3292 < 0.0001
* Medians and IQR of the difference between treatment/placebo group and baseline were calculated.
† p values were calculated from exact comparison (paired t-test) of measurements to baseline.
‡ p values were calculated from mixed regression models, adjusted for baseline measurements, age, gender, race, BMI, and season [winter: Dec-Feb; spring: Mar-May; summer: Jun-Aug; fall: Sep-Nov]. § p values were calculated from Koch’s analysis testing for crossover effects.
Table 3. Changes after treatment in WBISI and IGI and the placebo group stratified according to diabetes status
Treatment group Placebo group
∆ after treatment ∆ after treatment
N Mean SD Median* IQR* p† N Mean SD Median* IQR* p† p‡ p§
G_0 ≥ 100 mg/dL and/
or G_120 ≥ 140 mg/dL 5 5
WBISI 1.38 0.80 -0.20 0.30 0.1293 1.56 1.04 -0.10 0.50 0.6213 0.4718 0.5477
IGI 5.18 4.51 -0.70 1.20 0.5606 2.94 2.43 -0.60 1.60 0.1376 0.1236 0.1126
HOMA-IR ≥ 3.4 &
HbA1C ≥ 5.7% 6 6
WBISI 2.27 1.44 -0.25 0.30 0.8226 2.32 1.06 0.25 0.90 0.4391 0.2516 0.1764
IGI 5.70 3.52 2.30 5.60 0.2714 8.40 10.69 0.95 5.60 0.2636 0.1735 0.8965
Intact, PTH ≤ 44 pg/mL 9 9
WBISI 2.15 1.18 0.10 0.35 0.5040 2.86 1.69 0.30 2.00 0.0765 0.3445 < 0.0001
IGI 3.26 2.20 -0.30 1.10 0.5722 2.64 1.88 -0.55 1.40 0.0389 0.3450 < 0.0001
Intact, PTH > 44 pg/mL 11 11
WBISI 3.05 1.43 -0.30 1.90 0.4458 3.34 1.46 0.20 1.60 0.7871 0.2312 0.4084
IGI 3.74 3.20 0.65 3.20 0.2286 5.61 8.24 0.50 1.50 0.1978 0.7405 0.1898
Cop
yright
© AE&M all rights r
eser
ved.
Table 4. Baseline values and changes after treatment in plasma glucose and insulin levels and the placebo group at each time point
Baseline Treatment group
(N = 20)
Placebo (N = 20)
∆ after treatment ∆ after treatment
Mean SD Mean SD Mean* SD* p† Mean SD Mean* SD* p† p‡ p§
Plasma glucose
At fasting 82.0 7.2 82.0 5.6 0.0 8.5 0.9698 81.2 5.5 -0.5 7.0 0.4466 0.3645 0.2856
At 10 min 102.4 16.1 100.6 13.3 1.5 9.5 0.5910 96.7 13.5 -2.5 12.0 0.0589 0.2423 0.1161
At 30 min 139.8 25.4 133.4 22.6 -5.5 33.0 0.2162 122.5 22.1 -18.5 25.0 0.0007 0.0236 0.4265
At 60 min 139.8 28.5 128.7 38.9 -3.5 55.5 0.1202 119.8 34.0 -21.0 37.0 0.0067 0.2243 0.0452
At 90 min 127.5 29.4 123.4 34.9 -10.5 53.0 0.5524 117.7 39.9 -10.5 29.0 0.2737 0.4540 0.1342
At 120 min 123.3 31.2 110.5 31.0 -13.5 28.5 0.0568 111.8 35.1 -11.0 19.0 0.0419 0.9691 0.0700
Mean 119.1 18.4 113.1 20.1 -6.9 27.0 0.0684 108.3 22.0 -10.7 19.4 0.0037 0.1754 0.1741
Insulin
At fasting 20.9 13.3 25.2 16.7 4.0 10.0 0.0749 24.1 21.7 0.5 6.5 0.2686 0.4555 0.7516
At 10 min 77.7 63.4 74.2 49.5 5.0 27.0 0.7478 71.9 61.7 3.5 52.0 0.6103 0.8206 0.6579
At 30 min 183.5 147.6 176.9 110.1 9.0 117.0 0.7864 151.4 116.7 -6.0 108.5 0.1270 0.0197 0.3541
At 60 min 213.9 183.6 187.0 181.3 -8.0 95.0 0.2746 145.8 136.3 -41.5 105.5 0.0178 0.1340 0.3023
At 90 min 207.6 253.6 204.7 253.6 -17.5 133.0 0.3248 148.0 185.0 -58.0 117.0 0.0245 0.0604 0.0242
At 120 min 231.3 352.4 138.7 116.3 -37.0 109.5 0.1919 165.7 250.4 -31.0 80.5 0.0487 0.6277 0.0135
Mean 156.0 158.9 136.0 115.7 -5.5 54.4 0.2027 117.8 121.6 -2970.0 59.8 0.0215 0.2580 0.1541
First-phase
(≤ 30 m) 49.3 35.3 52.1 34.9 5.5 17.8 0.6396 48.0 40.3 0.8 33.0 0.8336 0.5587 0.5024
Second-phase
(> 30 m) 211.8 225.3 175.4 153.8 -20.3 83.3 0.1284 152.7 164.2 -36.8 87.0 0.0167 0.2367 0.3730
* Medians and IQR of the difference between treatment/placebo group and baseline were calculated. † p values were calculated from exact comparison (paired t-test) of measurements to baseline.
‡ p values were calculated from mixed regression models, adjusted for baseline measurements, age, gender, race, BMI, and season [winter: Dec-Feb; spring: Mar-May; summer: Jun-Aug; fall: Sep-Nov].
§ p values were calculated from Koch’s analysis testing for crossover effects.
Prediabetes was found in 10-39% of obese adolescents (24,26), which parallels the rise of obesity (27). Vitamin D has shown to have effects on insulin secretion and action and in both pediatric and adult studies an inverse association between vitamin D levels and development of prediabetes and/or T2DM have been demonstrated (10,21).
Long term randomized control trials (3 months- 7 years) have studied whether giving vitamin D prevents the progression of insulin resistance to prediabetes to Type 2 diabetes due to its effects on augmenting insulin action and secretion. Von Hurst and cols. studied 42 South Asian women with insulin resistance using 4000 IU of D3 for 6 months. Fasting insulin and HOMA-IR improved in the cases versus controls (p values = 0.02). Davidson and cols. used a weight and vitamin D based formula to calculate vitamin D dosing (average of 88000 IU/week) for 12 months and showed improvement in Hba1c (decrease by 0.2%) but the intervention affected no other parameters of any OGTT derived secretory and sensitivity indices in this cohort of pre diabetic adults. These studies (more than 6 months
of vitamin D treatment) have been equivocal to truly establish any real benefit of using vitamin D on indices of beta cell function and insulin sensitivity, the caveat being the variations in the dosing of vitamin D used, compliance concerns and whether the vitamin D truly reached an optimal level (i.e. > 30 ng/mL) to effect the aspects of function of beta cell. It is clear that in this obese cohort of female adolescents (average BMI = 32.1) we found that treatment did increase the vitamin D level when compared to the placebo arm (19.5 vs. 17.2 ng/dL; p = 0.0029) and this significance stayed after adjustments for covariates: BMI, age sex, gender, race and season. However our intervention of 300,000 IU was not able to optimize the vitamin D levels to levels of sufficiency i.e. ≥ 30 ng/mL in all except one subjects. Levels reached ≥ 20 ng/mL in six subjects by the end of the three month intervention. This dosing was based on the Endocrine society guidelines of using 50,000 IU for 6 weeks for deficient states (19).
Cop
yright
© AE&M all rights r
eser
ved.
(delta mean increase 0.1) though this difference was not significant when compared to the placebo. IGI increased in both groups while PTH decreased to a greater extent when compared to the placebo though in the mixed model analysis the difference was not significant. In a similar study designed by Ashraf and cols. obese adolescents (average age 14.9 ± 1.8 years) were given 50,000 IU of vitamin D per week for 8 weeks to observe effects on glucose parameters. While HOMA-IR and WBISI did not improve on the follow up OGTT fasting glucose showed statistical improvement (p = 0.05) in cases when compared to controls. In a dose titration study (400 IU to 4000 IU) of 323 early pubertal children (age = 11.3 years; BMI% 70% and 25 (OH) levels 28 ng/mL) fasting insulin and HOMA-IR correlated with baseline levels of 25(OH) D (r = 0.14 and 0.15 respectively). Rx with vitamin D had no significant positive impact on glucose and insulin parameters over a 12 week period. In this study by Ferira and cols. among these children only 15% were vitamin D deficient and obese respectively and therefore making comparisons with our study results would not be reasonable (28).
In a noteworthy study by Wagner and cols. investigated the effect of high-dose vitamin D3 treatment on beta-cell function, insulin sensitivity, and glucose tolerance in subjects with prediabetes or diet-treated type 2 diabetes adults (n = 43, BMI 28.6) randomized to 30,000 IU of cholecalciferol or placebo drops weekly for 8 weeks. They studied first and second phase insulin response (I Sec0-12, I Sec12-12), disposition index {DI} (measured with hyperglycemic clamp) and WBISI using pre and post Rx OGTT. The investigators did not find any improvement I Sec0-12, I Sec12-120 results which are in line with our results which showed no improvements in the indices derived either from the clamp or OGTT. The difference between this study in adults and ours in adolescents is that their vitamin D levels rose from 17.2 ng/mL (43 mmol/L) at baseline to 34 ng/mL at the end of the 8 week study (29). The fact that they normalized the vitamin D levels supports their findings that vitamin D given in high doses over a short period does not improve metabolic profile of prediabetes and T2DM adults.
To further analyze the data we stratified and looked at the associations between vitamin D levels and metabolic parameters which reflect emerging decompensation such as: Glucose ≥ 100 mg/dL or ≥ 140 mg/dL at 0 and 120 minutes of the OGTT,
HbA1c ≥ 5.7%-6.4% (defined as prediabetes by American Diabetes Association). No differences were found in the Rx group using this stratification analysis. No significant differences between treatment and placebo at other time point of OGTTs were found, as well as the mean values of all time points (10, 30, 60, and 90 min) in both glucose and insulin levels. These results further reiterate that the intervention had no effects in the variables of interest.
The cross-over of our RCT was designed to balance the exposure to vitamin D and placebo in sequence based on the arm that the adolescents were assigned to. Each patient served as their own control which allowed for a smaller sample size. The limitations were the “order” and “carry over” effect of a cross over study and we recognize that we did not have a wash out period which could have affected our results. A strength of the study was that we did adjust for seasonal variation in our analysis of the data. We were not able to normalize 25 OHD level and that is a major limitation of our study. 25 OHD has a threshold effect on the beta cell function and we speculate that this is reason why we could find any improvements in insulin secretory and sensitivity parameters. Also, given emerging information on pharmacokinetics studies on available formulations found that ergocalciferol was not as good a choice as cholecalciferol which is more effective in increasing the serum 25(OH) D pools (30).
Our results are aligned to the negative results found in the recent studies showing no beneficial effect of vitamin D on glucose and insulin indices derived from OGTT. We suggest considering much higher dosing for obese adolescents based on adult studies (31) accepting the fact that these are adult sized adolescents. Based on our study there is no evidence to support the use of high dose vitamin D over a short term period to improve glucose homeostasis.
Acknowledgments: supported in part by the NYU CTSA grant UL1 TR000038 from the National Center for Advancing Trans-lational Sciences, National Institutes of Health.
Disclosure: no potential conflict of interest relevant to this article was reported.
REFERENCES
Cop
yright
© AE&M all rights r
eser
ved.
2. Reis JP, von Muhlen D, Miller ER 3rd, Michos ED, Appel LJ. Vitamin D status and cardiometabolic risk factors in the United States adolescent population. Pediatrics. 2009;124(3):e371-9. 3. Alemzadeh R, Kichler J, Babar G, Calhoun M. Hypovitaminosis D in
obese children and adolescents: relationship with adiposity, insulin sensitivity, ethnicity, and season. Metabolism. 2008;57(2):183-91. 4. Wamberg L, Christiansen T, Paulsen SK, Fisker S, Rask P, Rejnmark
L, et al. Expression of vitamin D-metabolizing enzymes in human adipose tissue -- the effect of obesity and diet-induced weight loss. Int J Obes (Lond). 2013;37(5):651-7.
5. Drincic AT, Armas LA, Van Diest EE, Heaney RP. Volumetric dilution, rather than sequestration best explains the low vitamin D status of obesity. Obesity (Silver Spring). 2012;20(7):1444-8. 6. Norman AW, Frankel JB, Heldt AM, Grodsky GM. Vitamin D
deficiency inhibits pancreatic secretion of insulin. Science (New York, NY). 1980;209:823-5.
7. Chiu KC, Chu A, Go VL, Saad MF. Hypovitaminosis D is associated with insulin resistance and beta cell dysfunction. Am J Clin Nutr. 2004;79(5):820-5.
8. Deleskog A, Hilding A, Brismar K, Hamsten A, Efendic S, Ostenson CG. Low serum 25-hydroxyvitamin D level predicts progression to type 2 diabetes in individuals with prediabetes but not with normal glucose tolerance. Diabetologia. 2012;55(6):1668-78. 9. Song Y, Wang L, Pittas AG, Del Gobbo LC, Zhang C, Manson JE,
et al. Blood 25-hydroxy vitamin D levels and incident type 2 diabetes: a meta-analysis of prospective studies. Diabetes Care. 2013;36(5):1422-8.
10. Pittas AG, Lau J, Hu FB, Dawson-Hughes B. The role of vitamin D and calcium in type 2 diabetes. A systematic review and meta-analysis. J Clin Endocrinol Metab. 2007;92(6):2017-29.
11. von Hurst PR, Stonehouse W, Coad J. Vitamin D supplementation reduces insulin resistance in South Asian women living in New Zealand who are insulin resistant and vitamin D deficient - a randomised, placebo-controlled trial. Br J Nutr. 2010;103(4):549-55.
12. Belenchia AM, Tosh AK, Hillman LS, Peterson CA. Correcting vitamin D insufficiency improves insulin sensitivity in obese adolescents: a randomized controlled trial. Am J Clin Nutr. 2013;97(4):774-81. 13. Nader NS, Aguirre Castaneda R, Wallace J, Singh R, Weaver A,
Kumar S. Effect of vitamin D3 supplementation on serum 25(OH) D, lipids and markers of insulin resistance in obese adolescents: a prospective, randomized, placebo-controlled pilot trial. Horm Res Paediatr. 2014;82:107-12.
14. Wamberg L, Kampmann U, Stodkilde-Jorgensen H, Rejnmark L, Pedersen SB, Richelsen B. Effects of vitamin D supplementation on body fat accumulation, inflammation, and metabolic risk factors in obese adults with low vitamin D levels - results from a randomized trial. Eur J Intern Med. 2013;24(7):644-9.
15. Neyestani TR, Nikooyeh B, Alavi-Majd H, Shariatzadeh N, Kalayi A, Tayebinejad N, et al. Improvement of vitamin D status via daily intake of fortified yogurt drink either with or without extra calcium ameliorates systemic inflammatory biomarkers, including adipokines, in the subjects with type 2 diabetes. J Clin Endocrinol Metab. 2012;97(6):2005-11.
16. Kampmann U, Mosekilde L, Juhl C, Moller N, Christensen B, Rejnmark L, et al. Effects of 12 weeks high dose vitamin D3 treatment on insulin sensitivity, beta cell function, and metabolic markers in patients with type 2 diabetes and vitamin
D insufficiency - a double-blind, randomized, placebo-controlled trial. Metabolism. 2014;63(9):1115-24.
17. Nazarian S, St Peter JV, Boston RC, Jones SA, Mariash CN. Vitamin D3 supplementation improves insulin sensitivity in subjects with impaired fasting glucose. Transl Res. 2011;158(5):276-81. 18. Wagner H, Alvarsson M, Mannheimer B, Degerblad M, Ostenson
CG. No Effect of High-Dose Vitamin D Treatment on β-Cell Function, Insulin Sensitivity, or Glucose Homeostasis in Subjects With Abnormal Glucose Tolerance: A Randomized Clinical Trial. Diabetes Care. 2016;39(3):345-52.
19. Holick MF, Binkley NC, Bischoff-Ferrari HA, Gordon CM, Hanley DA, Heaney RP, et al. Evaluation, treatment, and prevention of vitamin D deficiency: an Endocrine Society clinical practice guideline. J Clin Endocrinol Metab. 2011;96(7):1911-30.
20. Munns CF, Shaw N, Kiely M, Specker BL, Thacher TD, Ozono K, et al. Global Consensus Recommendations on Prevention and Management of Nutritional Rickets. J Clin Endocrinol Metab. 2016;101(2):394-415.
21. Pittas AG, Dawson-Hughes B. Vitamin D and diabetes. J Steroid Biochem Mol Biol. 2010;121(1-2):425-9.
22. Matsuda M, DeFronzo RA. Insulin sensitivity indices obtained from oral glucose tolerance testing: comparison with the euglycemic insulin clamp. Diabetes Care. 1999;22(9):1462-70. 23. Yeckel C, Weiss R, Dziura J, Taksali S, Dufour S, Burgert T, et
al. Validation of insulin sensitivity indices from oral glucose tolerance test parameters in obese children and adolescents. J Clin Endocrinol Metab. 2004;89(3):1096-101.
24. Sinha R, Fisch G, Teague B, Tamborlane WV, Banyas B, Allen K, et al. Prevalence of impaired glucose tolerance among children and adolescents with marked obesity. N Engl J Med. 2002;346(11): 802-10.
25. Ross AC, Manson JE, Abrams SA, Aloia JF, Brannon PM, Clinton SK, et al. The 2011 report on dietary reference intakes for calcium and vitamin D from the Institute of Medicine: what clinicians need to know. J Clin Endocrinol Metab. 2011;96(1):53-8.
26. Nowicka P, Santoro N, Liu H, Lartaud D, Shaw M, Goldberg R, et al. Utility of hemoglobin a1c for diagnosing prediabetes and diabetes in obese children and adolescents. Diabetes Care. 2011;34(6):1306-11.
27. Ogden CL, Carroll MD, Flegal KM. High body mass index for age among US children and adolescents, 2003-2006. JAMA. 2008;299(20):2401-5.
28. Ferira AJ, Laing EM, Hausman DB, Hall DB, McCabe GP, Martin BR, et al. Vitamin D Supplementation Does Not Impact Insulin Resistance in Black and White Children. J Clin Endocrinol Metab. 2016;101(4):1710-8.
29. Herpertz S, Albus C, Wagener R, Kocnar M, Wagner R, Henning A, et al. Comorbidity of diabetes and eating disorders. Does diabetes control reflect disturbed eating behavior? Diabetes Care. 1998;21(7):1110-6.
30. Itkonen ST, Skaffari E, Saaristo P, Saarnio EM, Erkkola M, Jakobsen J, et al. Effects of vitamin D2-fortified bread v. supplementation with vitamin D2 or D3 on serum 25-hydroxyvitamin D metabolites: an 8-week randomised-controlled trial in young adult Finnish women. Br J Nutr. 2016;115(7):1232-9.