1
Analysis of the efficiency of wind turbine gearboxes using the
1
temperature variable
2
Sequeira, C.1*, Pacheco, A.1, Galego, Pedro M.2, Gorbeña, E.1
3
1MORE-CIMA/Universidade do Algarve, Edifício 7, Campus de Gambelas Faro, 8005-139, Portugal,
4
cdsequeira@ualg.pt, ampacheco@ualg.pt, egeisenmann@ualg.pt 5
2Instituto Superior de Engenharia, Universidade do Algarve, Campus da Penha, 8005-139 Portugal,
6 pedromiguelgalego@hotmail.com 7 Doi: https://doi.org/10.1016/j.renene.2018.12.040 8
Abstract
9The aim of this paper is to evaluate how lubricant selection affects gearbox efficiency and
10
overall energy production by analysing real data from wind farms, monitored and
11
controlled by a Supervisory Control and Data Acquisition (SCADA system). The turbines
12
analysed worked with two or more oil types for the same amount of hours, which allowed
13
to establish relations between the active power curves and wind velocity; oil temperature
14
inside gearboxes and wind velocity; and oil temperature inside gearboxes and active
15
power production. The results of this study evidenced a direct relation between oil
16
characteristics and energy efficiency i.e. gearboxes working with mineral oil perform
17
better then gearboxes working with synthetic oils. Those differences can be significant in
18
terms of active power production. Also, it was observed oil degradation as function of
19
temperature increase, with changes on viscosity, which reveals that temperature
20
behaviour along the active power curve is strongly related to oil’ characteristics.
21 22
Keywords: Wind Turbine, Gearbox, Oil temperature, SCADA 23
2
1. Introduction 25
The rapid growth in wind power needs fast improvements in technology. Up until now,
26
the industry has seen steady growth and it can be expected that growth show similartrend
27
in the future. The market forecasts that by 2018 the wind energy cumulative gigawatts
28
(GW) will be 43% higher than of 2015 ׳s GW [1]. Given these numbers and the high
29
initial investment needed to build a wind farm, we ask ourselves: "Can we not produce
30
more energy with the same amount of wind turbines?"; “it is possible to increase the
31
efficiency and performance of each wind turbine within an existent wind farm?”
32
Monitoring the state of any industrial process is nowadays an indispensable tool. Early
33
failure detection prevents major faults from occurring, allowing operation and
34
maintenance departments to have accurate information about the machine's operating
35
state. Also, performance improvement is significant when there are efficient maintenance
36
and adequate repair strategies. It is today acknowledge that improvement of the
37
operations and maintenance (O&M) practices can lead to a reduction of 21% and 11% of
38
the life-cycle costs of offshore and inland wind farms [2]. Therefore, studies of novel
39
methods serving the wind farm O&M procedures are extremely important and valuable.
40
With the development of technology wind turbines have increased in size. Consequently,
41
this has also led to a situation where components failures result in high costs. The most
42
important components, which will define the effective production of energy from a wind
43
turbine, are the gearbox and electrical generator. Wind turbine gearboxes handle several
44
megawatt of power, which means that a small efficiency increase can produce energy
45
useful for several more households [3]. Thus, to make wind energy competitive is
46
fundamental to increase gearbox efficiency, availability and reliability, for which is
47
important to quantify the main sources of power loss. Lubrication is a significant issue in
48
gearbox operation since the main power losses sources are friction loss between the
49
meshing teeth [4-6]. As such, monitoring the gearbox oil temperature can be the most
50
effective way to reduce the operational and maintenance costs of these systems and
51
increase their reliability. With good data acquisition (i.e. vibrations and temperature)
52
faults can be detected while components are operating which can lead to the
53
implementation of appropriate and timely actions to prevent damage or failure of the
54
turbine’ components [7].
3 Moreover, in order to reduce friction it is fundamental the oil selection to minimize wear
56
on the gear teeth and bearings, allowing optimized behaviour under the external
57
environmental conditions in which the turbine will operate [8]. As such, the selection of
58
a lubricant with appropriate physical properties promotes small no-load losses, which also
59
contributes to decrease the lubricant operating temperature [3,9]. No-load losses are
60
directly related to lubricant viscosity and density, as well as immersion depth of the
61
components on a sump-lubricated gearbox; while no-load rolling bearing losses depends
62
on type and size, arrangement, lubricant viscosity and immersion depth [4]. In addition,
63
transmission losses are primarily due to viscous friction of the gears and bearings turning
64
in oil [10].
65
Intermittent operation, a common situation with wind turbines, can also have a significant
66
impact on the life of a gearbox. When the turbine is not running, oil may drain away from
67
the gears and bearings, resulting in insufficient lubrication when the turbine starts
[10-68
12]. As well, under cold weather, the oil may have too high viscosity until the gearbox
69
has warmed up. Turbines in such environments may benefit by having gearbox oil heaters
70
since condensation of moisture may accelerate corrosion [13-17]. Over the last 2 decades
71
many lessons have been learnt by the industry with the main goal of improving gearboxes
72
reliability, since is one of the most expensive wind turbine sub-assemblies [18-23].
73
The gearbox reached thermal equilibrium when the operating temperature stabilizes, i.e.
74
when the power dissipated inside the gearbox is equal to the heat evacuated from gearbox
75
to the nacelle. The equilibrium temperature is dependent of the gearbox characteristics
76
and of the lubricant properties. A lower stabilization temperature means higher efficiency,
77
lower friction coefficient, smaller oil oxidation and longer oil life [24-25].
78
In general, and for wind industry practitioners, it is important to pay great attention to
79
data farming issues. This means that more precise fault definition and more advanced
80
fault-labelling systems need to be developed so that more informative and useful data can
81
be collected. As result, producers will have access to better and more accurate diagnoses
82
to evaluate the health status of their machines and it productivity [26]. The present paper
83
is focus on the analysis of real data from 12 different wind farms, which are monitored
84
and controlled by a Supervisory Control and Data Acquisition – the SCADA system. The
85
system is composed 93 by sensors or actuators that enable the monitoring and control of
86
geographically dispersed processes. It also allows communication between remote
4 stations and a control centre, providing important data and information for controlling the
88
operating process of the power electrical system. The occurrence of disturbances triggers
89
alarms, which warn operators that the system is in an anomalous situation, permitting
90
operators to intervene from the control centre. The SCADA data analysis methods has
91
been used recently to assess the importance of how wind turbines align in patterns to the
92
wind direction. Revealing itself as useful tool to evaluate wake effects in a wind farm
93
[27]. In present study, the SCADA data is analysed to assess the influence of the oil
94
formulation on energy production, by analysing oil temperatures inside gearboxes (i.e.
95
oil sump). The aim of the paper is to evaluate how lubricant selection affects gearbox
96
efficiency, and it influence on energy production losses.
97 98
2. Methods 99
Gearbox oil pressure and oil filter status are related to the gearbox oil pump, the pressure,
100
temperature and lubrication filters. Since temperature is a fundamental parameter in the
101
dynamic behaviour of the oil, conditioning gearbox efficiency and overall wind turbine
102
performance, the SCADA system is programmed to acquire data every 10 minutes of the
103
following parameters: outdoor temperature, temperature of the nacelle, main bearing
104
temperature, gearbox bearing temperature and gearbox oil temperature. The optimum
105
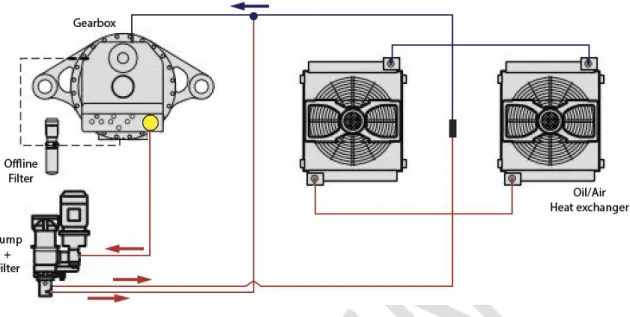
temperature for gearbox oil ranges between 45º C and 65º C. This optimum is ensured by
106
the cooling system (Figure 1). The temperature sensors work as follows: (i) if the
107
temperature at the opening of the thermostatic valve is ~45º C the oil circulates through
108
the heat exchangers, but the fans are not working; (ii) if temperature reaches 62º C both
109
fans of the two exchangers start working; (iii) the fans will turn off when the temperature
110
falls 5º C (i.e. 57º C at the opening of the thermostatic valve); (iv) the temperature to drive
111
the 2nd 120 speed of the mechanical pump is 58º C; and (v) the 2nd 121 pump shuts off
112
when oil temperature reaches again the 48º C. Periodic oil samples are collected on wind
113
turbine gearboxes (i.e. every six months) to assess the state of the oil, as well as to check
114
for signs of internal wear. Thus, if a value is over a certain maximum, the sampling
115
strategy is changed to monitor a given component preventing it failure.
116
Data such as rotational speed, power output, temperature 126 and efficiency from the last
117
6 years was analysed in which regards oil changes and its effect on performance. The
118
three types of oils (A, B and C, hereafter) are within the same viscosity grade (e.g. ISO
5 VG 320), and expected to have a viscosity of ~320 cSt at 40º C (Table 1). In order to
120
compare the influence of using different oils inside gearboxes, the SCADA data was first
121
filter to select turbines which: (1) worked with more than 1 or 2 types of oils inside the
122
gearbox; (2) the same amount of working hours; and (3) never had it gearbox replaced.
123
After these restrictions, the sample data reports to four wind turbines located in the Freita
124
Wind Park, North of Portugal (Figure 2, Table 2). The park has 18.4 MW of installed
125
power distributed for 8 Nordex N90/2300 turbines and is property of Iberwind
126
(www.iberwind.com). The annual estimated energy production of these devices is 40
127
GWh, traducing on a reduction of 26.637 ton CO2 emissions. The collected data was
128
cleaned to ensure that only data obtained during normal operation of the turbine was used
129
i.e. values were excluded from the database under the following circumstances: (1) wind
130
speed is out of the operating range; (2) wind turbine cannot operate because of a fault
131
condition; and (3) turbine is manually shut down or in a test or maintenance operating
132
mode. The filtered datasets were than analysed to evaluate wind energy production
133
efficiency depending of the type of oil used for different periods, applying bins method
134
[28]. The method is a data reduction procedure that groups test data for a certain
135
parameter into wind speed intervals (bins). These interval values are created on the
x-136
axis, y-axis, or both axis (e.g. wind speed versus oil temperature; oil temperature versus
137
active power), by calculating the mean of these intervals for both x and y values. For each
138
bin the number of data sets or samples and their sum are recorded, and the average
139
parameter value within each bin is calculated. In particular, the mean values of the
140
normalized wind speed, gearbox oil temperature and active power were determined using
141
interval bins of 0.5 m/s, 1º C and 1 kW, respectively.
142 143
3. Results
144
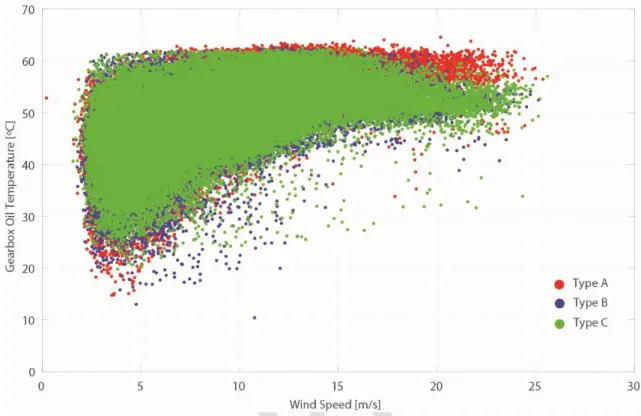
Figure 3 shows the oil temperatures changes as function of wind speed for the three
145
analysed oil types before applying the bin method. It can be observed the high number of
146
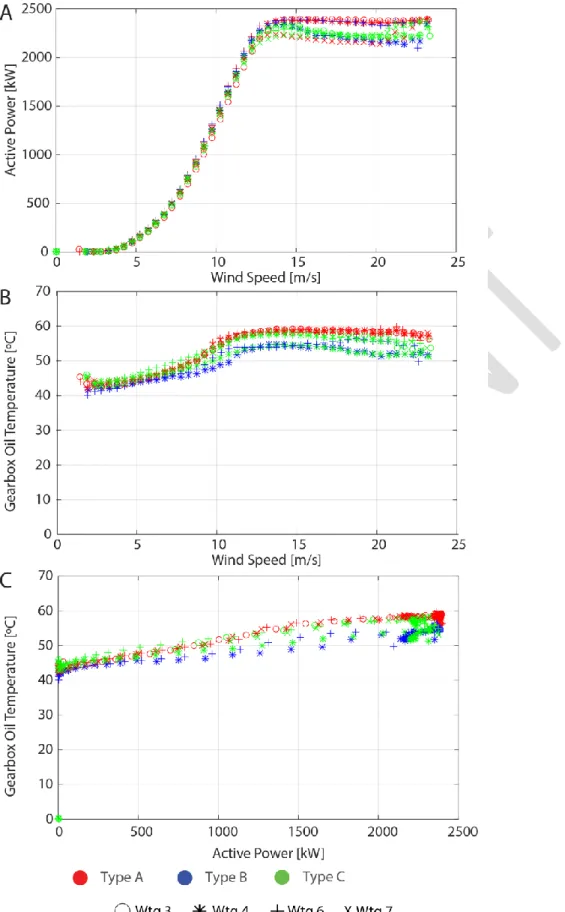
observations from the SCADA dataset before applying the bin method. Figure 4 shows
147
the results of the bin method for the four analysed wind turbine gearboxes (Wtg) and for
148
the three different oil types (Table 1) i.e. active 159 power curves as a function of velocity
149
(A); oil temperature inside gearboxes as a function of velocity (B); and oil temperature
150
inside gearboxes as a function of active power production (C). As it can be observed,
6 several changes occur on each pair of analyse parameters: as the wind turbine rotate
152
different powers curve are obtained using different oils types (Figure 4A), affecting
153
temperature inside the gearbox which tend to increase as turbine spins faster (Figure 4B).
154
The best lubricant supply is when the gear mesh achieve the lower temperature (Figure
155
4C).
156
In general, what Figure 4 shows is that for the same wind turbine at the same velocity
157
there are different power/efficiency behaviours with similar oil types (B and C, both
158
synthetic) and between an oil of different nature (type A, mineral). For a more detail
159
analysis of the results, each turbine is then analysed independently having into
160
consideration the type of oil and number of oil changes at the four wind turbine gearboxes
161
(Table 2). This is done because two turbines had two oil changes (i.e. Wtg#3, Wtg#7),
162
while the other two (i.e. Wtg#4, Wtg#6) were subjected to an additional one.
163
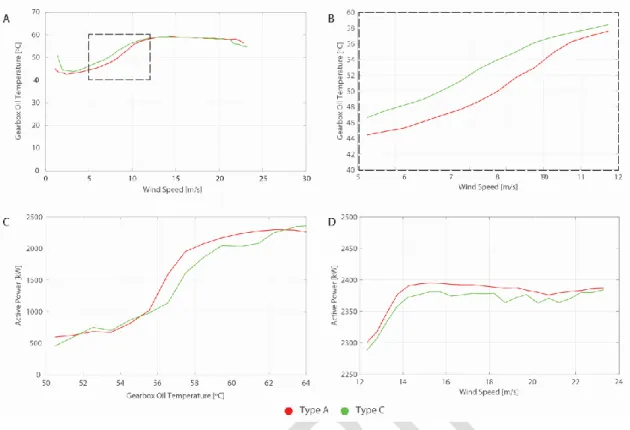
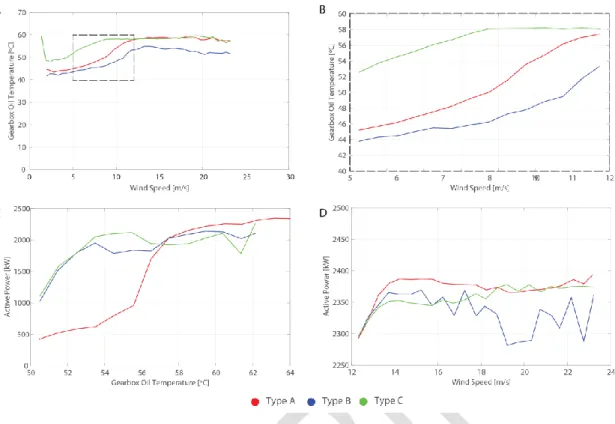
On Figure 5A it can be observed significant differences in the use of different types of
164
oils on wind turbine gearbox 3 (Wtg#3). The gearbox oil was changed from type A to C
165
i.e. mineral to synthetic. For the same wind turbine input speed, type C (synthetic) oil
166
achieves higher temperatures than type A (mineral). The greatest differences in
167
temperature are recorded within velocity range 5 to 12 m/s (Figure 5B). This corresponds
168
to the beginning of the turbine’s power curve, for which relates the largest number of
169
observations. Analysing the active power produced in the higher temperature range
170
(Figure 5C), i.e. between 50º C and 64º C, is observed that at an oil temperature of 58º C,
171
gearbox with type C produces 1700 kW, while type A records approximately 1900 kW.
172
It is also observed that, since the bins are "1° C", the range of values between 57 and 59°
173
C corresponds to the highest number of observations i.e. approximately 5700 data for
174
2000 kW of recorded power. Figure 5D shows differences of wind energy production
175
within the range of speeds between 12 and 15 m/s, since the largest differences are within
176
this range. It is observed that for an input velocity of 14 m/s, power differences between
177
oil types are close to 20 kW.
178
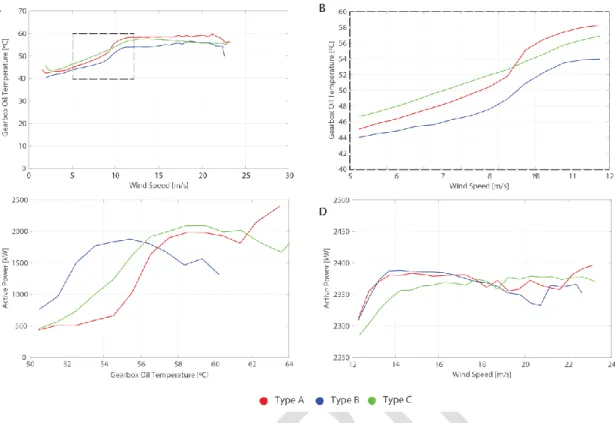
The gearbox of turbine number 4 (Wtg#4, Figure 6) experienced three different oils types.
179
Observing Figure 6A, it is possible to verify significant differences in temperature for the
180
same input speed. Again, oil type C registered the higher temperatures confirming the
181
results 192 obtained in turbine 3. Also, it is within the velocity range between 5 and 12
182
m/s that the largest temperature differences are recorded (Figure 6B), which corresponds
7 to the largest number of observations. All registers are found to be above 45° C, which
184
means that the oil is circulating in the heat exchanger and fans are not working. The data
185
also shows large differences in temperature at low speeds, reaching a maximum of 8º C
186
difference between two types of synthetic oils from different suppliers. Analysing the
187
active power produced in the higher temperature range (Figure 6C), i.e. between 50º C
188
and 62º C, results differ from turbine 3. At 54º C large differences in production can be
189
observed between the three types, but with increasing temperatures, those differences
190
disappear (i.e. 56.5° C bin). However, the continuous increase of temperature after this
191
point leads again to changes on active power production, with deficits of 150 kW between
192
oil type C and B and 200 kW between C and A, confirming that C type oil adversely
193
affects energy production. The active power difference is then analysed within the 12 and
194
24 m/s range (Figure 6D) where is observed that oil B presents the worst behaviour. This
195
is particular evident for velocities over 19 m/s, despite presenting lower temperatures
196
inside gearbox than type C. The major differences between type A and C on active power
197
production are recorded around ~18 m/s (~40 kW difference), with type A registering
198
better behaviour. However, at the maximum load area (i.e. input velocity ~20 m/s), the
199
two oils present a very similar performance.
200
The gearbox of turbine number 6 (Wtg#6, Figure 7) also experienced three different oils
201
types. Observing Figure 7A it is possible to verify significant differences in temperature
202
for the same input wind velocity. But this time, on contrary to turbine 4, type A presents
203
the higher temperatures inside gearbox for velocities over 10 m/s i.e. the beginning of
204
nominal wind speed. For lower velocities type C presents higher temperatures (Figure
205
7B). The largest production differences are recorded in the temperature range between
206
52° C and 56° C i.e. before the exchanger fans are turned on. For example, for a
207
production of 1500 kW, type B oil registers 52.5° C, type C ~54° C and type A ~56° C
208
(Figure 7C). The oil temperature increase at ~58.5º C shows a production difference of
209
500 kW, comparing oils type A and B; whereas differences between types A and C are
210
~50 kW. When analysing the active power difference within the 12 and 24 m/s range
211
(Figure 7D) it can be observed that oil B presents again the worst overall behaviour.
212
Again, a very similar performance to Wtg#4 is registered 224 by comparing type A and
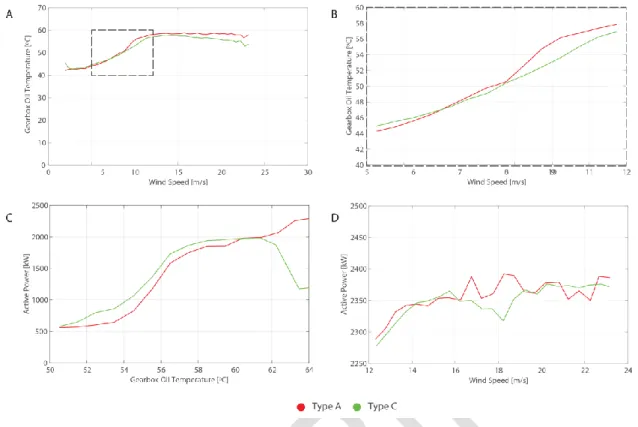
213
C oils at the maximum load area of the turbine (i.e. 20 m/s). The gearbox of turbine 7
214
experienced the use of two oils as turbine 3 (Figure 8). However, on the contrary of
8 turbine 3, type A achieves higher temperatures (Figure 8A), although those differences
216
are only noticeable over 9 m/s (Figure 8B). In terms of production, the largest differences
217
were recorded between 52° C and 57° C i.e. before the exchanger fans are turned on. For
218
example, for a production of 1500 kW, oil type C registers 56º C, while type A oil
219
registers 56,2º C. Highest differences of ~1º C are observed at 1000 kW. The increase of
220
oil temperature over ~60º C has negligible effect on production. It is within the 12 and 24
221
m/s range that highest differences are recorded on active power production, registering a
222
maximum of plus 80 kW using type A oil at 18.2 m/s. But, overall, it is observed a very
223
random behaviour between the two types. Once more, a very similar performance is
224
registered at the maximum load area of the turbine (i.e. 20 m/s).
225
The analyses of oil samples collected on the different gearboxes confirm the above results
226
(Table 3). The reference values of viscosity at 40º C (Table 1) for the three analysed oils
227
are 320 cSt (type A), 320 cSt (type B) and 325 cSt (type C). Table 3 shows oil viscosity
228
analysis after use, where it can be observed that the main changes on viscosity occur for
229
type B and C oils. A maximum drop from 320 to 306.93 cSt is verified in oil type B on
230
turbine 4. Because oil type A registers, in general, lower temperatures, it positively
231
influences the non-change of viscosity at 40 ºC.
232
The analysis of viscosity at 100º C reveals similar trends. The reference values of
233
viscosity at 100º C (Table 1) for the three analysed oils are 24.1 cSt (type A), 35.1 cSt
234
(type B) and 34.9 cSt (type C). Again, oil types B and C show increase degradation, with
235
maximum changes occurring once again on type B oil, dropping from 35.1 to 31.38 cSt
236
on turbine 6. Turbine 4 using type B oil also show a significant decrease (e.g. drop to
237
32.14 cSt). Gearboxes using type C oil also show average decreases in the order of 3 cSt
238
for all the turbines, except in turbine 7. However, turbine 7 was the one registering smaller
239
differences of temperatures within all power operation range, but also smaller active
240
power productions. Finally, the reference values of viscosity index (ASTM D 2270, Table
241
1) for the three analysed oils are 96 (type A), 155 (type B) and 152 (type C). Major
242
changes occur on gearbox of turbine 4 (Table 3) when using type B oil (drop from 155 to
243
145) and type C oil (dr 256 op from 152 to 147). Negligible variations are showed on
244
gearboxes using type A oil.
245 246 247
9
4. Discussion 248
Conditioning monitoring of gearbox systems is essential for mechanical system reliability
249
management [29]. The today use of control systems such as SCADA able the access to a
250
large amount of real time sensor data that can be used to prevent turbine failures and loss
251
of efficiencies. Wind industry has been attempting to integrate SCADA and Conditioning
252
Monitoring Systems (CMS) data to detect, diagnose and predict gearbox failures [30]. In
253
that sense, oil and lubrication analysis is one among many important
condition-254
monitoring approaches. Oil cleanness, viscosity and temperature give insight onto how
255
the gearbox of any wind turbine is performing [31].
256
As an example, the today understanding of the mechanisms involved in pitting damage is
257
still incomplete. This is partly due to large number of influencing factors that must be
258
taken into account when studying Rolling Contact Fatigue. Indeed, literature underlines
259
the impact of tribological parameters (loading, contact conditions and lubricant viscosity
260
[32]) together with material parameters (steel composition, thermo-chemical treatment,
261
surface roughness and residual stresses) and environmental parameters (temperature,
262
humidity and lubricant chemistry [33]). But, amongst all these parameters, it is today well
263
known that lubrication has a significant influence on Rolling Contact Fatigue and on
264
pitting, in particular [34].
265
The results presented within this study are based on relations established between the
266
active power curves and wind velocity; oil temperature inside gearboxes and wind
267
velocity; and oil temperature inside gearboxes and active power production. The propose
268
was to analyse how lubricant selection affects gearbox efficiency and overall energy
269
production by analysing real data from wind farms.
270
Overall, results show that, most of the time, the temperature of mineral oil (type A) was
271
lower than synthetic type oils (type B and C) for the same input velocities. Moreover,
272
gearboxes working with type A oil performed better than gearboxes with type B or C oils.
273
In some cases, performance differences achieved maximum of 200 kW in active
274
production (e.g. #Wtg3 at 50º C, Figure 4 between Type A and C oils). There is a direct
275
relation between oil quality inside gearboxes with energy efficiency. A maximum
276
viscosity drop from 320 to 306.93 cSt was verified 288 in oil type B on turbine number
277
4. Also, it is within the velocity range between 5 and 12 m/s that the largest temperature
278
differences are recorded (Figure 6B), which corresponds to the largest number of
10 observations, meaning that this particular turbine has worked most of the time within this
280
velocity range.
281
This is an important result since the most common gear failures (e.g. wear, scuffing,
282
micropitting, pitting, etc) are influenced by the oil temperature in the lubrication system
283
[35]. As a direct result of viscosity and additives decrease, several studies recorded pitting
284
initiation, suggesting that lubricant additives can promote crack initiation by creating
285
corrosion pits on steel surfaces [36, 37]. This because high temperatures are linked with
286
a decrease of oil viscosity, producing thin lubricant films in the gear mesh which can
287
affect performance. For example, the formation of a tribofilm from Zinc Dialkyl Dithio
288
Phosphate (ZDDP), an anti-wear additive, can also promote crack initiation by preventing
289
surfaces roughness reduction during running-in [38].
290
Higher temperatures can also lead to higher stress on the material composing the gearbox
291
system e.g. for gear oils with additives higher temperatures correspond with higher
292
chemical activity [35]. As an example, Nutakor et al [39] studied how the design
293
parameters of planetary gear sets, bearings and lubricant properties influence the wind
294
turbine performance. The authors concluded that decreasing oil viscosity by increasing
295
oil temperature results in significant increase of bearing mechanical power losses inside
296
of the gearbox on a planetary gear.
297
A gearbox is the component with more operational complexity and unit cost [40] and
298
therefore vibration data and oil condition data has been used as the main input in
299
behavioural models, neural networks, finite element modelling and statistical methods to
300
predict gearbox failures. As an example, an approach for utilization of SCADA data for
301
conditioning monitoring by means of artificial neural networks (ANN) was recently
302
developed [41]. The approach was based on creating normal behaviour models for critical
303
components by closely monitoring gearbox oil temperature, enabling to detect anomalous
304
operations.
305
The present paper results add to the literature by presenting a clear case study of the
306
relation between oil temperature and viscosity inside gearboxes with energy efficiency,
307
which can be further use on ANN training to detect and prevent gearbox failures and
308
optimize oil changing procedures. What appears clear from the results is that oil
309
characteristics play a significant role on efficiency 321 losses, strongly highlighted by the
310
analysis of gearboxes that experienced the usage of the three different oil types. It is also
11 evident that mineral type A presents better performance than synthetic B and C types. An
312
interesting fact is that although type B shows lower temperatures than type A, there is no
313
positive effect on production. In fact, gearboxes working with oil type B show a drop on
314
production between the 12 and 24 m/s range (e.g. #Wtg4, Figure 6). This type B oil is
315
currently being withdrawn by the promotor from several turbines of different wind farms
316
due to it poor performance; and because of the change in the viscosity index after 1 year
317
of operation. The type C oil is the one presenting worse results, both in terms of
318
temperature and active power production. This is a general trend at all the turbines that
319
use this oil on their gearbox.
320
Another interesting aspect relates with the behavioural of the temperature using different
321
oil types along the active power curve. Within the maximum turbine load area, comprised
322
between the achievement of the rated output and cut-off speeds (i.e. wind over ~14 m/s),
323
type A and C register a very similar behaviour. In fact, and observing gearbox of turbine
324
6 (#Wtg6, Figure 7) working with oil type A, higher temperatures are recorded, which
325
adversely affects performance. However, this result is not pronounced and is particular to
326
this area of the power curve, restricted to fewer observations when compared to the data
327
collected between the cut-in and rated power speed curve area, where type A oils always
328
performs better.
329
Finally, the papers shows the capability of the proposed method on identifying different
330
out-put power behaviours linked to oil temperature; and how to identify possible failures
331
through temperature patterns. Oil temperature indicator can be used as a complement in
332
Condition Monitoring Systems (CMS), which have been primarily focused on measuring
333
the particle contamination in the lubricant fluid [42]. The close monitoring of this
334
parameter by O&M managers will allow then to have sufficient time to plan up-tower
335
repairs, by enabling them to reduce downtime, heavy equipment and logistics costs and,
336
most important, preventing consequential failures in the entire gearbox system.
337 338
5. Conclusions 339
This paper analysed time-series of active power production and it relation to oil
340
temperature inside gearboxes using SCADA 354 data, supported by regular viscosity oil
341
analysis. The main conclusion from the result analysis are: (i) temperature inside
342
gearboxes working with mineral oils were lower than synthetic oil types; (ii) there is a
12 direct relation between oil characteristics and energy efficiency i.e. gearboxes working
344
with mineral oil perform better then gearboxes working with synthetic oils. Those
345
differences are significant, achieving maximums of 200 kW differences on active power
346
production; (iii) oils of similar nature (i.e. synthetic) present significant differences on
347
performance, and even oils that resist to a temperature increase can show worst
348
performance on active power production; and (iv) finally, degradation of oil was
349
influenced by the temperature rise and viscosity decrease, showing that temperature
350
behaviour along the active power curve is strongly related to oil type characteristics.
351
The close monitoring of these parameters inside the gearbox reveal vital in order to
352
evaluate performance drops and can be used to detect mechanical faults as well as to
353
extend the lifetime of the components. In order to increase the gearbox reliability it would
354
be necessary to complement the above analysis with the study of the particle count (i.e.
355
oil debris) and evaluate it effect on the overall energy production.
356
Notation
357
Toil - oil sump temperature (ºC) 358
359
Acknowledgements
360
The paper is a contribution to the SCORE project, funded by the Portuguese Foundation
361
for Science and Technology (FCT – PTDC/AAG-TEC/1710/2014) and MONITOR
362
project, funded by the Atlantic Area (EAPA_333/2016). André Pacheco was supported
363
by the Portuguese Foundation for Science and Technology under the Portuguese
364
Researchers’ Programme 2014 entitled “Exploring new concepts for extracting energy
365
from tides” (IF/00286/2014/CP1234). Eduardo G-Gorbeña has received funding for the
366
OpTiCA project from the Marie Skłodowska-Curie Actions of the European Union's
367
H2020-MSCA-IF-EF-RI-2016 / under REA grant agreement n° [748747]. The authors
368
acknowledge IberWind for supplying all data measurements.
369
370
371
13
References
373
[1] WWEA - World Wind Energy Association, “WWEA half-year report: world wind
374
capacity reached 456 GW,” 10 Outubro 2016. [Online]. Available:
375
http://www.wwindea.org/. [Accessed 15.12.2017].
376
[2] Sheng, S. Prognostics and Health Management of Wind Turbines: Current Status
377
and Future Opportunities, National Renewable Energy Laboratory, Golden, CO; 2015.
378
https://www.nrel.gov/docs/fy16osti/65605.pdf [Accessed 31.08.2018].
379
[3] Fernandes, C. M., Blazquez, L., Sanesteban, J., Martins, R., Seabra, J. Energy
380
efficiency tests in a full scale wind turbine gearbox. Tribology International, 2016.
381
https://doi.org/10.1016/j.triboint.2016.05.001
382
[4] Fernandes CM., Marques PM., Martins RC., Seabra JH. Gearbox power loss. Part
383
III: application to a parallel axis and a planetary gearbox. Tribol Int 2015;88 (0):317–
384
26. http://dx.doi.org/10.1016/j.triboint.2015.03.029
385
[5] Marques, P.M., Camacho, R., Martins R.C., Seabra, J.H. Efficiency of a planetary
386
multiplier gearbox: Influence of operating conditions and gear oil formulation.
387
Tribology International 2015; 92: 272–280.
388
https://doi.org/10.1016/j.triboint.2015.06.018
389
[6] Wang, Y., Song, G., Niu, W., Chen, Y. Influence of oil injection methods on the
390
lubrication process of high speed spur gears. Tribology International 2018; 121: 180–
391
189. https://doi.org/10.1016/j.triboint.2018.01.062
392
[7] Shanbra, S., Elashab, F., Elforjanic, M. Teixeira, J. Detection of natural crack in
393
wind turbine gearbox. Renewable Energy, 2018; 118: 172-179.
394
https://doi.org/10.1016/j.renene.2017.10.104
395
[8] Zhang, Y., Lu, W., Chu, F. Planet gear fault localization for wind turbine gearbox
396
using acoustic emission signals. Renewable Energy 2017; 109: 449-460.
397
https://doi.org/10.1016/j.renene.2017.03.035
398
[9] Lapira, E., Brisset, D., ardakani, H.D., Siegel, D., Lee, J. Wind turbine performance
399
assessment using multi-regime modelling approach. Renewable Energy 2012; 45:
86-400
95. https://doi:10.1016/j.renene.2012.02.018
14 [10] Magalhães, L., Martins, R., Locateli, C., Seabra, J. Influence of tooth profile and
402
oil formulation on gear power loss. Tribology international, 36th Leeds–Lyon
403
symposium, vol. 43(10); 2010. p. 1861–71. Special issue: multi-facets of tribology.
404
http://dx.doi.org/10.1016/j.triboint.2009.10.001
405
[11] Eschmann P, Hasbargen L, Weigand K. Ball and roller bearings—theory, design,
406
and application. John Wiley and Sons; 1985.
407
[12] Marques PM, Fernandes CM, Martins RC, Seabra JH. Efficiency of a gearbox
408
lubricated with wind turbine gear oils. Tribology International 2014; 71:7–16,
409
https://doi.org/10.1016/j.triboint.2013.10.017
410
[13] Lin, Y., Tu, L., Liu, H., Li, W. Fault analysis of wind turbines in China. Renewable
411
and Sustainable Energy Reviews 2016; 55: 482–490.
412
http://dx.doi.org/10.1016/j.rser.2015.10.149
413
[14] Zhou KP. Research and design of fault diagnosis system for direct-driven
414
synchronous wind turbine [Master's thesis]. Changsha: Central South Univ.; 2010.
415
[15] Ma HZ, Shi WJ, Han JD, Chen JN, Chen TT. Double-fed induction generator
416
rotor fault diagnosis considering control strategies of rotor-side converters. Proc CSEE
417
2013;33:1–7.
418
[16] Li R, Gao, QS, Liu, W. Characteristics of direct-driven permanent magnet syn-
419
chronous wind power generator under symmetrical three-phase short-circuit fault.
420
Power System Technology, 2011; 35:153–8.
421
[17] Entezami M, Hillmansen S, Weston P, Papaelias MP. Fault detection and diagnosis
422
within a wind turbine mechanical braking system using condition monitoring.
423
Renewable Energy 2012; 47:175–82. https://doi.org/10.1016/j.renene.2012.04.031
424
[18] Rose J, Hiskens IA. Estimating wind turbine parameters and quantifying their
425
effects on dynamic behavior. IEEE Power & Energy Society General Meeting; Jul.
426
2008:1-7. https://doi.org/10.1109/PES.2008.4596862
427
[19] Spinato, F., Tavner, P.J., van Bussel, G.J.W., Koutoulakos, E. Reliability of wind
428
turbine subassemblies. IET Renew Power Gen 2009; 3:387–401.
429
http://dx.doi.org/10.1049/iet-rpg.2008.0060
15 [20] Ziegler, L., Gonzalez, H., Rubert, T., Smolka, U., Melero, J. Lifetime extension of
431
onshore wind turbines: A review covering Germany, Spain, Denmark, and the UK.
432
Renewable and Sustainable Energy Reviews, 2018; 82:1261–1271.
433
http://dx.doi.org/10.1016/j.rser.2017.09.100
434
[21] H. Arabian-Hoseynabadi, H. Oraee, P.J. Tavner. Failure Modes and Effects
435
Analysis (FMEA) for Wind Turbines, Int. J. Electrical Power Energy System, 2010;
436
32(7):817-824. https://doi.org/10.1016/j.ijepes.2010.01.019
437
[22] RELIAWIND project. European Union's Seventh Framework Programme for
438
RTD (FP7).
http://windpower.sandia.gov/2009Reliability/PDFs/Day2-13-439
MichaelWilkinson.pdf (accessed 22.01.2018)
440
[23] Tavner P. Offshore Wind Turbines: Reliability, Availability and Maintenance.
441
London: Institution of Engineering and Technology; 2012.
442
[24] Touret, T., Changenet, C., Ville, F., Lalmi, M., Becquerelle, S. On the use of
443
temperature for online condition monitoring of geared systems – A review, Mechanical
444
Systems and Signal Processing 2018; 101:197–210.
445
http://dx.doi.org/10.1016/j.ymssp.2017.07.044
446
[25] Marques, P.M., Fernandes, C.M., Martins, R.C., Seabra, J.H. Power losses at low
447
speed in a gearbox lubricated with wind turbine gear oils with special focus on churning
448
losses. Tribology International 2013; 62:186–97.
http://dx.doi.org/10.1016/j.tri-449
boint.2013.02.026.
450
[26] Song, Z., Zhang, Z., Jiang, Zhu, J. Wind turbine health state monitoring based on a
451
Bayesian data-driven approach. Renewable Energy, 2018; 125:172-181.
452
https://doi.org/10.1016/j.renene.2018.02.096
453
[27] Castellani, F., Astolfi, D., Sdringola, P., Proietti, S., Terzi, L. Analyzing wind turbine
454
directional behavior: SCADA data mining techniques for efficiency and power
455
assessment. Applied Energy, 2017; 185:1076-1086.
456
http://dx.doi.org/10.1016/j.apenergy.2015.12.049
457
[28] Wind Turbine Power Performance IEC 61400-12-1, Power performance
458
measurements according to the international guidelines, IEC 61400-12-1.
16 [29] T. Toureta, C. Changenetb, F. Villea, M. Lalmic, S. Becquerellec. On the use of
460
temperature for online condition monitoring of geared systems. Mechanical Systems and
461
Signal Processing 2018; 101:197-210. http://dx.doi.org/10.1016/j.ymssp.2017.07.044
462
[30] Feng, Y., Qiu, Y., Crabtree, C., Long, H. Tavner, P. Monitoring Wind Turbine
463
Gearboxes. Wind Energy 2013; 16:728-740. https://doi.org/10.1002/we.1521
464
[31] Salameh, J., Cauet, S., Etien, E., Sakout, A., Rambault, L. Gearbox condition
465
monitoring in wind turbines: A review. Mechanical Systems and Signal Processing 2018;
466
111:251–264. https://doi.org/10.1016/j.ymssp.2018.03.052
467
[32] Nélias, D., Dumont, M.L., Champiot, F., Vincent, A., Flamand, L., Role of
468
inclusions, surface roughness and operating conditions on rolling contact fatigue, Journal
469
of Tribololgy., 1999; 121:240-250. https://doi.org/10.1115/1.2833927
470
[33] Littmann, W.E., Kelley, B., Anderson, W.J., Fein, R.S., Klaus, E., Sibley, L.B.,
471
Winer, W., Chemical effects of lubrication in contact fatigue − 3. load-life exponent, life
472
scatter, and overall analysis, Journal of Lubrication Technology, ASME,1976;
98:308-473
318. https://doi.org/10.1115/1.3452832
474
[34] Hostis, B., Minfraya, C., Frégonèse, M., Verdub, C., Ter-Ovanessian, B., Vachera,
475
B., Le Mognea, T., Jarnias, F., D’Ambrose, A., Influence of lubricant formulation on
476
rolling contact fatigue of gears – interaction of lubricant additives with fatigue cracks,
477
Wear, 2017; 382-383: 113-122. https://doi.org/10.1016/j.wear.2017.04.025
478
[35] B.R. HÖhn , K. Michaelis. Influence of oil temperature on gear failures. Tribology
479
International 37, 2004; 103–109. https://doi.org/10.1016/S0301-679X(03)00047-1
480
[36] Cardis, A.B. Gear oil micropitting evaluation, Gear Technolology; 2000; 17: 30-35.
481
[37] L’Hostis, B., Minfraya, C., Frégonèse, M., Verdub, C., Ter-Ovanessian, B., Vacher,
482
B., Le Mogne, T., Jarnias, F., D’Ambros, A. Influence of lubricant formulation on rolling
483
contact fatigue of gears – interaction of lubricant additives with fatigue cracks, Wear,
484
2017; Volumes 382–383:113-122. https://doi.org/10.1016/j.wear.2017.04.025
485
[38] Lainé, A., Olver, A., Lekstrom, M., Shollock, B., Beveridge, T., Hua, D. The effect
486
of a friction modifier additive on micropitting; Tribology Transactions, 2009;
52:526-487
533. https://doi.org/10.1080/10402000902745507
17 [39] Nutakor, C., Kłodowski, A., Sopanen, J., Mikkola, A., Pedrero, J. Planetary gear sets
489
power loss modeling: Application to wind turbines. Tribology International, 2017;
490
105:42–54. http://dx.doi.org/10.1016/j.triboint.2016.09.029
491
[40] Leite, G., Araújo, A., Rosas, P. Prognostic techniques applied to maintenance of
492
wind turbines: a concise and specific review. Renewable and Sustainable Energy
493
Reviews, 2018; 81:1917–1925. http://dx.doi.org/10.1016/j.rser.2017.06.002
494
[41] Bangalore, P., Patriksson, M. Analysis of SCADA data for early fault detection, with
495
application to the maintenance management of wind turbines. Renewable Energy, 2018;
496
115: 521-532. http://dx.doi.org/10.1016/j.renene.2017.08.073
497
[42] Willis, D, Niezrecki, C., Kuchma, D., Hines, E., Arwade, S., Barthelmie, R.,
498
DiPaola, M., Drane, P., Hansen, C., Inalpolat, M., Mack, J., Myers, A., Rotea,M. Wind
499
energy research: State-of-the-art and future research directions, Renewable Energy, 2018;
500 125:133-154. https://doi.org/10.1016/j.renene.2018.02.049 501 502 503 504 505 506 507 508 509 510 511 512 513 514 515
18
FIGURE CAPTIONS 516
517
Figure 1. Gearbox cooling circuit. The gearbox is provided with a combined splash / circulatory lubricating
518
system. The cooled and filtered oil is fed to the gearbox through a distributor (blue point) which distributes
519
it to the bearings through internal pipes and the borings (blue arrow). The oil pressure is approx. 2.5 – 3
520
bar at an oil sump temperature of 60°C. The gear case of the helical gearbox is fitted, below the oil level,
521
with the screw-in heaters with replaceable heating rods (yellow circle on gearbox). The heaters must be
522
switched on when the oil sump temperature drops below +5°C (red lines and arrows), cooling the oil. The
523
switch-off point lies between +10°C and +15°C. Monitoring is ensured by the above mentioned resistance
524
thermometers.
19
20 Figure 2. (A) Freita’ Wind Park, Arouca (Portugal). On the image in white are represented the four turbines
527
operating since 2006 and without gearboxes replacements; (B) Power curve of the NORDEX N90-R80
528
turbines and characteristics.
529
530
Figure 3. Example of the pre filter raw data from the SCADA system showing the relation between the
531
gearbox temperature (ºC) and wind speed (m/s) for different oil types. Example is from the wind turbine 3
532
of the Freita’ Wind Park, Arouca (Portugal).
21
534
Figure 4. Bin method results for the four analysed wind turbine gearboxes (Wtg) and for the three different
535
oil types: (A) active power curves as a function of wind speed; (B) oil temperature inside gearboxes as a
536
function of wind speed; (C) oil temperature inside gearboxes as a function of active power production.
22
538
Figure 5. (A) Relation between gearbox oil temperature and wind speed velocity after oil replacement from
539
type A to C on turbine 3; (B) zoom in to the velocity range where most measurements were registered and
540
where the highest temperature differences were observed; (C) active power produced in the higher
541
temperature range, showing significant differences at an oil temperature of 58º C; and (D) differences of
542
wind energy production within the range of speeds between 12 and 15 m/s, registering the largest
543
differences (~20 kW).
23
545
Figure 6. (A) Relation between gearbox oil temperature and wind speed velocity after oil replacements on
546
turbine 4 which experienced the three different oils types; (B) zoom in to the velocity range where most
547
measurements were registered and where the highest temperature differences were observed; (C) active
548
power produced in the higher temperature range, showing that the largest production differences are
549
recorded in the temperature range between 52° C and 56° C; and (D) differences of wind energy production
550
within the range of speeds between 12 and 24 m/s, where it is observed the poorest performance when using
551
oil B.
24
553
Figure 7. (A) Relation between gearbox oil temperature and wind speed velocity after oil replacements on
554
turbine 6 which experienced the three different oils types; (B) zoom in to the velocity range where most
555
measurements were registered, where is observed that type A presents the higher temperatures inside
556
gearbox for velocities over 10 m/s i.e. the beginning of nominal wind speed; (C) active power produced in
557
the higher temperature range, showing that the largest production differences are recorded in the
558
temperature range between 52° C and 56° C; and (D) differences of wind energy production within the
559
range of speeds between 12 and 24 m/s, where it is observed again the poorest performance when using oil
560
B.
25
562
Figure 8. (A) Relation between gearbox oil temperature and wind speed velocity after oil replacements on
563
turbine 7 which experienced two different oils types; (B) zoom in to the velocity range where most
564
measurements were registered. In this case temperature differences are only noticeable over 9 m/s; (C) the
565
largest differences on active power production occur between 52° C and 57° C i.e. before the exchanger
566
fans are turned on; and (D) overall negligible differences of wind energy production within the range of
567
speeds between 12 and 24 m/s, registering a maximum of plus 80 kW using type A oil at 18.2 m/s.
568 569 570 571 572
26
TABLE CAPTIONS 573
Table 1. Types of oil and characteristics used on the NORDEX N90 gearboxes.
574
A B C
Type Mineral (MINR) Synthetic polyalphaolefin (PAO)
ISO Viscosity Grade 320 320 320
Viscosity, ASTM D 445, cSt @ 40ºC 320 320 325
Viscosity, ASTM D 445, cSt @
100ºC 24.1 35.1 34.9
Viscosity Index, ASTM D 2270 96 155 152
Density @15 ºC 0.903 0.943 0.854 Flash Point (º C) 268 280 250 Fusion Point (º C) -18 -33 -33 Chemical Properties Calcium (Ca mg/kg) 7 5 1511 Magnesium (Mg mg/kg) 0 0 3 Boron (B mg/kg) 0 0 0 Zinc (Zn mg/kg) 51 29 4 Phosphorus (P mg/kg) 203 200 311 Barium (Ba mg/kg) 0 0 0 Molybdenum (Mo mg/kg) 2 0 808 Sulphur (S mg/kg) 13258 3013 2586 A B C
Type Mineral (MINR) Synthetic polyalphaolefin (PAO)
ISO Viscosity Grade 320 320 320
Viscosity, ASTM D 445, cSt @ 40ºC 320 320 325
Viscosity, ASTM D 445, cSt @
100ºC 24.1 35.1 34.9
Viscosity Index, ASTM D 2270 96 155 152
Density @15 ºC 0.903 0.943 0.854 Flash Point (º C) 268 280 250 Fusion Point (º C) -18 -33 -33 Chemical Properties Calcium (Ca mg/kg) 7 5 1511 Magnesium (Mg mg/kg) 0 0 3 Boron (B mg/kg) 0 0 0 Zinc (Zn mg/kg) 51 29 4 Phosphorus (P mg/kg) 203 200 311 Barium (Ba mg/kg) 0 0 0 Molybdenum (Mo mg/kg) 2 0 808 Sulphur (S mg/kg) 13258 3013 2586 575
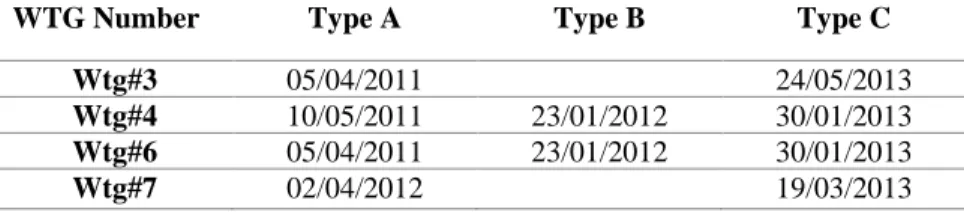
Table 2. Wind turbine gearbox (WTG) exchange dates and used oils types on the NORDEX N90 gearboxes.
576
WTG Number Type A Type B Type C
Wtg#3 05/04/2011 24/05/2013
Wtg#4 10/05/2011 23/01/2012 30/01/2013
Wtg#6 05/04/2011 23/01/2012 30/01/2013
Wtg#7 02/04/2012 19/03/2013
27 Table 3. Sampling results on oil viscosity for the different turbine gearboxes.
578
Wind Gearbox (#Wtg) #Wtg3 #Wtg4 #Wtg6 #Wtg7
Oil Type A C A B C A B C A C
Viscosity, ASTM D 445, cSt @ 40ºC 315.96 313.16 314.28 306.93 307.78 309.58 308.85 304.77 316.17 312.48
Viscosity, ASTM D 445, cSt @ 100ºC 23.54 32.00 23.56 32.14 32.51 23.50 31.38 32.78 23.60 34.22
Viscosity Index, ASTM D 2270 94 142 93 145 147 95 140 149 94 154
579 580
28
Highlights
• Analysis of real data from wind farms monitored and controlled by SCADA system
• Relations established between lubricant selection and the active power production
• Direct relation observed between oil characteristics and energy efficiency • Gearboxes working with oils of similar nature result in differences on
performance