www.atmos-chem-phys.net/10/4661/2010/ doi:10.5194/acp-10-4661-2010
© Author(s) 2010. CC Attribution 3.0 License.
Chemistry
and Physics
Trends in long-term gaseous mercury observations in the Arctic and
effects of temperature and other atmospheric conditions
A. S. Cole and A. Steffen
Air Quality Research Division, Environment Canada, 4905 Dufferin St., Toronto, Ontario, M3H 5T4, Canada Received: 1 December 2009 – Published in Atmos. Chem. Phys. Discuss.: 16 December 2009
Revised: 6 May 2010 – Accepted: 7 May 2010 – Published: 21 May 2010
Abstract. Gaseous elemental mercury (GEM) measure-ments at Alert, Canada, from 1995 to 2007 were analyzed for statistical time trends and for correlations with meteo-rological and climate data. A significant decreasing trend in annual GEM concentration is reported at Alert, with an estimated slope of−0.0086 ng m−3yr−1(−0.6% yr−1)over
this 13-year period. It is shown that there has been a shift in the month of minimum mean GEM concentration from May to April due to a change in the timing of springtime atmospheric mercury depletion events (AMDEs). These AMDEs are found to decrease with increasing local tem-perature within each month, both at Alert and at Amderma, Russia. These results support the temperature dependence suggested by previous experimental results and theoretical kinetic calculations on both bromine generation and mercury oxidation and highlight the potential for changes in Arctic mercury chemistry with climate. A correlation between total monthly AMDEs at Alert and the Polar/Eurasian Telecon-nection Index was observed only in March, perhaps due to higher GEM inputs in early spring in those years with a weak polar vortex. A correlation of AMDEs at Alert with wind di-rection supports the origin of mercury depletion events over the Arctic Ocean, in agreement with a previous trajectory study of ozone depletion events. Interannual variability in total monthly depletion event frequency at Alert does not ap-pear to correlate significantly with total or first-year northern hemispheric sea ice area or with other major teleconnection patterns. Nor do AMDEs at either Alert or Amderma corre-late with local wind speed, as might be expected if depletion events are sustained by stable, low-turbulence atmospheric conditions. The data presented here – both the change in
Correspondence to:A. S. Cole ([email protected])
timing of depletion events and their relationship with tem-perature – can be used as additional constraints to improve the ability of models to predict the cycling and deposition of mercury in the Arctic.
1 Introduction
Mercury in the Arctic is of particular interest for two reasons. From a health perspective, mercury is found in high levels in Arctic wildlife and in some populations despite there being no major mercury sources nearby. For atmospheric scientists, monitoring of atmospheric mercury revealed unusual “atmo-spheric mercury depletion events” (AMDEs) in which mer-cury concentrations drop precipitously on timescales of a few hours (Schroeder et al., 1998). This interest has led to a great deal of research on mercury cycling in polar regions in re-cent years (see Steffen et al., 2008; Nguyen et al., 2009; and references therein). Based on research to date, these AMDEs are believed to be due to chemical oxidation by halogen radi-cals of long-lived gaseous elemental mercury (GEM, or Hg0)
to much more quickly deposited reactive gaseous mercury compounds (RGM) and particle-bound mercury (PHg), and are estimated to contribute as much as 30–55% of the total atmospheric mercury deposited to the Arctic annually (Ariya et al., 2004; Christensen et al., 2004; Skov et al., 2004; Das-toor et al., 2008). As the Arctic undergoes dramatic change due to reduced sea ice and warming temperatures (Cosimo, 2006), it is crucial to understand how climate change may affect the frequency and magnitude of AMDEs in the future in order to predict future inputs of mercury to polar regions.
by climate. Theoretical calculations predict that the net ox-idation of Hg0to HgBr2by bromine radicals – a likely
oxi-dation pathway during AMDEs – will be much faster at low temperatures (Goodsite et al., 2004). The origin of high lev-els of bromine radicals (“bromine explosions”) appears to be heterogeneous reactions with bromide ions (Br−)in snow, ice and/or aerosol, where sea salt is the original source of bromide (Vogt et al., 1996; Fan and Jacob, 1992). The pro-ductivity of these reactions may be inversely temperature-dependent, as suggested by laboratory experiments on ice (Adams et al., 2002; Koop et al., 2000) and predicted by calculations accounting for low-temperature acidification of sea-salt aerosol (Sander et al., 2006), though it is still uncer-tain if these calculations are representative of natural systems (Morin et al., 2008). Additionally, bromine explosions, and by extension both ozone depletion events and AMDEs, may be tied to snow and ice characteristics through frost flow-ers (Kaleschke et al., 2004), first-year sea ice (Simpson et al., 2007), and inland snow pack chemistry (Simpson et al., 2005; Piot and von Glasow, 2008), all of which would be sensitive to climate change. Finally, a short field study at Mc-Murdo, Antarctica, showed a correlation between GEM and air temperature although it was not clear if temperature was the direct cause of the GEM variability (Brooks et al., 2008). However, there has not yet been an analysis directly linking mercury depletion events and temperature during long-term monitoring.
In addition to the springtime low GEM concentrations, the Arctic regularly experiences late spring and summer GEM concentrations that are significantly higher than the hemi-spheric background (Steffen et al., 2005). These high values can be analogously defined as atmospheric mercury emission events (AMEEs), however, the mechanism for AMEEs is not well understood. They do tend to coincide with melt condi-tions (Dommergue et al., 2003), so there is certainly poten-tial for their occurrence to be affected by climate change and therefore influence the future Arctic mercury budget.
Ongoing measurements at Alert, Canada, that began in 1995 comprise the longest continuous data set on Arctic at-mospheric mercury. Although it is generally accepted that climate-driven trends require at least 30 years of data cov-erage to be distinguishable from interannual variability, it is likely that areas which experience more rapid change – such as the Arctic – will also see the trend emerge from the noise on shorter timescales. Therefore, an analysis of atmospheric mercury was undertaken in order to determine if there was a statistical change in concentrations from 1995 to 2007. A previous analysis up to 2005 showed no significant long term trend in the annual GEM concentration at Alert (Temme et al., 2007), but in this paper we extend the analysis in time, use an alternative statistical method, and look at seasonal be-haviour in order to isolate the springtime AMDE chemistry. In addition, we examine the relationship between AMDEs and meteorological and climate parameters in this extensive data set and a shorter one from Amderma, Russia, in order to
assess whether climate change may be expected to influence future springtime mercury deposition to the Arctic ecosys-tem.
2 Methods
Measurements of atmospheric gaseous mercury have been obtained using a commercial Tekran 2537A instrument at Alert since 1995 and at Amderma since 2001. Alert is lo-cated in Nunavut, Canada, at the northern tip of Ellesmere Is-land (82.5◦N; 62.3◦W) on the shore of the Lincoln Sea. The
measurement site sits approximately 6 km from the ocean on a plateau at 205 m elevation. The terrain is steeply rolling with deep ravines and high cliffs in the vicinity. Amderma is located in the Arkhangelsk region of Russia near the coast of the Kara sea (69◦44′N; 61◦34′E) and is approximately 30 m
in elevation. Alert and Amderma are both high Arctic tundra sites sparsely covered with polar desert vegetation. A previ-ous analysis of mercury data at these sites reported similar annual cycles in GEM (Steffen et al., 2005).
The instruments are set up with a 0.2 µm Teflon filter at the outside inlet (47 mm diameter) followed by an approx-imately 30-foot sample line heated to 50◦C to the back of the instrument, which houses an additional identical Teflon filter. Due to the presence of the two filters, the measured concentrations are assumed to represent gaseous elemental mercury based on results from a previous measurement cam-paign (Steffen et al., 2002). Two gold collectors are used, alternating between collection and analysis cycles every five or 30 min for continuous monitoring. Mercury is adsorbed onto the gold traps in the collectors for a period of time and specified flow rate. Once the sample is completed, the trap is then analysed within the instrument. The gold collector is heated to approximately 500◦C and the mercury is ther-mally desorbed from the trap in an argon stream and is then detected using cold vapour atomic fluorescence spectrome-try. This method has been described in detail in Steffen et al., 2008 (and the references therein). The detection limit of the Tekran 2537A is<0.1 ng m−3(Temme et al., 2007).
Uncer-tainties in the measured concentrations have been estimated at 5–17% (95% CL) based on both field intercomparisons (Aspmo et al., 2005; Ebinghaus et al., 1999) and propagating errors in the concentration calculation (Brown et al., 2008; Temme et al., 2007). Hourly mean concentrations were cal-culated for this analysis, requiring 25% completeness. The quality control process used for these data sets was the Envi-ronment Canada-developed Research Data Management and Quality Assurance System (RDMQ) and follows the protocol for the Canadian Atmospheric Mercury Measurements Net-work (CAMNet) (Steffen and Schroeder, 1999). GEM mea-surements at Alert were only valid for the first half of 2008, therefore this analysis was limited to 1995–2007.
direction – were obtained as five-minute means which were then averaged to hourly means, using vector averaging in the case of the wind speed and direction. Hourly relative hu-midity (up to 2006) and global solar radiation (up to 2003) were obtained by request from Environment Canada’s Cli-mate Services Branch (Environment Canada). Temperature, wind speed, wind direction, and relative humidity were re-ported at Amderma approximately every three hours.
Monthly sea ice area index for the Northern Hemisphere was obtained from the National Snow and Ice Data Center records (Fetterer et al., 2002, updated 2009). To approximate the area of seasonal (first-year) sea ice in the spring months, the sea ice area for the previous September was subtracted from the total sea ice area for the month.
Temporal trends in GEM concentrations by month were calculated using the seasonal Kendall test and seasonal Kendall slope estimator (Gilbert, 1987). This method is an extension of the non-parametric Mann-Kendall test for trend, which is a recommended trend test when there are missing values and where the data are not normally distributed – both of which apply to the Alert data set. In the seasonal method, data from each month are treated separately and a slope is es-timated for each month using Sen’s nonparametric estimator of slope. For the purposes of these calculations, each hourly data point in the month is treated as a replicate measurement. An overall annual trend can be estimated from the monthly trend statistics; however, this estimate is less reliable if the monthly trends are not sufficiently homogeneous. A test for seasonal homogeneity was therefore performed as well (van Belle and Hughes, 1984).
In the past, depletion events were defined by the ambi-ent GEM concambi-entration dipping below 1.0 ng m−3(Steffen et
al., 2002). For the purposes of this analysis, the mean back-ground GEM concentration at Alert, as well as its standard deviation, was calculated from all the September–December hourly averages from all years. This time period was chosen to best represent background mercury concentrations that are minimally affected by spring AMDEs, summer AMEEs, or late winter Arctic Haze buildup, as shown by the relatively low variability in measured GEM. An atmospheric mercury depletion event (AMDE) was then defined as a GEM concen-tration more than 3.9 standard deviations below this mean, corresponding to the 99.99% confidence limit and thereby minimizing the number of false positives in the classification of a measurement as a depletion event. Similarly, mercury emission events (AMEEs) were defined as measurements more than 3.9 standard deviations above the September-December mean. This calculation resulted in standard cut-off values of<1.063 ng m−3for AMDEs and>1.970 ng m−3 for AMEEs. These cutoffs implicitly assume a constant September–December GEM concentration, which was ac-ceptable when looking at AMDEs or AMEEs as a function of variables such as temperature, etc. However, when assessing the presence or absence of trends in AMDEs and AMEEs the cutoffs were adjusted for each year by the calculated
trend in the September–December means to give values of, respectively, 1.116 ng m−3−(0.0088 ng m−3yr−1)×(N
1995)
and 2.022 ng m−3−(0.0088 ng m−3yr−1)×(N
1995), where N1995is the number of years since 1995.
In order to quantify the combined frequency and strength of depletion (or emission) events, an “integrated AMDE fre-quency” (FAMDE)was calculated by summing the magnitude
of each hourly measurement classified as an AMDE – that is, the difference between the measured value and the cut-off value calculated as described above – and dividing by the total number of hourly measurements,N:
FAMDE=
N
P
i=1
|CAMDEcutoff−Ci|
N ,whereCi< CAMDEcutoff (1)
The numerator of Eq. (1) sums the amount of depletion (in concentration units) of all AMDE points in a subset of data points, such as all the data points from April 2004, or all data points where the temperature was between−10◦C and −5◦C. The same sum may therefore be calculated due to a few strong depletions events or several weak ones. To ac-count for differences in the size of these subsets, the sum was divided by the total number of data points. When this calcu-lation was performed for measurements grouped by time pe-riod (e.g. by month or season), 70% data coverage within the time period was required. When grouping by meteorologi-cal parameters such as a temperature or wind speed range, a minimum of twenty valid hourly measurements was required for each subset. When calculating total springtime integrated AMDEs or summertime AMEEs at Alert, each month was required to have 70% completeness. Analogous calculations for integrated AMEE frequency (FAMEE) were also done,
us-ing the data points whereCi> CAMEEcutoff.
3 Results and discussion
3.1 Trends in atmospheric Hg0at Alert
2.0
1.8
1.6
1.4
1.2
1.0
0.8
mean GEM for months with >70% data coverage (ng m
-3 )
January February March
April May June July
August
September
October
November December -0.03 -0.02 -0.01 0.00 0.01 0.02 0.03 seasonal Kendall slope (ng m
-3
yr
-1
)
1995-2001 2002-2007
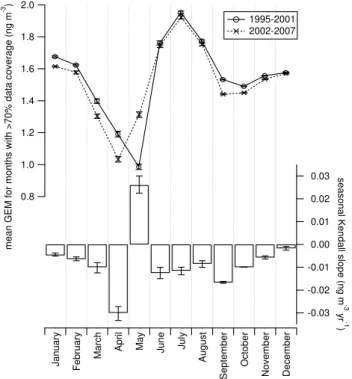
Fig. 1. Seasonal profiles of gaseous elemental mercury concentra-tions at Alert for 1995–2001 and 2002–2007 (top); change in con-centration with time calculated for each month by Sen’s estimator of slope (bottom).
(fall/winter) GEM concentration at Alert. An overall an-nual trend of−0.0086±0.0014 ng m−3yr−1(−0.56% yr−1)
was estimated based on monthly trends in daily mean GEM (which were equivalent to the trends using hourly data but have larger confidence bands), since using hourly data to cal-culate the annual slopes was not feasible due to the num-ber of data points. The statistical test for seasonal hetero-geneity, however, indicates that the monthly trends based on daily or hourly mean GEM values are sufficiently dif-ferent that the estimated trend for the entire year is not re-liable. This can be seen in Fig. 1 as the lack of overlap between error bars of different months. However, monthly trends using a single data point for each month (median monthly GEM) were equivalent to those using hourly or daily values (within error bars), but with much larger sta-tistical uncertainties that resulted in a positive test for sea-sonal homogeneity and an identical annual trend estimate of −0.0086 ng m−3yr−1 with a 95% confidence range of
(−0.0134 ng m−3yr−1, −0.0021 ng m−3yr−1). Therefore,
we conclude that despite increasing GEM concentrations in May, the overall GEM concentration at Alert is sig-nificantly decreasing by approximately −0.6% yr−1. For comparison, a previous analysis of Alert GEM trends from 1995 to 2005 (Temme et al., 2007) found a decrease of −0.005 ng m−3yr−1 (−0.31% yr−1). However, this trend
was considered uncertain since the seasonal decomposition
technique used in the analysis was unable to account for AMDEs. An earlier study that reported median GEM con-centrations by season for the period 1995–2002 (Steffen et al., 2005) found a decrease in the median summer (July– September) concentration, in qualitative agreement with the monthly trends reported here.
In addition to changes in the frequency and intensity of depletion events by month, resulting in the observed monthly GEM trends, there was a decrease in the total springtime (March–June)FAMDEat Alert from 1995 to 2007
of −0.011±0.009 ng m−3yr−1. There was no significant
change over these years inFAMEE for emission events
dur-ing the late sprdur-ing and summer (May–August). However, it should be noted that these trends were based on only 8 years over the period that had sufficient data coverage in all months, and that theFAMDEtrend was not significant if a
static cutoff concentration was used rather than one adjusted for the background trend as described earlier. Therefore, the decrease inFAMDEmay be partially attributed to the decreas-ing value ofCAMDEcutoff in Eq. (1) and continued observa-tions are needed in order to confirm this trend.
The decrease in background GEM over this period rep-resents a change in the balance between sources and sinks of atmospheric mercury in the Arctic. One change could be a decrease in global mercury emissions, since emis-sions were estimated to have changed from 1995 to 2000 by−2%, or −0.4% yr−1 (Pacyna et al., 2006), comparable
to the trend in ambient GEM concentration at Alert. The trend at Alert is also comparable to the decreasing trend of −0.015±0.003 ng m−3yr−1 estimated for the period 1996–
2004 at Cape Point, South Africa (Slemr et al., 2008). If decreasing emissions are the cause of decreasing GEM con-centrations at Alert, this trend may reverse as predicted emis-sions increases from Asia offset decreases from other re-gions. Alternately, an overall decrease in air concentrations could also be due to an increase in the total deposition of mer-cury out of the air. While springtime depletion events – as defined here byFAMDE– have decreased at Alert, AMDE
de-position in other regions of the Arctic or ongoing dede-position in other seasons may be increasing, possibly influenced by decreasing ice cover or changes in the oxidative capacity of the Arctic atmosphere. If this increased deposition is occur-ring, atmospheric concentrations could continue to decrease while input of inorganic mercury to the ecosystem could in-crease. While a long-term record of total filterable mercury in one Arctic location – at Resolute, Canada – reports a de-crease from 1974 to 2000 of approximately 3% yr−1in the
The shift in timing of AMDEs to earlier in the spring may be an important factor in assessing inputs of mercury to the local and regional ecosystem from AMDEs. The date of the GEM minimum at Alert for each year was obtained by finding the minimum of a 60-day smoothed annual cy-cle. The trend in this date by year was−1.2±0.8 days yr−1, or a change from the beginning to the end of the study pe-riod to 14±9 days earlier in the spring. Solar radiation lev-els are changing dramatically in the spring, such that a 2-week time difference in April corresponds to roughly a 50% difference in the maximum daily radiation at Alert. Since mercury deposited to snow appears to undergo photochemi-cal processing that is not yet fully understood but generally leads to re-emission of GEM (Steffen et al., 2008 and refer-ences therein), the balance between the timing of deposition during AMDEs, photochemistry within the snowpack, and snowmelt may influence how much inorganic mercury enters the terrestrial and aquatic ecosystems during the spring melt. The springtime minimum in GEM concentration is due to the atmospheric chemistry of AMDEs (Steffen et al., 2008), thus the observed change in the timing of this minimum could be caused by a number of factors that might affect this chemistry. It is thought that meteorology and climate affect the frequency and length of AMDEs, both directly and through the existence of sea ice (Dastoor et al., 2008; Steffen et al., 2002). For example, these events occur primarily at high latitudes where cold temperatures prevail and are likely sustained by stable inversion layers that prevent mixing with low-halogen, higher-mercury air from aloft, as is predicted for ozone depletion events (Lehrer et al., 2004). Therefore, an examination of the relationships between AMDEs and a number of meteorological and climate parameters was per-formed to determine if any of these parameters could explain the observed monthly trends in GEM.
3.2 Correlations of depletion and emission events with meteorological and climate parameters
The frequency and intensity of AMDEs was compared with local temperature, wind speed, and wind direction as well as with sea ice area and climate indices. In the case of high fre-quency measurements such as the local meteorological con-ditions, data from all years was binned with respect to the meteorological parameter (temperature, wind speed, or wind direction) andFAMDE was calculated within each bin as
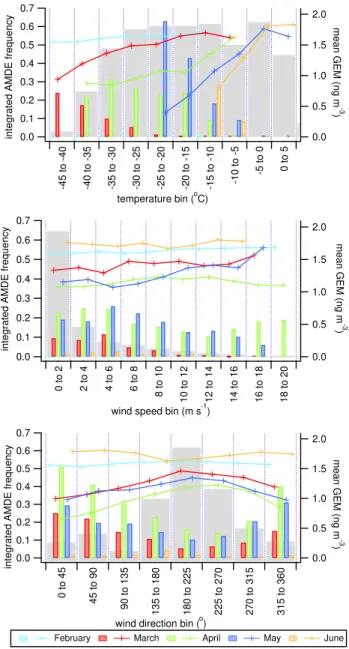
de-scribed previously. The results are shown for Alert in Fig. 2 and for Amderma in Fig. 3. Also shown are the mean GEM concentrations for each bin, which incorporate both AMDEs and AMEEs.
In both locations, FAMDE was lower at higher tures within each month. In addition, at a given tempera-ture, depletion events increased from earlier to later in the spring, at least until AMDEs began to taper off in June. This month-to-month change within each temperature bin may be due to the increase in radiative flux later in the spring, and
0.25
0.20
0.15
0.10
0.05
0.00
0 to 2 2 to 4 4 to 6 6 to 8 8 to 10
10 to 12 12 to 14 14 to 16 16 to 18 18 to 20 wind speed bin (m s-1)
0.7
0.6
0.5
0.4
0.3
0.2
0.1
0.0
integrated AMDE frequency
2.0
1.5
1.0
0.5
0.0
mean GEM (ng m
-3
)
6
5
4
3
2
1
x10
-3
0 to 45
45 to 90 90 to 135
135 to 180 180 to 225 225 to 270 270 to 315 315 to 360 wind direction bin (o)
0.7
0.6
0.5
0.4
0.3
0.2
0.1
0.0
integrated AMDE frequency
2.0
1.5
1.0
0.5
0.0
mean GEM (ng m
-3
)
5000
4000
3000
2000
1000
0
-45 to -40 -40 to -35 -35 to -30 -30 to -25 -25 to -20 -20 to -15 -15 to -10 -10 to -5 -5 to 0 0 to 5
temperature bin (oC) 0.7
0.6
0.5
0.4
0.3
0.2
0.1
0.0
integrated AMDE frequency
2.0
1.5
1.0
0.5
0.0
mean GEM (ng m
-3
)
February March April May June
Fig. 2. Integrated atmospheric mercury depletion event frequency (FAMDE; coloured bars) and mean gaseous elemental mercury (lines), as a function of temperature, wind speed, wind direction and month for Alert data 1995–2007. For reference, springtime fre-quency histograms of the observed meteorological parameters are included in gray.
40
30
20
10
0
x10
-3
-45 to -40 -40 to -35 -35 to -30 -30 to -25 -25 to -20 -20 to -15 -15 to -10 -10 to -5
-5 to 0 0 to 5 5 to 10
temperature bin (oC) 0.7
0.6
0.5
0.4
0.3
0.2
0.1
0.0
integrated AMDE frequency
2.0
1.5
1.0
0.5
0.0
mean GEM (ng m
-3
)
0.12
0.10
0.08
0.06
0.04
0.02
0.00
0 to 2 2 to 4 4 to 6 6 to 8 8 to 10
10 to 12 12 to 14 14 to 16 16 to 18 18 to 20 wind speed bin (m s-1)
0.7
0.6
0.5
0.4
0.3
0.2
0.1
0.0
integrated AMDE frequency
2.0
1.5
1.0
0.5
0.0
mean GEM (ng m
-3
)
5.0
4.5
4.0
3.5
3.0
2.5
2.0
1.5
x10
-3
0 to 45
45 to 90
90 to 135 135 to 180 180 to 225 225 to 270 270 to 315 315 to 360 wind direction bin (o)
0.7
0.6
0.5
0.4
0.3
0.2
0.1
0.0
integrated AMDE frequency
2.0
1.5
1.0
0.5
0.0
mean GEM (ng m
-3
)
February March April May June
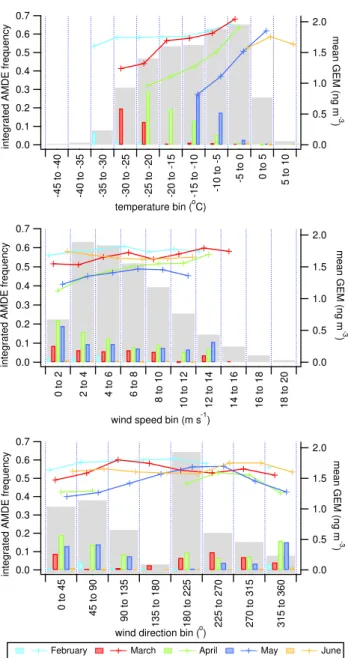
Fig. 3. Integrated atmospheric mercury depletion event frequency (FAMDE; coloured bars) and mean gaseous elemental mercury (lines), as a function of temperature, wind speed, wind direction and month for Amderma data 2001–2007. For reference, spring-time frequency histograms of the observed meteorological parame-ters are included in gray.
and ended earlier in the spring, consistent with the lower lat-itude and warmer temperatures there. However, the trend of decreasing AMDEs and increasing GEM concentrations with warmer temperature is the same at both locations. This correlation supports previous findings on the temperature de-pendence of both the chemistry of bromine explosions and the reactivity of bromine radicals with GEM. The conver-sion of bromide ions in aerosol or snow to Br2may be
en-hanced at lower temperatures (Adams et al., 2002), whether
due to increasing the concentration of halides in the reactive liquid layer of the snow pack (Koop et al., 2000) or acidifi-cation of sea salt aerosol (Sander et al., 2006). This temper-ature dependence would be expected to affect both AMDEs and ozone depletion events. Previous analysis of ozone de-pletion events (Tarasick and Bottenheim, 2002) suggested a “threshold” surface temperature for severe depletions around −20◦C, below which the generation of bromine radicals is very efficient. The temperature dependence seen here does not exhibit this behaviour, however, the actual temperatures recorded at Alert and Amderma are likely indicative of, but not equal to, the temperatures of the air masses in previous days when the depletion chemistry was likely occurring. As would be expected from the tight correlation between spring-time ozone and GEM concentrations, ozone depletion events exhibit similar temperature dependence (not shown), sug-gesting a common underlying cause – whether halogen radi-cal generation or meteorology. However, there could also be direct temperature effects in the reactions that oxidize GEM to reactive gas phase mercury (RGM). While experiments in the temperature range 393–448 K showed no temperature dependence of the oxidation of GEM by Br radicals (Grieg et al., 1970), similar studies at the low temperatures seen in the Arctic springtime (e.g. 230–273 K) are lacking, and the-oretical calculations of the reaction rate predict an inverse temperature dependence (Goodsite et al., 2004), in qualita-tive agreement with the correlation reported here. A detailed comparison of ozone and mercury may lead to a better under-standing of the mechanism for the temperature dependence but is complicated by the very different properties of these two species and is, therefore, left for further investigation.
air masses over the measurement site. This conclusion is supported by the poor correlation between temperature and local wind speed in these data sets. While previous short-term observations in the Antarctic showed a correlation be-tween local temperature and wind speed during an AMDE period (Brooks et al., 2008), hourly (or three-hourly at Am-derma) temperature and wind speed at our sampling sites were weakly correlated in March (R2=0.15 at Amderma,
R2=0.22 at Alert) and showed no correlation during April and May at either site (R2<0.1).
The relationship between AMDEs and local wind direc-tion was very different between the two sites. At Alert,
FAMDE was significantly higher when the wind was
ap-proaching from a northerly or northeasterly direction in March, April, and May. This direction corresponds to air masses arriving from the Arctic Ocean and is consistent with previous trajectory studies which found that ozone-depleted air masses (which correlate very well with GEM-depleted air) arriving at Alert in April were most likely to have tra-versed the Arctic Ocean north of Siberia (Bottenheim and Chan, 2006). Winds from the southwest predominate in the spring due to the “funnelling” of air masses by the topogra-phy of Ellesmere Island and therefore represent air that has most recently traversed land and in many cases is descend-ing from the free troposphere. These air masses were not as likely to be depleted in mercury. Although local wind di-rection is not necessarily a robust representation of the back trajectory of air arriving at Alert, a subset of spring days were chosen to perform 3–10 day back trajectories using the NOAA HYSPLIT model (Draxler and Rolph, 2003) and did show that air masses originating over the Arctic Ocean were generally associated with local winds from the north. Hourly wind direction data, therefore, provided a way to confirm us-ing a large data set (>30 000 points) what was already be-lieved from a more intense trajectory analysis (Bottenheim and Chan, 2006), and extend the comparison to other spring months. In contrast to Alert, AMDEs at Amderma did not exhibit any dependence on local wind direction, suggesting that either they do not consistently originate in one particular region or that the longer-term back trajectories of air arriv-ing at Amderma is not well represented by local wind direc-tion. Therefore, a trajectory-based analysis may be needed in order to identify the source(s) of AMDEs observed at Am-derma.
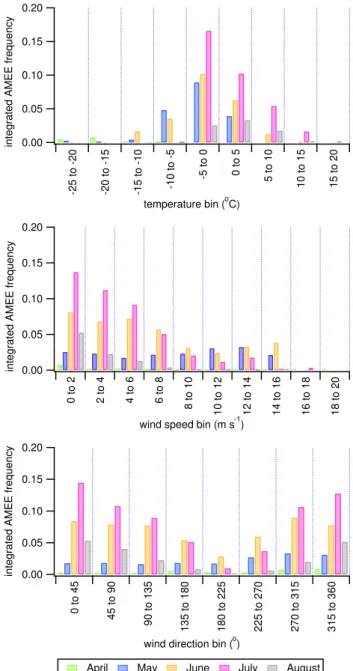
The relationship between AMEEs at Alert and tempera-ture, wind speed and direction, and month is illustrated in Fig. 4. FAMEE values peaked around 0◦C in all months,
were highest in June and July, and were overall much smaller thanFANDEvalues. The same temperature dependence was observed at Amderma (not shown). One mechanism for in-creasing AMEEs with temperature may be an increase in the photoreduction of oxidized mercury to gaseous GEM in the snowpack as the snow melts and sunlight penetrates further. In addition, releases of mercury from biological activity may also be temperature dependent. The reason for the decrease
0.20
0.15
0.10
0.05
0.00
integrated AMEE frequency
-25 to -20 -20 to -15 -15 to -10 -10 to -5
-5 to 0 0 to 5 5 to 10
10 to 15 15 to 20
temperature bin (oC)
0.20
0.15
0.10
0.05
0.00
integrated AMEE frequency
0 to 2 2 to 4 4 to 6 6 to 8
8 to 10
10 to 12 12 to 14 14 to 16 16 to 18 18 to 20 wind speed bin (m s-1)
0.20
0.15
0.10
0.05
0.00
integrated AMEE frequency
0 to 45
45 to 90
90 to 135
135 to 180 180 to 225 225 to 270 270 to 315 315 to 360 wind direction bin (o)
April May June July August
Fig. 4. Integrated atmospheric mercury emission event frequency (FAMEE)as a function of temperature, wind speed, wind direction and month for Alert data 1995–2007. Note the change in scale from Figs. 2 and 3.
in AMEEs with temperature above 0◦C is unclear, but per-haps may be partially due to more dilution of GEM when the planetary boundary layer is higher. Further research into the chemistry and origin of summer GEM emission events is needed before the temperature correlation can be satisfacto-rily explained.
AMEEs also appeared to depend on wind speed and direc-tion, at least in June–August. A peak inFAMEEat the lowest
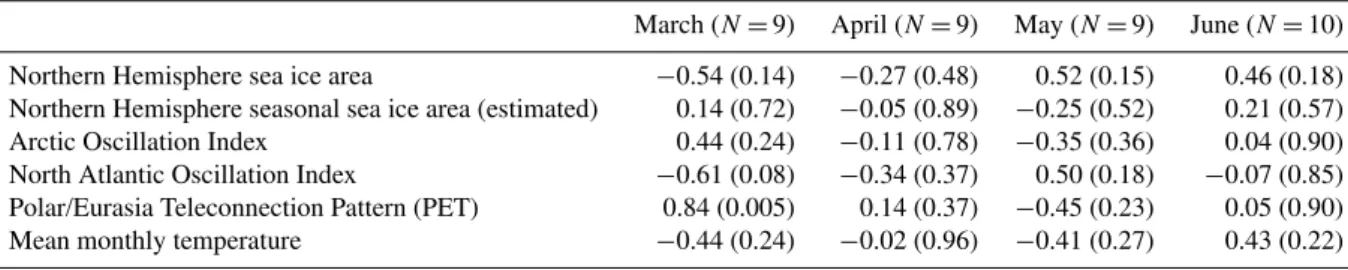
Table 1.Pearson’s correlation coefficients (R), and statistical significance level (p), expressed asR (p), for monthly integrated atmospheric mercury depletion event frequency (FAMDE)at Alert with monthly climate-related parameters. The number of months in the period 1995– 2007 with sufficient GEM data are reported asN.
March (N=9) April (N=9) May (N=9) June (N=10)
Northern Hemisphere sea ice area −0.54 (0.14) −0.27 (0.48) 0.52 (0.15) 0.46 (0.18) Northern Hemisphere seasonal sea ice area (estimated) 0.14 (0.72) −0.05 (0.89) −0.25 (0.52) 0.21 (0.57) Arctic Oscillation Index 0.44 (0.24) −0.11 (0.78) −0.35 (0.36) 0.04 (0.90) North Atlantic Oscillation Index −0.61 (0.08) −0.34 (0.37) 0.50 (0.18) −0.07 (0.85) Polar/Eurasia Teleconnection Pattern (PET) 0.84 (0.005) 0.14 (0.37) −0.45 (0.23) 0.05 (0.90) Mean monthly temperature −0.44 (0.24) −0.02 (0.96) −0.41 (0.27) 0.43 (0.22)
to maintain high GEM concentrations. The correlation of summer AMEE frequency with wind direction is similar to what is seen with spring AMDEs, that is, higher values when the wind is from the north or northeast. This suggests that during spring and summer the ocean and/or its snow and ice cover are a source of GEM. The ocean as a source of GEM is supported by Andersson et al. (2008), who observed from the Arctic Ocean that the sea ice can act as a barrier to GEM eva-sion and that increased GEM concentrations were observed when the sea ice was broken by the research ship (Andersson et al., 2008). Additionally, snow and frost flowers on sea ice and in coastal locations have been shown to contain very high levels of total mercury, with concentrations increasing near-est to or over the ocean (Constant et al., 2007; Douglas and Sturm, 2004; Douglas et al., 2005). If some of this mercury is reduced to GEM during the melt season it could also explain the correlation of AMEEs with wind direction at Alert.
In contrast to temperature, which is reasonably conserved in a transported air mass, other climate-related parameters that are not represented by local data may affect the number of AMDEs observed at a site – for instance, the quantity and type of sea ice encountered by the air mass, or large-scale mixing patterns that influence the source region of air arriv-ing at the site. While these parameters may influence the ori-gin and transport of Hg-poor air masses, it is difficult to com-pare them with atmospheric mercury concentrations at Alert at high time resolution without knowing the air mass origin and transit time in addition to high-resolution sea ice char-acteristics. Therefore, in order to address the more general question of whether the interannual variability in AMDEs is related to variability in seasonal or total sea ice, or to large-scale climate patterns that influence transport, monthly aver-ages of sea ice area and climate indices were compared with monthlyFAMDEvalues at Alert for each month in which suf-ficient data were available. The entire period 1995–2007 was used for this comparison. There were not enough months with the required data completeness at Amderma to perform a similar comparison, therefore this analysis is limited to Alert. The results of these comparisons are shown in Table 1. Correlation coefficients, R, are given rather thanR2in order
to show whether the correlation was positive or negative. The somewhat significant correlations in March between AMDEs at Alert and both the North Atlantic Oscillation (NAO)
In-dex(p <0.1)and the Polar/Eurasia Teleconnection Pattern
(p <0.01)suggest that there is some influence of circulation
patterns on depletion events seen at Alert in early spring, ei-ther direct or indirect. These two indices are not independent, and suggest that March AMDEs are more frequent and/or in-tense in years when the circumpolar vortex is strong (shown by a positive PET and negative NAO phase). It has previ-ously been found that black carbon levels at Alert in win-ter (December–March) tend to be higher during the positive phase of the NAO (Sharma et al., 2006) due to increased mix-ing with mid-latitude source regions. This increased mixmix-ing would lead to higher inputs of mercury as well, possibly re-sulting in shorter or less intense depletion events. The cor-relation does not extend into other spring months, perhaps because of the breakup of the polar vortex, and since most of the springtime depletion events occur in April and May we must be very cautious in interpreting the relationship as sci-entifically meaningful. Part of the difficulty of this analysis is the relatively small data set (13 years), which is further re-duced by months in which there were insufficient GEM data to only 9 or 10 data points. Additional years of monitoring would allow for a more robust comparison.
Also shown in Table 1 are the correlations between the mean monthly temperatures at Alert andFAMDE. These
For example, while radiative flux is somewhat represented by the julian day (or month, broadly), interannual variability in cloudiness may influence the photochemical generation of halogen radicals. However, this effect would be most im-portant in the region where generation of these radicals take place and would not necessarily relate to radiation levels at Alert. Finally, as previously discussed, it may be that to-tal Northern Hemisphere seasonal sea ice (or Arctic Ocean sea ice, which also showed no relationship to AMDEs) is not a good representation of seasonal ice in the region(s) where AMDEs at Alert originate. Future detailed analysis of higher-resolution sea ice conditions, particularly now that seasonal sea ice area can be more accurately estimated from satellite scatterometer data (Nghiem et al., 2006), may reveal a clearer relationship with AMDEs at Alert once a longer data set is collected.
Finally, to quantify the relationship between hourly springtime GEM concentration and various parameters, a multiple linear regression was performed. Temperature alone was able to explain only 16% of the variance in the 1995– 2007 data (R2=0.16, p <0.0001), while using both tem-perature and Julian day (which incorporates the observed de-pendence on month and serves as a proxy for radiation levels) explained 22% of the variance (p <0.0001). Adding wind speed and the cosine of the wind direction (representing the northerly component) as independent variables improved the fit slightly, with this four-parameter model explaining 26% of the variance, but adding solar radiation, sea ice area for the month, and daily NAO index as additional parameters did not improve the fit any further. Though temperature alone is ob-viously not sufficient to explain the observed GEM concen-trations, the significant correlations seen in these data sets, in combination with the evidence for temperature effects in bromine activation (discussed in Sect. 1) and in ozone de-pletion events (Tarasick and Bottenheim, 2002), suggest that models of mercury chemistry in the Arctic may be improved by parametrizing the temperature dependence found in this analysis.
3.3 Qualitative comparison of trends
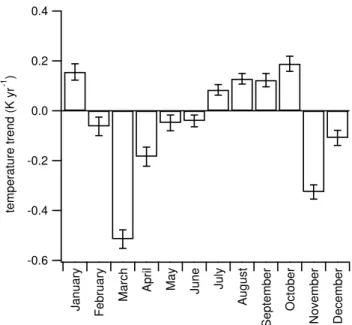
Trends in the local temperature at Alert for 1995–2007 for each month are shown in Fig. 5 and reveal an overall cooling in the springtime, despite longer term warming that is pro-jected for the future (Meehl et al., 2007). Although local tem-perature has a significant relationship with depletion events, the overall springtime trends in temperature are not com-pletely consistent with springtime GEM trends (Fig. 1). De-creased GEM concentrations in February, March, and April are consistent with decreased temperatures in those months, but the temperature in May has also decreased slightly from 1995 to 2007 while GEM has increased. It is possible that the inconsistency in the May temperature and GEM trends, as well as the lack of correlation in monthly means discussed in Sect. 3.2, is due to the influence of other factors. For
ex--0.6 -0.4 -0.2 0.0 0.2 0.4
temperature trend (K yr
-1 )
January February March
April May June July
August
September
October
November December
Fig. 5. 1995–2007 trends in local temperature at Alert calculated for each month by Sen’s estimator of slope.
ample, changes in incoming radiation or winds arriving from the north could be enough to overwhelm the relatively small change in temperature. However, further analysis reveals that despite the overall decreasing trend in May temperature, the percentage of hourly measurements below−15◦C – i.e. at temperatures that exhibit strong and frequent AMDEs – was 28% for 1995–2001 and only 21% for 2002–2007. In this case, although the mean temperature decreased, the distri-bution of temperatures was narrower, resulting in fewer low temperature extremes and fewer (or less intense) AMDEs. The same was not true of the temperature distributions in March and April, which were uniformly shifted to lower tem-peratures during the period, consistent with increased AMDE frequency. Therefore, the shift in the annual GEM minimum shown in Fig. 1 is consistent with changes in air temperature over the period 1995–2007, though contributions from other factors are also likely.
4 Conclusions
Atmospheric elemental mercury measurements at Alert, Canada, show a significant decrease in local GEM concentration over the period 1995–2007 in every month except May, resulting in an annual trend of −0.0086±0.0014 ng m−3yr−1. This is the first time
The results presented here provide additional information about the conditions for both low and high concentrations of atmospheric mercury based on multi-year high-resolution observations. A month-by-month analysis revealed a robust correlation between local temperature and depletion events at both Alert and Amderma, Russia. While this correlation could indicate a potential decrease in AMDEs with increas-ing temperatures in the future, until the mechanism for the temperature effect is known this correlation is primarily use-ful as a guide to refining the parametrization of AMDEs in models. We must be very cautious in extending that relation-ship into future Arctic conditions that deviate significantly from what has been experienced in recent history.
Other parameters, such as local wind speed, total sea ice area, and climate indices, did not correlate with AMDEs at either location, with the exception of a correlation in March only between the Polar/Eurasian Teleconnection Pattern and AMDEs at Alert that may be due to lower inputs of atmo-spheric mercury from midlatitudes during years with a strong polar vortex. Wind direction was an important factor in both depletion and emission events observed at Alert but not at Amderma.
Further research into the mechanism of the temperature effect in AMDEs and AMEEs would be valuable for pro-viding models with the tools to predict the effect of climate change on Arctic mercury. For example, while there are some data and calculations showing temperature effects in the reactions that sustain high levels of activated bromine in the polar spring, the initiation step for this bromine release is still unknown, let alone any temperature or climate influ-ences. Continued research into the origin and propagation of these “bromine explosions” would be enhanced by a con-sideration of temperature effects. In addition, temperature-dependent laboratory studies of mercury oxidation reactions would quantify (or rule out) any effect of temperature on mercury concentrations separate from those of ozone. Dif-ferences in the temperature of maximum integrated AMDE frequency at Alert and Amderma, as well as the relationship between AMDEs at measurement sites and differences in re-gional ice conditions, could be investigated using a trajectory study similar to what has been done for ozone (Bottenheim and Chan, 2006) that incorporates the past temperature his-tory of air parcels. Finally, the origin of AMEEs is a current knowledge gap, and it is hoped that the dependence on me-teorological conditions reported here may motivate further research into their source and mechanism.
Acknowledgements. The authors would like to thank Alexei Kono-plev, Patrick Lee, and Christina Scherz for their contributions to mercury data collection and analysis; the Global Atmospheric Watch program for meteorological data at Alert; numerous per-sonnel at the GAW Alert laboratory and Canadian Forces Station Alert; and Jan Bottenheim and Dorothy Durnford for valuable discussions. Funding for this project was provided by the Northern Contaminants Program of Indian and Northern Affairs Canada, Environment Canada, the Arctic Monitoring and Assessment
Program, and the Government of Canada Program for International Polar Year through the project INCATPA (Intercontinental Atmo-spheric Transport of Anthropogenic Pollutants to the Arctic, led by Hayley Hung).
Edited by: K.-H. Kim
References
Adams, J. W., Holmes, N. S., and Crowley, J. N.: Uptake and re-action of HOBr on frozen and dry NaCl/NaBr surfaces between 253 and 233 K, Atmos. Chem. Phys., 2, 79–91, doi:10.5194/acp-2-79-2002, 2002.
Andersson, M. E., Sommar, J., G˚ardfeldt, K., and Lindqvist, O.: Enhanced concentrations of dissolved gaseous mercury in the surface waters of the Arctic Ocean Mar. Chem., 110, 190–194, 2008.
Ariya, P., Dastoor, A., Amyot, M., Schroeder, W., Barrie, L., An-lauf, K., Raofie, F., Ryzhkov, A., Davignon, D., Lalonde, J., and Steffen, A.: The Arctic: A sink for mercury, Tellus B, 56, 397– 403, 2004.
Aspmo, K., Gauchard, P.-A., Steffen, A., Temme, C., Berg, T., Bahlmann, E., Banic, C., Dommergue, A., Ebinghaus, R., Fer-rari, C., Pirrone, N., Sprovieri, F., and Wibetoe, G.: Measure-ments of atmospheric mercury species during an international study of mercury depletion events at Ny- ˚Alesund, Svalbard, spring 2003. How reproducible are our current methods?, Atmos. Environ., 39, 7607–7619, 2005.
Bottenheim, J. and Chan, E.: A trajectory study into the origin of spring time Arctic boundary layer ozone depletion, J. Geophys. Res.-Atmos., 111, D19301, doi:10.1029/2006JD007055, 2006. Brooks, S., Lindberg, S., Southworth, G., and Arimoto, R.:
Spring-time atmospheric mercury speciation in the McMurdo, Antarc-tica coastal region, Atmos. Environ., 42, 2885–2893, 2008. Brown, R. J. C., Brown, A. S., Yardley, R. E., Corns, W. T., and
Stockwell, P. B.: A practical uncertainty budget for ambient mercury vapour measurement, Atmos. Environ., 42, 2504–2517, 2008.
Christensen, J. H., Brandt, J., Frohn, L. M., and Skov, H.: Modelling of Mercury in the Arctic with the Danish Eule-rian Hemispheric Model, Atmos. Chem. Phys., 4, 2251–2257, doi:10.5194/acp-4-2251-2004, 2004.
Constant, P., Poissant, L., Villemur, R., Yumvihoze, E., and Lean, D.: Fate of inorganic mercury and methyl mercury within the snow cover in the low arctic tundra on the shore of Hudson Bay (Qu´ebec, Canada), J. Geophys. Res.-Atmos., 112, D08309, doi:10.1029/2006JD007961, 2007.
Cosimo, J. C.: Arctic warming signals from satellite observations, Weather, 61, 70–76, 2006.
Dastoor, A. P., Davignon, D., Theys, N., van Roozendael, M., Steffen, A., and Ariya, P. A.: Modeling dynamic exchange of gaseous elemental mercury at polar sunrise, Environ. Sci. Tech-nol., 42, 5183–5188, 2008.
Dommergue, A., Ferrari, C., Gauchard, P.-A., Boutron, C. F., Pois-sant, L., Pilote, M., Jitaru, P., and Adams, F. C.: The fate of mercury species in a sub-arctic snowpack during snowmelt, Geo-phys. Res. Lett., 30, 1621, doi:10.1029/2003GL017308, 2003. Douglas, T., and Sturm, M.: Arctic haze, mercury and the chemical
Envi-ron., 38, 805–820, 2004.
Douglas, T., Sturm, M., Simpson, W., Brooks, S., Lindberg, S. E., and Perovich, D.: Elevated mercury measured in snow and frost flowers near Arctic sea ice leads, Geophys. Res. Lett., 32, L04502, doi:10.1029/2004GL022132, 2005.
Draxler, R. R., and Rolph, G. D. HYSPLIT (HYbrid Single-Particle Lagrangian Integrated Trajectory) Model access via NOAA ARL READY Website (http://www.arl.noaa.gov/HYSPLIT.php). Sil-ver Spring, MD: NOAA Air Resources Laboratory, 2003. Ebinghaus, R., Jennings, S. G., Schroeder, W., Berg, T., Donaghy,
T., Guentzel, J., Kenny, C., Kock, H. H., Kvietkus, K., Landing, W., M¨uhleck, T., Munthe, J., Prestbo, E. M., Schneeberger, D. R., Slemr, F., Sommar, J., Urba, A., Wallschl¨ager, D., and Xiao, Z.: International field intercomparison measurements of atmo-spheric mercury species at Mace Head, Ireland, Atmos. Environ., 33, 3063–3073, 1999.
Environment Canada. Climate Services: http://www.climate. weatheroffice.ec.gc.ca/, access: July 2008.
Fan, S.-M. and Jacob, D. J.: Surface ozone depletion in Arctic spring sustained by bromine reactions on aerosols, Nature, 359, 522–524, 1992.
Fetterer, F., Knowles, K., Meier, W., and Savoie, M.: Sea Ice In-dex: http://nsidc.org/data/g02135.html, access: 2009 Boulder, CO: National Snow and Ice Data Center. 2002, updated 2009. Gilbert, R. O.: Statistical Methods for Environmental Pollution
Monitoring, Van Nostrand Reinhold Company, New York, 204– 240 pp., 1987.
Goodsite, M. E., Plane, J. M. C., and Skov, H.: A theoretical study of the oxidation of Hg0to HgBr2in the troposphere, Environ. Sci. Technol., 38, 1772–1776, 2004.
Grieg, G., Gunning, H. E., and Strausz, O. P.: Reactions of metal atoms. II. The combination of mercury and bromine atoms and the dimerization of HgBr, J. Chem. Phys., 52, 3684–3690, doi:10.1063/1.1673544, 1970.
Kaleschke, L., Richter, A., Burrows, J. P., Afe, O., Heyg-ster, G., Notholt, J., Rankin, A. M., Roscoe, H. K., Holl-wedel, J., Wagner, T., and Jacobi, H.-W.: Frost flowers on sea ice as a source of sea salt and their influence on tropo-spheric halogen chemistry, Geophys. Res. Lett., 31, L16114, doi:16110.11029/12004GL020655., 2004.
Koop, T., Kapilashrami, A., Molina, L. T., and Molina, M. J.: Phase transitions of sea-salt/water mixtures at low temperatures: Impli-cations for ozone chemistry in the polar marine boundary layer, J. Geophys. Res.-Atmos., 105, 26393–26402, 2000.
Lehrer, E., H¨onninger, G., and Platt, U.: A one dimensional model study of the mechanism of halogen liberation and vertical trans-port in the polar troposphere, Atmos. Chem. Phys., 4, 2427– 2440, doi:10.5194/acp-4-2427-2004, 2004.
Li, C., Cornett, J., Willie, S., and Lam, J.: Mercury in Arctic air: The long-term trend, Sci. Total Environ., 407, 2756–2759, 2009. Lindberg, S. E., Brooks, S., Lin, C. J., Scott, K. J., Landis, M. S., Stevens, R. K., Goodsite, M. E., and Richter, A.: Dynamic oxidation of gaseous mercury in the Arctic troposphere at polar sunrise, Environ. Sci. Technol., 36, 1245–1256, 2002.
Meehl, G. A., Stocker, T. F., Collins, W. D., Friedlingstein, P., Gaye, A. T., Gregory, J. M., Kitoh, A., Knutti, R., Murphy, J. M., Noda, A., Raper, S. C. B., Watterson, I. G., Weaver, A. J., and Zhao, Z.-C.: Global Climate Projections, in: Climate Change 2007: The Physical Science Basis. Contribution of Working Group I to
the Fourth Assessment Report of the Intergovernmental Panel on Climate Change, edited by: Solomon, S., Qin, D., Manning, M., Chen, Z., Marquis, M., Averyt, K. B., Tignor, M., and Miller, H. L., Cambridge University Press, Cambridge, UK and New York, NY, USA, 2007.
Morin, S., Marion, G. M., von Glasow, R., Voisin, D., Bouchez, J., and Savarino, J.: Precipitation of salts in freezing seawater and ozone depletion events: a status report, Atmos. Chem. Phys., 8, 7317–7324, doi:10.5194/acp-8-7317-2008, 2008.
Nghiem, S. V., Chao, Y., Neumann, G., Li, P., Perovich, D. K., Street, T., and Clemente-Col¨on, P.: Depletion of perennial sea ice in the East Arctic Ocean, Geophys. Res. Lett., 33, L17501, doi:10.1029/2006GL027198, 2006.
Nguyen, H. T., Kim, K.-H., Shon, Z.-H., and Hong, S.: A review of atmospheric mercury in the polar environment, Crit. Rev. Env. Sci. Tec., 39, 552–584, doi:10.1080/10643380701764308, 2009. Pacyna, E. G., Pacyna, J. M., Steenhuisen, F., and Wilson, S.: Global anthropogenic mercury emission inventory for 2000, At-mos. Environ., 40, 4048–4063, 2006.
Piot, M. and von Glasow, R.: The potential importance of frost flowers, recycling on snow, and open leads for ozone depletion events, Atmos. Chem. Phys., 8, 2437–2467, doi:10.5194/acp-8-2437-2008, 2008.
Sander, R., Burrows, J., and Kaleschke, L.: Carbonate precipitation in brine – a potential trigger for tropospheric ozone depletion events, Atmos. Chem. Phys., 6, 4653–4658, doi:10.5194/acp-6-4653-2006, 2006.
Schroeder, W. H., Anlauf, K. G., Barrie, L. A., Lu, J. Y., Steffen, A., Schneeberger, D. R., and Berg, T.: Arctic springtime depletion of mercury, Nature, 394, 331–332, 1998.
Sharma, S., Andrews, E., Barrie, L. A., Ogren, J. A., and Lavou´e, D.: Variations and sources of the equivalent black carbon in the high Arctic revealed by long-term observations at Alert and Barrow: 1989-2003, J. Geophys. Res.-Atmos., 111, D14208, 10.1029/2005JD006581, 2006.
Simpson, W. R., Alvarez-Aviles, L., Douglas, T. A., Sturm, M., and Domine, F.: Halogens in the coastal snow pack near Barrow, Alaska: Evidence for active bromine air-snow chemistry during springtime, Geophys. Res. Lett., 32, L04811, doi:10.1029/2004GL021748, 2005.
Simpson, W. R., Carlson, D., H¨onninger, G., Douglas, T. A., Sturm, M., Perovich, D., and Platt, U.: First-year sea-ice contact predicts bromine monoxide (BrO) levels at Barrow, Alaska better than potential frost flower contact, Atmos. Chem. Phys., 7, 621–627, doi:10.5194/acp-7-621-2007, 2007.
Skov, H., Christensen, J. H., Heidam, N. Z., Jensen, B., W˚ahlin, P., and Geernaert, G.: Fate of elemental mercury in the Arctic dur-ing atmospheric depletion episodes and the load of atmospheric mercury to the Arctic, Environ. Sci. Technol., 38, 2373–2382, 2004.
Slemr, F., Brunke, E.-G., Labuschagne, C., and Ebinghaus, R.: Total gaseous mercury concentrations at the Cape Point GAW station and their seasonality, Geophys. Res. Lett., 35, L11807, doi:10.1029/2008GL033741, 2008.
Steffen, A., and Schroeder, W. Standard operating procedures man-ual for total gaseous mercury measurements: Canadian Atmo-spheric Mercury Measurements Network (CAMNet). Toronto, Canada: Environment Canada, 1999.
Fuentes, J.: Atmospheric mercury concentrations: measurements and profiles near snow and ice surfaces in the Canadian Arctic during Alert 2000, Atmos. Environ., 36, 2653–2661, 2002. Steffen, A., Schroeder, W., Macdonald, R., Poissant, L., and
Kono-plev, A.: Mercury in the Arctic atmosphere: An analysis of eight years of measurements of GEM at Alert (Canada) and a compar-ison with observations at Amderma (Russia) and Kuujjuarapik (Canada), Sci. Total Environ., 342, 185–198, 2005.
Steffen, A., Douglas, T., Amyot, M., Ariya, P., Aspmo, K., Berg, T., Bottenheim, J., Brooks, S., Cobbett, F., Dastoor, A., Dom-mergue, A., Ebinghaus, R., Ferrari, C., G˚ardfeldt, K., Goodsite, M. E., Lean, D., Poulain, A. J., Scherz, C., Skov, H., Sommar, J., and Temme, C.: A synthesis of atmospheric mercury deple-tion event chemistry in the atmosphere and snow, Atmos. Chem. Phys., 8, 1445–1482, doi:10.5194/acp-8-1445-2008, 2008. Tarasick, D. W. and Bottenheim, J. W.: Surface ozone depletion
episodes in the Arctic and Antarctic from historical ozonesonde records, Atmos. Chem. Phys., 2, 197–205, doi:10.5194/acp-2-197-2002, 2002.
Temme, C., Blanchard, P., Steffen, A., Banic, C., Beauchamp, S., Poissant, L., Tordon, R., and Wiens, B.: Trend, seasonal and multivariate analysis study of total gaseous mercury data from the Canadian atmospheric mercury measurement network (CAMNet), Atmos. Environ., 41, 5423–5441, 2007.
van Belle, G. and Hughes, J. P.: Nonparametric tests for trend in water quality, Water Resour. Res., 20, 127–136, 1984.
Vogt, R., Crutzen, P. J., and Sander, R.: A mechanism for halo-gen release from sea-salt aerosol in the remote marine boundary layer, Nature, 383, 327–330, 1996.