Genetic diversity and apple leaf spot disease re
-sistance characterization assessed by SSR markers
Gustavo H.F. Klabunde
1, Camila F.O. Junkes
2, Sarah Z.A.
Ten-fen
1, Adriana C.M. Dantas
3, Carla R.C. Furlan
4, Adelar
Mantova-ni
5, Frederico Denardi
6, José I. Boneti
7and Rubens O. Nodari
1*Abstract: Among the cultivation problems of apple production in Brazil, Apple
Leaf Spot (ALS) disease represents one of the main breeding challenges. This study aims at analyzing the genetic diversity among 152 apple scion accessions available at the Apple Gene Bank of EPAGRI, located in Caçador, Santa Catarina/ Brazil. Eleven genomic SSR loci were analyzed to assess genetic diversity of ALS resistant and susceptible accessions. Results revealed high genetic diversity of the studied accessions, being 120 exclusive alleles (67 unique) from scion accessions resistant to ALS, and a mean PIC of 0.823. The locus Probability of Identity (I) ranged from 0.017 to 0.089. The combined I was 4.11 x 10⁻¹⁶, and
the Power of Exclusion was 99.99999259%. In addition, the DNA fingerprint patterns will contribute as additional descriptors to select parental for crosses and early identification of apple accessions for breeding purposes, and also for cultivar protection.
Key words: Colletotrichum gloeosporioides, DNA fingerprinting, Malus spp, genetic identity, microsatellite.
Crop Breeding and Applied Biotechnology 16: 189-196, 2016 Brazilian Society of Plant Breeding. Printed in Brazil
http://dx.doi.org/10.1590/1984-70332016v16n3a29
ARTICLE
*Corresponding author: E-mail: [email protected]
Received: 21 August 2015 Accepted: 28 March 2016
1 UFSC, Rodovia Admar Gonzaga, 1346,
88.034-000, Florianópolis, SC, Brazil
2 UFPel, Rua Gomes Carneiro, 1, 96.010-610,
Pelotas, RS, Brazil
3 UERGS, Rua Júlio de Castilhos, 3947,
95.010-005, Caxias do Sul, RS, Brazil
4 Faculdades Integradas FACVEST, Avenida
Marechal Floriano, 947, 88.501-103, Lages, SC, Brazil
5 UDESC, Avenida Luis de Camões, 2090,
88.520-000, Lages, SC, Brazil
6 EPAGRI, Rua Abílio Franco, 1500,
89.500-000, Caçador, SC, Brazil
7 EPAGRI, Rua Araújo Lima, 102, 88.600-000,
São Joaquim SC, Brazil INTRODUCTION
Brazil is the tenth largest apple producer country, with a total production of 1.335 million tons in 2012 (FAO 2014). However, the growers still face serious limiting problems, such as poor climatic adaptation of the current varieties due to insufficient chilling during the winter. High rainfall, associated with high temperatures, during the growing season are the main causes of development of many serious diseases problems in Southern Brazil. Breeding programs carried out by researchers and germplasm bank curators in this region focus on identifying promising germplasm to be used as parent for specific traits, such as short juvenility, high yield, fruit quality, disease-resistance rootstocks, and for low to moderate chilling requirement (Furlan et al. 2010). In addition, the development of scion cultivars resistant to Apple Leaf Spot disease (ALS) is one of the major challenges for apple breeders in southern states of Brazil. The disease is caused by the fungus Colletotrichum gloeosporioides, which triggers the appearance of several brown patches, followed by intense defoliation of trees, and consequently decrease in fruit production (Weir et al. 2012).
domestica Borkh. is one of the most important domesticated fruit species, and its distinct varieties has been submitted to countless crossings and selections over the years. However, a limited number of Malus species has been used up to present for breeding disease resistance, except few breeding programs, like Purdue Rutgers, Illinois, USA, and some European apple breeding programs (Korban and Tartarini 2009). The majority of the parents used in breeding programs have explored a strait gene pool, involving crosses among widespread commercial cultivars (Kumar et al. 2010). For instance, the varieties Red Delicious, Golden Delicious and Jonathan, have been frequently utilized on apple breeding, producing several of the current cultivars (Noiton and Alspach 1996). In addition, the selection and release of sport mutants of widespread cultivars have also potentialized the trend towards genetic similarity in today’s commercial cultivars (Brooks and Olmo 1994).
The accessibility to diverse apple germplasm is essential for pursuing successful breeding, since it increases the number of allele combinations and allows the development of new cultivars with improved and desirable traits. Consequently, broadening the germplasm used in breeding will increase the diversity in cultivation, avoid genetic vulnerability, and preserve their unique genetic characteristics available in this new genetic combinations for future generations.
In plant germplasm characterization, duplicates and mislabeling of accessions might occur, which are unwanted, costly and time consuming (Gustavsson et al. 2008). In these cases, molecular markers are very useful to detect identical, synonymous and homonymous accessions, and also to help breeders to form their core collections (Gross et al. 2012). In addition, proper identification and characterization of accessions will help better protect cultivars under intellectual property rights and identify parents carrying alleles of interest for apple breeding (Goulão et al. 2001).
The EPAGRI´s Apple Gene Bank (EAGB) contains 442 apple accessions introduced from more than 20 countries. Among them, there are several wild apple species, such as M. aldenhamensis, M. atrosanguinea, M. baccata, M. eley, M. hillieri, M. platicarpa, M. robusta, M. prunifolia, M. pumila, M. floribunda, and 19 M. pumila rootstock accessions. The referred Gene Bank can be then considered a potential source of germplasm for many genetic resistances. There are 33 accessions with vertical resistance to apple scab (Venturia inaequalis). Furlan et al. (2010) also identified 187 resistant and 58 susceptible accessions to Colletotrichum gloeosporioides.
The use of molecular markers has been valuable for assessing species and cultivars’ genetic diversity, determining phylogenetic relationships and identifying alleles of interest (Han and Korban 2010). Among the molecular ones, microsatellite markers (SSR-simple sequence repeats) are highly polymorphic, multiallelic, co-dominant, reproducible and are distributed throughout the entire genome, making them ideal for revealing genetic diversity (Morgante et al. 2002). Therefore, the use of molecular markers to access the apple germplasm is a trustworthy tool (Gustavsson et al. 2008, Zhuang et al. 2011, Potts et al. 2012, Reim et al. 2013, Burak et al. 2014). Almost 400 microsatellite markers have already been identified and mapped in Malus and other fruit species (Guilford et al. 1997, Liebhard et al. 2002, Silfverberg-Dilworth et al. 2006, Han and Korban 2008). These molecular markers have been successfully used for assessing the gene pool and relatedness among distinct Malus germplasm (Pereira-Lorenzo et al. 2008, Gasi et al. 2010); and also for identifying loci associated with target alleles and for map-based cloning, regarding their co-dominant heritage and high polymorphism level (Hokanson et al. 1998, Liebhard et al. 2002, Oraguzie et al. 2005, Naik et al. 2006, Han and Korban 2010, Zhuang et al. 2011).
Thus, the primary goal of this work was to assess genetic diversity and relatedness of a large collection of apple germplasm maintained by EPAGRI´s Malus breeding program. The objective was to identify and establish DNA fingerprinting patterns based on SSR markers, and to associate specific alleles and genotypes to ALS resistant and susceptible phenotypic data.
MATERIAL AND METHODS Plant material and DNA isolation
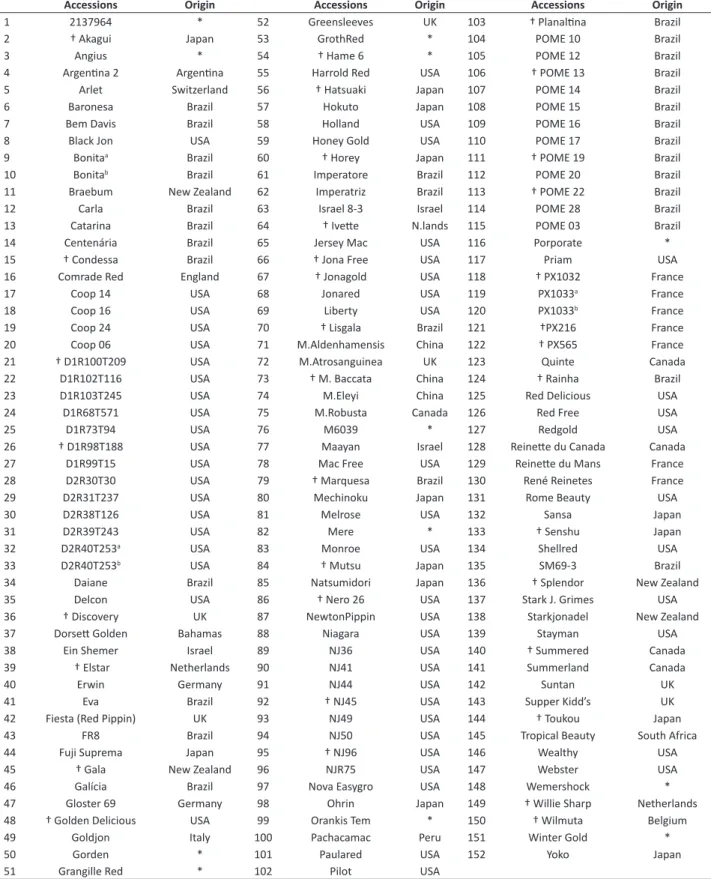
Table 1. Names and country of origin of apple accessions genotypes used in this study
Accessions Origin Accessions Origin Accessions Origin
1 2137964 * 52 Greensleeves UK 103 † Planaltina Brazil
2 † Akagui Japan 53 GrothRed * 104 POME 10 Brazil
3 Angius * 54 † Hame 6 * 105 POME 12 Brazil
4 Argentina 2 Argentina 55 Harrold Red USA 106 † POME 13 Brazil
5 Arlet Switzerland 56 † Hatsuaki Japan 107 POME 14 Brazil
6 Baronesa Brazil 57 Hokuto Japan 108 POME 15 Brazil
7 Bem Davis Brazil 58 Holland USA 109 POME 16 Brazil
8 Black Jon USA 59 Honey Gold USA 110 POME 17 Brazil
9 Bonitaa Brazil 60 † Horey Japan 111 † POME 19 Brazil
10 Bonitab Brazil 61 Imperatore Brazil 112 POME 20 Brazil
11 Braebum New Zealand 62 Imperatriz Brazil 113 † POME 22 Brazil
12 Carla Brazil 63 Israel 8-3 Israel 114 POME 28 Brazil
13 Catarina Brazil 64 † Ivette N.lands 115 POME 03 Brazil
14 Centenária Brazil 65 Jersey Mac USA 116 Porporate *
15 † Condessa Brazil 66 † Jona Free USA 117 Priam USA
16 Comrade Red England 67 † Jonagold USA 118 † PX1032 France
17 Coop 14 USA 68 Jonared USA 119 PX1033a France
18 Coop 16 USA 69 Liberty USA 120 PX1033b France
19 Coop 24 USA 70 † Lisgala Brazil 121 †PX216 France
20 Coop 06 USA 71 M.Aldenhamensis China 122 † PX565 France
21 † D1R100T209 USA 72 M.Atrosanguinea UK 123 Quinte Canada
22 D1R102T116 USA 73 † M. Baccata China 124 † Rainha Brazil
23 D1R103T245 USA 74 M.Eleyi China 125 Red Delicious USA
24 D1R68T571 USA 75 M.Robusta Canada 126 Red Free USA
25 D1R73T94 USA 76 M6039 * 127 Redgold USA
26 † D1R98T188 USA 77 Maayan Israel 128 Reinette du Canada Canada
27 D1R99T15 USA 78 Mac Free USA 129 Reinette du Mans France
28 D2R30T30 USA 79 † Marquesa Brazil 130 René Reinetes France
29 D2R31T237 USA 80 Mechinoku Japan 131 Rome Beauty USA
30 D2R38T126 USA 81 Melrose USA 132 Sansa Japan
31 D2R39T243 USA 82 Mere * 133 † Senshu Japan
32 D2R40T253a USA 83 Monroe USA 134 Shellred USA
33 D2R40T253b USA 84 † Mutsu Japan 135 SM69-3 Brazil
34 Daiane Brazil 85 Natsumidori Japan 136 † Splendor New Zealand
35 Delcon USA 86 † Nero 26 USA 137 Stark J. Grimes USA
36 † Discovery UK 87 NewtonPippin USA 138 Starkjonadel New Zealand
37 Dorsett Golden Bahamas 88 Niagara USA 139 Stayman USA
38 Ein Shemer Israel 89 NJ36 USA 140 † Summered Canada
39 † Elstar Netherlands 90 NJ41 USA 141 Summerland Canada
40 Erwin Germany 91 NJ44 USA 142 Suntan UK
41 Eva Brazil 92 † NJ45 USA 143 Supper Kidd’s UK
42 Fiesta (Red Pippin) UK 93 NJ49 USA 144 † Toukou Japan
43 FR8 Brazil 94 NJ50 USA 145 Tropical Beauty South Africa
44 Fuji Suprema Japan 95 † NJ96 USA 146 Wealthy USA
45 † Gala New Zealand 96 NJR75 USA 147 Webster USA
46 Galícia Brazil 97 Nova Easygro USA 148 Wemershock *
47 Gloster 69 Germany 98 Ohrin Japan 149 † Willie Sharp Netherlands
48 † Golden Delicious USA 99 Orankis Tem * 150 † Wilmuta Belgium
49 Goldjon Italy 100 Pachacamac Peru 151 Winter Gold *
50 Gorden * 101 Paulared USA 152 Yoko Japan
51 Grangille Red * 102 Pilot USA
SSR genotyping
All accessions were genotyped using 11 perfect dinucleotide microsatellite loci from seven apple linkage groups (Table 2). PCR reactions were carried out in a 13.75 µL volume containing 40 ng of genomic DNA, 1X Taq buffer, 1 U Taq DNA polymerase (Invitrogen, Carlsbad, CA, USA), 0.25 µM of each dNTP (Fermentas, Vilnius, Lithuania), 1.5 mM magnesium chloride and 0.3 µM of each primer pair. A Mastercycler Gradient (Eppendorf, Hamburg, Germany) thermalcycler was used to amplify the eleven SSR loci with the following cycles: 94 ºC for 5 min; followed by 30 cycles at 95 ºC for 30 s; annealing temperature (according to the related literature of each primer) for 1 min; 72 ºC for 1 min; and a final extension of 5 min at 72 ºC. Each 5´ forward oligo was labeled with a fluorophore HEX or 6-FAM to enable the automated genotyping (Table 2). After amplification reactions, PCR products were diluted 10X in ultrapure water in order to be genotyped by capillary electrophoresis in a MegaBACE 1000 DNA Analysis System (GE Healthcare, Little Chalfont, UK).
Data analysis
Alleles peaks from raw data were scored by comparison with ET 550-R size standard (GE Healthcare) using Fragment Profiler analysis software version 1.2 (GE Healthcare). Observed and Expected heterozygosity (Ho and
He); number of alleles per locus; allele frequencies; exclusive and unique alleles; Polymorphism Information Content
PIC = 1 – J = 1 – Σ(1 = J)p2ij, where pij is the frequency of the jth allele for ith marker (Anderson et al. 1993); Probability of Identity
(1; being1 = Σpi1 + Σ(2pipi)2), where p
i and pjare the frequencies of the ith and jth alleles and i ≠ j), and (1 unbiased =
n3 (2a22 – a
1) – 2n 22(a
3 + 2a2) + n(9a2 + 2) – 6/(n – 1)(n – 2)(n – 3)) where n is the sample size, ai equals Ʃpji and pj is the frequency of the jth allele (Paetkau and Strobeck 1994) and Power of Exclusion (Q) (Vandeputte 2012) were calculated using the CERVUS 3.0 software (Kalinowski et al. 2007). Alleles were considered rare when their frequencies were lower than 0.05. A dendrogram was constructed with the use of unweighted pair-group method with arithmetic means - UPGMA (Sneath and Sokal 1973), using the software NTSYSpc version 2.02 (Rohlf 2000), and visualized using FigTree software (tree.bio.ed.ac.uk/software/figtree/).
RESULTS AND DISCUSSION
The eleven genomic SSR loci amplified a total of 242 alleles in the 152 apple accessions (Table 3), with a mean of 22 alleles per locus. Availability of marker data ranged from 99.98% (Ch02b03), 99.99% (Ch02g09 and Ch03c02) to 100% (remaining markers), with a total of 0.42% missing data. The joint analyses of all plants and all loci showed a proportion of heterozygotes to homozygotes of 3.38. When only ALS resistant plants were analyzed (118 accessions), the proportion of heterozygotes to homozygotes was 3.41. Similar proportion value (3.58) was observed for the 34 susceptible accessions. The number of alleles per locus ranged from 16 (Nz02b01) to 29 (Ch01g12) (Table 2). One hundred and twenty alleles (49.59%) were found to be exclusive to resistant accessions, and 13 alleles (5.37%) were
Table 2. SSRs names, linkage groups, 5´fluorescent modifications, and sequences of the primers used in this study and the expected
size range of the amplified fragments
SSR name Linkage group* 5´ Labeling Forward sequence Reverse sequence Original publicationSize range (bp)
Ch03c02 a 12 Hex tca cta ttt acg gga tca agc a gtg cag agt ctt tga caa ggc 116-136
Ch02b10 a 02 6-FAM caa gga aat cat caa aga ttc aag caa gtg gct tcg gat agt tg 121-159
Ch05a05 a 06 Hex tgt atc agt ggt ttg cat gaa c gca act ccc aac tct tct ttc t 198-230
Ch05c06 a 16 Hex att gga act ctc cgt att gtg c atc aac agt agt ggt agc cgg t 104-126
Ch02c11 a 10 Hex tga agg caa tca ctc tgt gc ttc cga gaa tcc tct tcg ac 219-239
Ch02b03b a 10 Hex ata agg ata caa aaa ccc tac acag gac atg ttt ggt tga aaa ctt g 77-109
Ch01g12 a 12 6-FAM ccc acc aat caa aaa tca cc tga agt atg gtg gtg cgt tc 112-186
Nz02b01 b 15 Hex ccg tga tga caa agt gca tga atg agt ttg atg ccc ttg ga 212-238
Ch02g09 a 08 6-FAM tca gac aga aga gga act gta ttt g caa aca aac cag tac cgc aa 98-138
Ch03b06 a 15 Hex gca tcc ttg aat gag gtt cac t cca atc acc aaa tca atg tca c 111-131
Hi03g06 c 15 6-FAM tgc caa tac tcc ctc att tac c gtt taa aça gaa ctg cac cac atc c 182-204 a Liebhard et al. (2002), b Guilford et al. (1997), c Silfverberg-Dilworth et al. (2006)
exclusive to susceptible accessions (Tables 3 and 4). Exclusive alleles for ALS resistant accessions were found in all SSR markers, with a mean of 10.91 alleles per locus (Table 4). On the other hand, exclusive alleles were also found in six loci for susceptible ALS accessions. A large number of alleles (163 alleles, 67.36 %) were classified as rare alleles (frequency < 0.5%), ranging from 10 (Ch02c11) to 23 (Ch01g12). A total of 67 unique alleles (27.69%) were detected, out of which 30 were detected in ALS resistant, and 37 in susceptible accessions.
To measure the informativeness of these markers, the polymorphism information content (PIC) for each SSR locus was calculated. The PIC value varied from 0.740 to 0.907, with mean of 0.823 for resistant accession, and from 0.553 to 0.850 for susceptible accessions, with mean of 0.702. Total PIC values for all markers varied from 0.734 (Nz02b01) to 0.895 (Ch02b10), with mean of 0.820 (Table 3). Although Ch02b10 was the most informative locus, with the highest PIC value, Ch01g12 marker presented the highest number of alleles. Total observed heterozygosity varied from 0.493 (Ch03c02) to 0.868 (Ch05c06), with mean of 0.771. Total expected heterozygosity varied from 0.762 (Ch05c06) to 0.905 (Ch02b10), with mean value of 0.840 (Table 3).
In the present study, it was found 16 to 29 alleles per locus. Higher number of alleles, Ho, PIC (Table 3), and wider size ranges were observed for all SSR markers in this study, when compared to those reported on the original primer note studies (Guilford et al. 1997,Liebhard et al. 2002,Silfverberg-Dilworth et al. 2006). The higher genetic diversity values are mainly related to the great diversity of apple accessions in conjunction with the large sample size (152). Guilford et
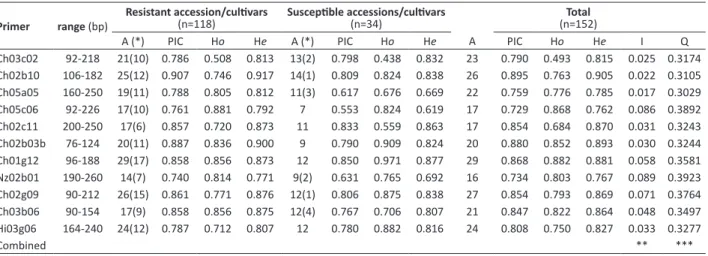
Table 3. Primers, observed size range (bp), number of alleles (A), Polymorphism information content (PIC), Observed heterozygosity
(Ho), Expected heterozygosity (He), Probability of Identity (I) and Power of Exclusion (Q) for resistant, susceptible and total accessions
Primer range (bp)
Resistant accession/cultivars
(n=118) Susceptible accessions/cultivars (n=34) (n=152)Total
A (*) PIC Ho He A (*) PIC Ho He A PIC Ho He I Q
Ch03c02 92-218 21(10) 0.786 0.508 0.813 13(2) 0.798 0.438 0.832 23 0.790 0.493 0.815 0.025 0.3174 Ch02b10 106-182 25(12) 0.907 0.746 0.917 14(1) 0.809 0.824 0.838 26 0.895 0.763 0.905 0.022 0.3105 Ch05a05 160-250 19(11) 0.788 0.805 0.812 11(3) 0.617 0.676 0.669 22 0.759 0.776 0.785 0.017 0.3029 Ch05c06 92-226 17(10) 0.761 0.881 0.792 7 0.553 0.824 0.619 17 0.729 0.868 0.762 0.086 0.3892
Ch02c11 200-250 17(6) 0.857 0.720 0.873 11 0.833 0.559 0.863 17 0.854 0.684 0.870 0.031 0.3243
Ch02b03b 76-124 20(11) 0.887 0.836 0.900 9 0.790 0.909 0.824 20 0.880 0.852 0.893 0.030 0.3244 Ch01g12 96-188 29(17) 0.858 0.856 0.873 12 0.850 0.971 0.877 29 0.868 0.882 0.881 0.058 0.3581 Nz02b01 190-260 14(7) 0.740 0.814 0.771 9(2) 0.631 0.765 0.692 16 0.734 0.803 0.767 0.089 0.3923
Ch02g09 90-212 26(15) 0.861 0.771 0.876 12(1) 0.806 0.875 0.838 27 0.854 0.793 0.869 0.071 0.3764 Ch03b06 90-154 17(9) 0.858 0.856 0.875 12(4) 0.767 0.706 0.807 21 0.847 0.822 0.864 0.048 0.3497 Hi03g06 164-240 24(12) 0.787 0.712 0.807 12 0.780 0.882 0.816 24 0.808 0.750 0.827 0.033 0.3277
Combined ** ***
(*) Exclusive alleles between parenthesis
** Combined probability of identity for the eight analyzed SSR loci = 4,11x10⁻¹⁶ *** Power of exclusion for the eight analyzed SSR loci = 99.99999259%
Table 4. Alleles (bp) identified in 152 accessions in each of the 11 SSRs used in this work
Primer Alleles
Ch03c02 92 104 106 108 110 116 118 120 122 124 126 128 130 132 134 136 144 146 154 164 166 172 218 D
Ch02b10 106 108 110 112 116 118 120 122 124 126 128 130 132 134 136 138 140 144 146 148 152 158 160 164 170 182 Ch05a05 160 162 194 198 200 202 204 206 208 210 212 214 216 218 220 222 226 228 232 234 250 264
Ch05c06 92 102 104 106 108 110 112 114 116 118 120 122 126 128 132 218 226 EE
Ch02c11 200 204 208 210 218 220 222 226 228 230 232 234 236 238 240 244 250 Ch02b03b 76 78 80 82 84 86 88 90 92 94 96 98 100 102 104 106 110 116 122 124
Ch01g12 96 104 106 108 110 112 114 116 118 120 124 128 132 134 136 138 140 142 146 148 152 154 156 158 162 166 180 186 188 Nz02b01 190 198 208 218 220 222 228 232 234 236 240 242 244 246 250 260
Ch02g09 90 92 96 98 100 102 104 106 108 110 112 114 116 118 120 122 126 128 134 136 138 140 142 150 154 168 212 Ch03b06 90 96 100 102 104 106 108 110 112 114 116 118 120 122 124 128 130 138 140 152 154 DD
Hi03g06 164 168 172 174 178 182 184 188 192 194 196 198 200 202 204 206 208 210 214 216 218 228 236 240
al. (1997) found 4.5 alleles per locus in 21 apple cultivars; Gianfranceschini et al. (1998) found 8.2 alleles per locus in 19 cultivars, and Coart et al. (2003) found 19.58 alleles per locus in 119 apple genotypes. Oraguzie et al. (2005) found 9.7 alleles per locus in 66 apple rootstocks cultivars; Hokanson et al. (1998) found 12.1 alleles per locus in 142 accessions of 23 Malus species; and Gharghani et al. (2009) found 17 alleles per locus in other 159 apple cultivars and wild species from several geographical origins and species.
High level of genetic diversity was expressed also in terms of total expected heterozygosity (He=0.84). The high level of heterozygosity of the cultivars is in accordance with former studies on M. sylvestris and M. domestica (Coart et al. 2003, Larsen et al. 2006, Koopman et al. 2007). Allelic frequencies showed wide variations, ranging from 0.017 to 0.828. The most frequent alleles were detected in three SSR loci, i.e., Hi02b07, Hi08g06, and CTG1066091, with frequencies higher than 0.8.
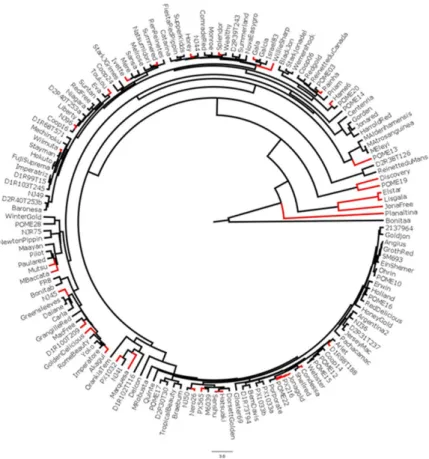
It was taken the most diverse cluster of accessions as one cluster. In fact, the accessions of this cluster are 92% genetically different from the remaining accessions. In addition, they are not used in breeding programs, the reason why they diverge so much from the other accessions. Thus, the dendrogram (Figure 1) based on genetic similarity among the 152 accessions showed two major clusters. Only Winter Gold, M. eley and M. atrosanguinea accessions form the first major cluster. M. eley and M. atrosanguinea accessions are wild apples, non-domesticated and share very few alleles with the other major cluster. In addition, these two species have not recently been used for breeding of modern cultivars; however they could be used, since all wild accessions are resistant to ALS. Other wild accessions, such as M. robusta, M. baccata and M. andenhamensis, clustered near the first major cluster. The second major cluster is sub-clustered in several minor ones, with similarity between pairs of accessions ranging from 17% to 86%. The highest similarity value
Figure 1. UPGMA dendrogram based on polymorphisms of 11 SSR loci in 152 apple accessions. The red branches indicate susceptibil
-ity to Apple Leaf Spot disease (Colletotrichum gloeosporioides), being all other accessions resistant to ALS. The scale represents the
of 86% was found in two pairs of accessions; however, identical accessions were not found. The first pair is formed by Fuji Suprema and Hokuto, and the second pair, by Imperatriz and D1R99T15. This high similarity could be the result of a second backcross generation (BC2). The dendrogram revealed also that the great majority of susceptible accessions were positioned far from wild resistant accessions. Pairs of accessions sharing 82% of alleles were found five times. In three of these cases, the pair is formed by a resistant and a susceptible accession, suggesting that one or more amplified alleles linked to resistance QTLs may be found at the 18% non-shared alleles (Table 4).
The Power of Exclusion (Q) of 99.99999259% from all combined data set provides reliability to the results as discussed above. In addition, the extremely low Probability of Identity (I) of 4.11x10⁻¹⁶ provides an unambiguous way to discriminate
apple accessions (Table 3). These indices allow cultivar identification by analyzing a relatively smaller number of loci than the 11 that were used in the present work.
Brazilian apple breeding programs are in constant need of new resistant scion cultivars which include fruit quality traits. Therefore, combining knowledge of the genetic markers with potential link to ALS resistant phenotype could lead to the faster development of ALS resistant cultivars for use in crossbreeding. Marker assisted selection techniques could make use of such markers associated to ALS resistant phenotypes for further analysis of their genetic linkage and chromosomal location, either for a single locus or quantitative trait loci (QTLs). The development of new ALS resistant cultivars would benefit not only Brazilian and worldwide apple breeders, but also consumers due to the lesser use of pesticides. In addition, the selection of these markers was successful in characterizing a reasonable large number of apple accessions, which could be of great use to other apple germplasm curators worldwide. Nonetheless, further works should be carried out in order to characterize the interaction between resistant accessions and environmental conditions by performing phenotypic analysis in farm conditions.
ACKNOWLEDGEMENTS
To the Conselho Nacional de Desenvolvimento Científico e Tecnológico (CNPq) for the scholarships granted to GHFK and RON, to Coordenação de Aperfeiçoamento de Pessoal de Nível Superior (CAPES) for the scholarship granted to SZAT and AÇÃO TRANSV/ICTS/ EMPRESAS/Ed 2007/2013 of FINEP.
REFERENCES
Anderson JA, Churchill GA, Autrique JE, Sorrells ME, and Tanksley SD (1993) Optimising parental selection for genetic linkage maps. Genome 36: 181-186.
Brooks RM and Olmo HP (1994) Register of new fruit and nut varieties list 35. Horticultural Science 29:942-969.
Burak M, Ergül A, Kazan K, Akcay ME, Yüksel C, Bakir M, Mutaf F, Akpinar AE, Yasasin AS and Ayanoglu H (2014) Genetic analysis of Anatolian apples (Malus sp.) by simple sequence repeats. Journal of Systematics and Evolution 9999: 1-9.
Coart E, Vekermans X, Smulders MJM, Wagner I, Huylenbroeck JV, Bockstaele EV and Roldán-Ruiz I (2003) Genetic variation in the endangered wild apple (Malus sylvestris (L.) Mill.) in Belgium as revealed by amplified fragment length polymorphism and microsatellite markers. Molecular Ecollogy 12: 845-857.
Doyle JJ and Doyle JL (1990) Isolation of plant DNA from fresh tissue. Focus12: 13-15.
FAO (2014) Food and Agriculture Organization for the United Nations – FAOSTAT. Available at <http://faostat3.fao.org>. Accessed in May 2016.
Furlan CRC, Dantas ACM, Denardi F, Becker WF and Mantovani A (2010)
Resistência genética dos acessos do banco de germoplasma de macieira da EPAGRI à mancha foliar de glomerella (Colletotrichum gloeosporioides). Revista Brasileira de Fruticultura 32: 507-514. Gasi F, Simon S, Pojskic N, Kurtovic M and Pejic I (2010) Genetic
assessment of apple germplasm in Bosnia and Herzegovina using microsatellite and morphologic markers. Scientia Horticulturae 126: 164-171.
Gustavsson LG, Brantestam AK, Sehic J and Nybom H (2008) Molecular characterization of indigenous Swedish apple cultivars based on SSR and S-allele analysis. Hereditas145: 99112.
Gharghani A, Zamani Z, Talaie A, Oraguzie NC, Fatahi R, Hajnajari H, Wiedow C and Gardiner SE (2009) Genetic identity and relationships of Iranian apple (Malus x domestica Borkh.) cultivars and landraces, wild Malus species and representative old apple cultivars based on simple sequence repeat (SSR) marker analysis. Genetic Resources and Crop Evolution 56: 829-842.
Gianfranceschi L, Seglias N, Tarchini R, Komjanc M and Gessler C (1998) Simple sequence repeats for the genetic analysis of apple. Theoretical and Applied Genetics 96: 1069-1076.
Gross B, Volk GM, Richards CM, Forsline P, Fazio G and Chao CT (2012) Identification of “duplicate” accessions within the USDA-ARS national plant germplasm system Malus collection. Journal of the American Society of Horticultural Science 137: 333-342.
Guilford P, Prakash S, Zhu JM, Rikkerink E, Gardiner SE, Bassett H and Forster R (1997) Microsatellites in Malus x domestica (apple) abundance, polymorphism and cultivar identification. Theoretical and Applied Genetics 94: 249-254.
Han YP and Korban SS (2010) Strategies for map-based cloning in apple. Critical Reviews in Plant Science 29: 265-284.
Hokanson SC, McFerson JR, Forsline L and Lamboy WF (1997) Collecting and managing wild Malus germplasm in its center of diversity. Horticultural Science 32: 173-176.
Hokanson SC, Szewc-Mcfadden AK, Lamboy WF and Mcferson JR (1998) Microsatellite (SSR) markers reveal genetic identities, genetic diversity and relationships in a Malus x domestica Borkh. core subset collection. Theoretical and Applied Genetics 97: 671-683. Janick J, Cummins JN, Brown SK and Hemmat H (1996) Apple. In Janick
J and Moore JN (ed) Fruit breeding: tree and tropical fruits. John Wiley & Sons, New York, p. 1-78.
Kalinowski ST, Taper ML and Marshall TC (2007) Revising how the computer program CERVUS accommodates genotyping error increases success in paternity assignment. Molecular Ecology16: 1099-1006. Koopman WJM, Li Y, Coart E, Van de Weg WE, Vosman B, Roldán-Ruiz I
and Smulders MJM (2007) Linked vs. unlinked markers: multilocus microsatellite haplotype-sharing as a tool to estimate gene flow and introgression. Molecular Ecology16: 243-256.
Korban SS and Tartarini S (2009) Apple structural genomics. In Folta KM and Gardiner SE (eds) Genetics and genomics of rosaceae. Springer, Berlin, p. 85-119.
Kumar S, Volz RK, Alspach PA and Bus VGM (2010) Development of a recurrent apple breeding programme in New Zealand: a synthesis of results, and a proposed revised breeding strategy. Euphytica 173: 207-222.
Larsen AS, Asmussen CB, Coart E, Olrik DC and Kjaer ED (2006) Hybridization and genetic variation in Danish populations of European crab apple (Malus sylvestris). Tree Genetics & Genomes 2: 86-97. Liebhard R, Gianfranceschini L, Koller B, Ryder CD, Tarchini R, Van De Weg
E and Gessler C (2002) Development and characterization of 140 new microsatellites in apple (Malus x domestica Borkh.). Molecular Breeding 10: 217-241.
Liebhard R, Koller B, Gianfranceschi L and Gessler C (2003) Creating a saturated reference map for the apple (Malus x domestica Borkh.) genome. Theoretical and Applied Genetics 106: 1497-1508.
Morgante M, Hanafey M and Powell W (2002) Microsatellites are preferentially associated with nonrepetitive DNA in plant genomes. Nature Genetics 30: 194-200.
Naik S, Hampsom C, Gasic K, Bakkerem G and Korban SS (2006) Development and linkage mapping of E-STS and RGA markers for functional gene homologues in apple. Genome 49: 959-968. Noiton DAM and Alspach PA (1996) Founding clones, inbreeding,
coancestry and status number of modern apple cultivars. Journal of American Society of Horticultural Science 121: 773-782.
Oraguzie NC, Yamamoto T, Soejima J, Suzuki T and De Silva HN (2005) DNA fingerprinting of apple (Malus spp.) rootstocks using Simple Sequence Repeats. Plant Breeding124: 197-202.
Paetkau D and Strobeck C (1994) Microsatellite analysis of genetic variation in black bear populations. Molecular Ecology 3: 489-495. Pereira-Lorenzo S, Cabrer AMR, Díaz JG and Hernández MDB (2008)
Genetic assessment of local apple cultivars from La Palma, Spain, using simple sequence repeats (SSRs). Scientia Horticulturae 117: 60-166.
Potts SM, Han Y, Khan MA, Kushad MM, Rayburn AL and Korban SS (2013) Genetic diversity and characterization of a core collection of Malus germplasm using simple sequence repeats (SSRs). Plant Molecular Biology Reporter 30: 827-837.
Reim S, Höltken A and Höfer M (2012) Diversity of the European indigenous wild apple (Malus sylvestris (L.) Mill.) in the East Ore Mountains (Osterzgebirge), Germany: II. Genetic characterization. Genetic Resources and Crop Evolution 60: 879-892.
Rohlf JF (2000) NTSYS-pc: Numerical taxonomy and multivariate analysis system. Exeter Software, Setauket, 44p.
Silfverberg-Dilworth E, Matasci CL, Van de Weg WE, Van Kaauwen MPW, Walser M, Kodde LP, Soglio V, Gianfranceschi L, Durel CE, Costa F, Yamamoto T, Koller B, Gessler C and Patocchi A (2006) Microsatellite markers spanning the apple (Malus x domestica Borkh) genome. Tree Genetics & Genomes 2: 202-224.
Sneath PHA and Sokal RR (1973) Numeral taxonomy. WH Freeman, San Francisco, 573p.
Weir BS, Johnston PR and Damm U (2012) The Colletotrichum
gloesporioides complex species. Studies in Mycology73: 115-180.
Vandeputte M (2012) An accurate formula to calculate exclusion power of marker sets in parentage assignment. Genetics Selection Evolution 44: 34-40.