HERBICIDE BEHAVIOR IN BRAZILIAN LATOSOLS
Simulador macro (versão 5.0) na predição do comportamento do herbicida atrazina em latossolos brasileiros
Fernanda Carla Wasner Vasconcelos1, Samara Andrade Carvalho2, Sérgio Henrique Godinho Silva3,
Elen Alvarenga Silva3, Mário César Guerreiro4, Nilton Curi3
ABSTRACT
The knowledge of pesticides behavior is fundamental for understanding the environmental impact caused by these products. However, related field experiments are time consuming and expensive. The MACRO® simulator allows to predicting the leaching of
pesticides through the soil profile and the possible environmental contamination. The objective of this work was to study the percolate behavior and the atrazine leaching in two contrasting Latosols using the MACRO® simulator. The MACRO® simulator was
adequate to predict atrazine behavior under the studied conditions and it can be used for the risk evaluation of atrazine contamination in surface and underground waters.
Index terms: Pesticide, leaching, environmental impact.
RESUMO
O conhecimento do comportamento de pesticidas é fundamental para a compreensão do impacto ambiental causado por esses produtos. No entanto, os experimentos de campo consomem tempo e investimento. O simulador MACRO® permite prever a lixiviação
de pesticidas ao longo do perfil do solo e a possível contaminação ambiental. Objetivou-se, neste trabalho, estudar o comportamento do percolado e a lixiviação do herbicida atrazina em dois Latossolos contrastantes, usando o simulador MACRO®. A simulação pelo
MACRO® foi adequada para prever o comportamento da atrazina sob as condições estudadas e pode ser utilizada para a avaliação dos
riscos de contaminação por esse herbicida em águas superficiais e profundas.
Termos para indexação: Pesticida, lixiviação, contaminação ambiental.
(Received in december 20, 2012 and approved in march 15, 2013)
INTRODUCTION
Crop management practices have assumed fundamental importance in modern agriculture which simultaneously seeks to obtain high productivity, in response to the growing demand for agricultural products, and to conserve natural resources. However, it is common to verify that productivity increases along with the detriment of environmental preservation, primarily due to inadequate soil management and massive agrochemical use. There are many cases of soil, surface and underground water contamination and damage to the animal and human health by pesticides in various countries besides Brazil. Consequently, the increasing necessity to understand pesticide dynamics in the environment and its risk evaluation under the specific conditions of the application site is evident (CASTRO et al., 2006; SILVA et al., 2009).
Atrazine(2-chloro-4-ethylamino-6-isopropylamino-s-triazine) is one of the most globally used herbicides, although its use has already been prohibited in some countries. Due to its wide use and persistence in the environment, atrazine and its metabolites are frequently found in surface and underground waters (ARIAS-ESTÉVEZ et al., 2008).
The Rio das Mortes Basin, located in the center-south of the state of Minas Gerais, Brazil, includes 26 counties, with an area of 6,500 km2. In a
large part of those counties, farming stands out as an important income source (OLIVEIRA JÚNIOR et al., 2008) and the use ofatrazine has been mainly associated with the corn crop on Latosols (Oxisols). As in other areas of Brazil where this product is applied, studies on the occurrence of residues in soils are rare.
1Centro Universitário UNA/Campus Guajajaras – Departamento de Ciências Biológicas – Belo Horizonte – MG – Brasil 2Universidade Federal de Lavras/UFLA – Departamento de Ciência do Solo – Lavras – MG – Brasil
The understanding of the pesticide transport processes in the soil can aid in the study of the factors which alter its leaching and, thus, to provide better underground water contamination predictions. According to the theories which describe the physical and chemical processes that occur in the soil, allied to numerical resolutions techniques and computational resources availability, it is possible, using simulation models, to foresee the contamination and impact risks that certain chemical components can cause to the soil-water medium (CORREIA; LANGENBACH; CAMPOS, 2010).
An example of a simulator used in the prediction of herbicide leaching is the MACRO® (version 5.0), not yet
widespread in Brazil (CASTRO et al., 2006). The MACRO®
is a mechanistic simulator which describes the water balance and transport in the soil profile based on global precipitation, radiation and soil data, and estimates the transport and degradation of solutes. Furthermore, the MACRO® version 5.0 can be used to simulate the transport
of non-reactive tracers, such as bromide and tritium, and pesticides and their metabolites (LARSBO; JARVIS, 2003). In this context, the objective of this work is to evaluate the efficiency of the MACRO® (version 5.0)
simulator and to predict the leaching of the atrazine herbicide in Latosols, comparing them with the data obtained from the lysimeter.
MATERIAL AND METHODS
Selection and identification of study areas and soil sampling
Some Brazilian Health Surveillance Agency (ANVISA) and Ministry of Agriculture, Livestock and Food Supply databases were initially consulted to know in which crops atrazine has been applied as an active principle (SISTEMAS DE AGROTOXICOS FITOSSANITÁRIOS-AGROFIT, 2010; AGÊNCIA NACIONAL DE VIGILÂNCIA SANITÁRIA-ANVISA, 2010). Later, those data were correlated to those of the municipal agricultural production, supplied by the Brazilian Institute of Geography and Statistics (IBGE), to establish which of those crops occupy significant areas in the counties belonging to the Rio das Mortes Basin (Minas Gerais). This first evaluation showed that the corn crop on Latosols stands out in the region in terms of planted area and application of the product, being Bom Sucesso, Coronel Xavier Chaves, Lagoa Dourada, Ritápolis, Nazareno and Carandaí the studied counties.
Having this information, the regional EMATER (Extension Company) offices were contacted to confirm the results obtained in the databases available on the
internet and to indicate the most representative corn crop areas and atrazine application history in the selected counties.
In the selected areas, mesoferric (LV1) and hypoferric (LV2) Red Latosols, which are the main soils in the region, were sampled at 0.00-0.20m depth, in three different places, under sub-perennial tropical forest vegetation and gentle–undulated relief, forming two composite samples. The climate of the region is Cwa, with rainy summer and cold and dry winter, according to Köppen classification.
Samples preparation for the lysimeter modeling study
After the sampling, a part of the soil samples was air dried, crushed and passed through a 4-mm mesh sieve for filling the lysimeter columns; the other part was passed through a 2-mm mesh sieve for physical and chemical characterization (Table1). Then, the first samples set was divided into four subsamples in which the first one (destined for filling the columns) was incubated with limestone (CaCO3) at doses equivalent to 3.1 t ha-1 for LV1
and 4.6 t ha-1 for LV2, aiming to elevate the pH to 6.4,
during one month. The moisture was maintained at 60% of the pore volume for all the four subsamples. The second subsample was incubated during one month with phosphate (KH2PO4) at a dose equivalent to 384.61 mg kg-1
for LV1 and 500 mg kg-1 for LV2, which correspond to half
of the previously determined maximum phosphorus adsorption capacity (MPAC) (OLSEN; WATANABE, 1957). The third subsample received simultaneously liming and phosphate fertilization, and the fourth one did not receive any type of treatment (crontrol).
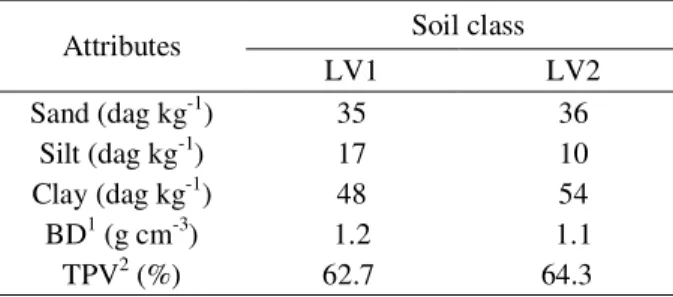
Table 1 – Physical attributes of the studied soils.
Attributes Soil class
LV1 LV2
Sand (dag kg-1) 35 36
Silt (dag kg-1) 17 10
Clay (dag kg-1) 48 54
BD1 (g cm-3) 1.2 1.1 TPV2 (%) 62.7 64.3
1Bulk density; 2Total pore volume.
Installation of soil columns in lysimeters and stabilization with CaCl2 solution (0.01 mol L-1)
x 0.30 (width) x 0.35 (high) m columns. The treatments were arranged in a 2 x 2 factorial scheme, being tested the following factors: soils under two phosphorus conditions (with and without phosphate) and two liming conditions (with and without liming), with three replications, totaling 12 experimental plots for each soil type.
Before the application of the active principle, it was necessary to balance the ionic strength in the different treatments. For that, it was employed a CaCl2 (0.01 mol L-1) solution in the lysimeter columns and the
ionic strength of the percolate was appraised until there was no differences among the treatments. The ionic strength was estimated from the electric conductivity, using the formula I = 0.013EC in which I is the ionic strength based on the concentration expressed in mol L-1
and EC corresponds to the electric conductivity expressed in dS m-1, at 25º C (LINDSAY, 1979).
Atrazine herbicide application and rainfall simulation in the lysimeter columns
The atrazine solution was applied using a pipette (5 mL), drop by drop, in a single dose, corresponding to approximately 27 mg of active principle of the commercial product Gesaprim 500® (MINISTÉRIO DA AGRICULTURA,
PECUÁRIA E ABASTECIMENTO-MAPA, 2009) per soil column (based on previous experiments).
Twelve hours after the product application, the first rain simulation was carried out using plastic containers with perforated bottoms. The amount of simulated rain was 18.75 mm, corresponding to the application of 1.70 L of deionized water in each column. That procedure was performed every three days, during 1 month, totaling the application of 187.5 mm of water that corresponds to the rainfall average of October and November, the main corn planting time in the region of the Rio das Mortes Basin, MG. At the product application time, as well as throughout the whole experimental period, the soil water content was maintained at field capacity. For that, the water loss by evaporation in the soil columns was controlled by daily weighting of one vase with a surface area similar to that of the soil columns, being the amount of water lost through evaporation returned to the column in the following day.
Percolate collection and removal of soil from lysimeter columns
The percolated material in each column was collected in cylindrical stainless steel containers (2.5 L), after each rain simulation. The total percolate volume was
measured using a 2 L cylinder, being a 50 mL aliquot conserved in amber flasks at -18o C for subsequent
chromatographic analysis.
At the end of the leaching period, the soil contained in each column was removed in layers at depths of 0-5; 5-10; 10-15; 15-20; 20-25 and 25-30 cm and homogenized. A fraction of each layer was stored in plastic bags and conserved at -18o C for subsequent evaluation of the
atrazine concentration.
Physical and chemical soil characterization
The physical characterization of the soil samples included the particle size distribution using the pipette method (DAY, 1965). For the chemical characterization (Tables 2 and 3), the MPAC(OLSEN; WATANABE, 1957), oxide contents (Al2O3 and Fe2O3) extracted by sulfuric acid digestion, pH in water, cation sorptive complex, available phosphorus and the total organic carbon were measured (EMPRESA BRASILEIRA DE PESQUISA AGROPECUÁRIA-EMBRAPA, 1997).
Characteristic Soil class
LV1 LV2
Al2O3(dag kg-1) 22.51 25.84
Fe2O3(dag kg-1) 15.12 7.72
MPAC1 (mg dm-3) 769 1000
Table 2 – Sulfuric acid digestion and phosphorus adsorption for mesoferric (LV1) and hypoferric (LV2) Red Latosol from the Rio das Mortes Basin, before the treatments application.
1 MPAC = maximum phosphorus adsorption capacity.
Extraction and quantification of atrazine in soil samples and percolated water
For the extraction of the atrazine from the soil samples at each depth of the lysimeter columns, 30 g of soil were used for each 30 mL of the extraction solution (methanol p.a.), leaving the mixture for 30 minutes on a shaking table. After the resting period for suspension decantation (approximately 20 minutes), the supernatant was collected and placed in a covered plastic flask, being this procedure performed three times. Later, the supernatant was centrifuged at 3,000 rpm for 10 minutes and transferred to a round bottomed flask. The solvent was evaporated at 40o C in a rotary
The extract was filtered in a 0.22 μm membrane and 1 μL was injected for 1 minute (splitless injection) in a Hewlett Packard 6890 gas chromatograph (GC), equipped with a nitrogen and phosphorus detector (NPD) and HP-5 column (30 m x 320 μm x 0.25 μm) with 5% phenyl-methyl-siloxane. The parameters of the operating conditions were: injector temperature 280o C; detector temperature 300o C; initial oven
temperature 120º C during 1 minute; heating ramp of 50º C min-1 up to 250º C, remaining for 1 minute and 40 seconds.
Nitrogen as N2 was used as carrier gas generating an approximate flow rate of 1.0 to 1.5 mL min-1. Standardization
was achieved by means of an analytical curve with an external standard. Under those conditions, the atrazine retention time was 4 minutes and 42 seconds.
The atrazine concentration in the soil samples was quantitatively determined by comparing the heights of the peaks of the samples with those of the calibration curve (ANALYTICAL METHODS COMMITTEE, 1987), obtained by the injection of 1 μL of Gesaprim 500® standard
solutions, containing concentrations which varied from 31.25 to 1,000 μg kg-1.
For evaluation of the atrazine concentration in the percolated water, only the filtration of the percolate in a 0.22 μm membrane was performed and 1 L was injected in the chromatograph under the same conditions
previously described for the analysis of atrazine in the soil samples.
Parameters used in the simulation
Meteorological data
The meteorological data were collected at the Meteorological Station of the Federal University of Lavras and, later, formatted into specific files (.bin) as required by the 5.0 version of the MACRO® simulator. The required climatic
variables are daily precipitation, maximum and minimum air temperature, average annual temperature, average annual thermal range, albedo and evapotranspiration.
In this context, an average annual maximum temperature of 23.2º C, an average annual minimum temperature of 18º C and an albedo (reflected sunlight) equivalent to 0.1 were established; the wind speed was taken at 2 m of height (CASTRO et al., 2006).
Lysimeter conditions and soil characteristics
This simulation was conducted considering that in the lysimeter the leaching would happen under free drainage conditions and that there would not be a water table at its base. The soil temperature was calculated based on the heat conductivity equation developed by Jackson and Taylor (1965).
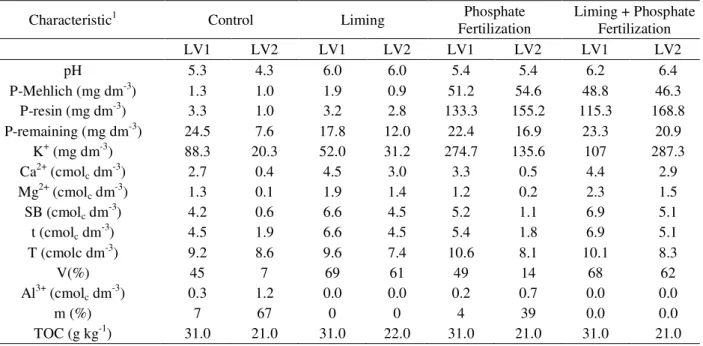
Table 3 – General chemical characteristics of mesoferric (LV1) and hypoferric (LV2) Red Latosol from the Rio das Mortes Basin, before and after the treatments application.
1SB: sum of bases; t: effective cation exchange capacity; T: potential cation exchange capacity; V: bases saturation; m: Al saturation;
TOC: total organic carbon.
μ
Characteristic1 Control Liming Phosphate
Fertilization
Liming + Phosphate Fertilization
LV1 LV2 LV1 LV2 LV1 LV2 LV1 LV2
pH 5.3 4.3 6.0 6.0 5.4 5.4 6.2 6.4
P-Mehlich (mg dm-3) 1.3 1.0 1.9 0.9 51.2 54.6 48.8 46.3
P-resin (mg dm-3) 3.3 1.0 3.2 2.8 133.3 155.2 115.3 168.8 P-remaining (mg dm-3) 24.5 7.6 17.8 12.0 22.4 16.9 23.3 20.9
K+ (mg dm-3) 88.3 20.3 52.0 31.2 274.7 135.6 107 287.3
Ca2+ (cmol
c dm-3) 2.7 0.4 4.5 3.0 3.3 0.5 4.4 2.9
Mg2+ (cmolc dm-3) 1.3 0.1 1.9 1.4 1.2 0.2 2.3 1.5
SB (cmolc dm-3) 4.2 0.6 6.6 4.5 5.2 1.1 6.9 5.1
t (cmolc dm-3) 4.5 1.9 6.6 4.5 5.4 1.8 6.9 5.1
T (cmolc dm-3) 9.2 8.6 9.6 7.4 10.6 8.1 10.1 8.3
V(%) 45 7 69 61 49 14 68 62
Al3+ (cmol
c dm-3) 0.3 1.2 0.0 0.0 0.2 0.7 0.0 0.0
m (%) 7 67 0 0 4 39 0.0 0.0
Regarding the soil management, the soil had not been submitted to any type of preparation, it was not irrigated and there was no drain systems installed. However, for the crop, it was considered bare soil, without any type of plant covering, while for the solute, whose leaching would be simulated, the total of the original compound and the instantaneous sorption process were considered.
The soil column in all of the lysimeters was subdivided into 60 numerical compartments with a thickness determined automatically by the simulator, being the first layer established at 0.3 cm.
Parameterization, calibration and test of the MACRO®simulator
The input data necessary to the use of the MACRO® simulator were obtained experimentally or
compiled from the literature (ARANTES et al., 2006). For the non-available parameters, it were used the values estimated by the simulator or those suggested by the authors of the model.
The calibration of the simulator was developed from the water flow sub-model, evaluating the soil water behavior, thus defining the parameters related to this movement (VANCLOOSTER et al., 2000). Later, the solute behavior was evaluated through the pesticide transport sub-model (CASTRO et al., 2006).
Data output
For the water balance output data, the following were requested: total water content (m3 m-3), accumulated
precipitation (mm) and total percolation (mm). For the mass balance, the estimated parameters were the stored solute (mg m-3), the degradation (mg m-2) and accumulated solute
in the percolate (mg m-3).
RESULTS AND DISCUSSION
Estimation of soil water flow
For the water flow estimation, files were created with the rainfall data and meteorological information. The accumulated simulated and observed precipitation values followed the same behavior and they did not present differences among the treatments. Furthermore, an overlapping of the values is observed along the period of the experiment, which demonstrates that the parameters adopted for the accumulated precipitation simulation were satisfactory. It was possible to notice that Version 5.0 of the MACRO® simulator presented satisfactory efficiency in
the forecast of the accumulated percolate behavior during
the thirty days in which the experiment was performed. This can be verified by the determination coefficient (R2) being
equal to 0.8 for LV1 and to 0.9 for LV2, resulting in an acceptable coincidence between the volume of both simulated and observed accumulated percolates, independently of the adopted fertility management practice. It was also verified that the value of the angular coefficient of the linear regression (b1) was over 1 in both soil types, then the volume of the simulated percolate was overestimated in LV1 when submitted to the isolated liming (b1 = 1.02) or when jointly (b1 = 1.01) and, in LV2, when in the absence of fertility management practices (b1 = 1.03), under isolated phosphate fertilization (b1 = 1.01) and under liming and phosphate fertilization simultaneously (b1 = 1.07). Furthermore, in LV1 it was verified that these values were underestimated in the control treatment (b1 = 0.99) and under phosphate fertilization (b1 = 0.98). In LV2, similar behavior was observed for the liming practice (b1 = 0.99). In this context, it can be affirmed that the MACRO® simulator presented an adequate adjustment for
the simulated percolate accumulated volumes in relation to the data obtained experimentally for LV1 and LV2 in their respective treatments and the small differences in the values were not significant.
Additionally, the parameters adopted from the literature were appropriate to calibrate the MACRO®
simulator. Thus, it was possible to use the same adopted parameters in the water flow sub-model, to understand the transport of the atrazine herbicide, as proposed by Vanclooster et al. (2000).
An important parameter which allows the user to evaluate the water behavior along the soil profile is the division of the total porosity into two domains, micro-and macro-pores.
It was verified that the water is retained in the micro-pores and only when the soil reaches the saturation condition, the flow is directed to the macro-pores. A higher macro-pore situation in the LV1 and LV2 soil types was also observed after the application of the treatments, which can be explained by the fact that the liming and phosphate fertilization modify the chemical composition of the soil solution, slightly increasing the organic matter content, and, in consequence, interfere in the aggregation of the soil particles and in the aggregates stabilization, resulting in higher porosity (BRITO; VENDRAME; BRITO, 2005).
representative data of the environmental conditions and the tropical soils are still necessary, providing a simulation with better accuracy. As such, the use of the simulator is contingent on a previous calibration.
Solute behavior
Figures 1 and 2 show the daily behavior for atrazine along the LV1 and LV2 soil profiles estimated by the MACRO® simulator in each layer. According to these figures,
there is a higher atrazine concentration in the 0-5 cm layer, however, with the passing of time and the application of water corresponding to the rain simulation, the conduction of the molecule to the deepest layers was observed. However, on the 30th day of the experiment, it was noticed that atrazine
remained in the 0-5 and 5-10 cm of the surface layers although its concentration has been diluted in relation to the initial. This is mainly due to the transport of the molecule in the
Figure 1 – Simulated atrazine behavior as function of time and along the LV1 soil profile.
profile by leaching and, or, microbial degradation, because the improvement in the soil fertility conditions by liming practices and phosphate fertilization might have contributed to the increase of the soil microbial mass, thus elevating the degradation rate of the molecule.
and, or, molecule degradation processes, which reduced the molecule mobility along the soil profile.
In particular, the soil organic matter plays a fundamental role in the sorption of the pesticide in the soil, due to, among other aspects, its high cation exchange capacity, high specific surface area and influence on the soil microorganisms. Soils with low organic matter content possess low adsorption capacity, favoring the loss of the product by leaching (SILVA; VIVIAN, 2008).
Thus, as the atrazine concentration in the soil tends to decrease as the time between two product applications increases, as verified in the present study (Figures 1 and 2), the higher environmental risks due to the atrazine application in the soil occur right after its application.
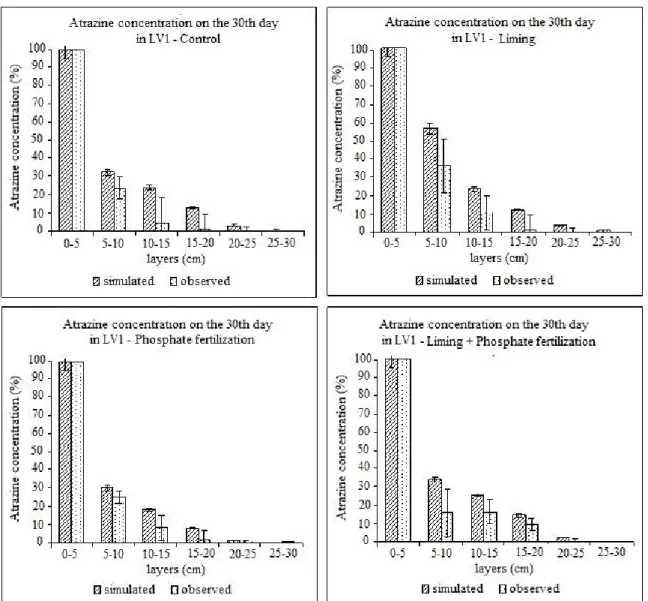
The obtained and simulated results for the distribution of the herbicide in the LV1 and LV2 profiles on the 30th day after the atrazine application are shown in
figures 3 and 4.
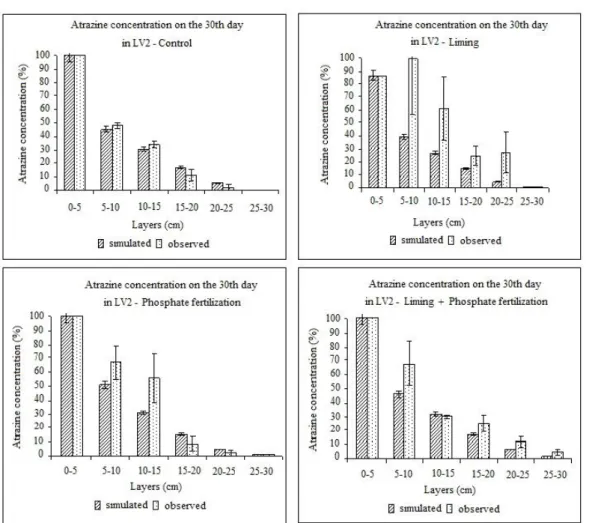
In gen er al, a decr ease in th e atr azin e concentration was observed in LV1 and in LV2 with the increase of the depth for the simulated data. The atrazine mobility was verified in the lysimeters in most of the soil columns, being considered a molecule of average mobility (SILVA et al., 2009), because the maximum depth reached was 20 cm in LV1 and 25 cm in LV2. That difference is due to the fact that LV1 presents higher TOC values, which difficulties the molecule mobility.
As shown in figure 4, the MACRO® simulator can
underestimate the simulated values, which confers a margin of error in the drawing of the curve, being the largest discrepancy seen in the 5-10 cm layer when the soil was submitted to liming practice. As such, the most appropriate behavior for predicting atrazine concentration at the end of the 30 days is observed in LV1 (Figure 3).
Under liming and phosphate fertilization simultaneously, extremely low simulated values were
Figure 3 – Comparison between atrazine observed and simulated values in the soil column for LV1 after 30 days. verified in LV2 in the 25-30 cm layer, which contradicts the
observed values, since the atrazine presented mobility and it was detected at a maximum depth of 25 cm. However, in LV1 atrazine was not detected in that same layer, this result being similar to the simulated one.
Furthermore, higher homogeneity of the simulated and observed data was observed in LV1, in the 25-30 cm layer (Figure 3), independently of the adopted management. Similar behavior was observed in LV2, being the normalized concentration more expressive under simultaneous liming and phosphate fertilization application (Figure 4).
In general, the liming practices and phosphate fertilization, separately or not, contributed to reduce the
atrazine potential mobility in the soil columns, mainly in the LV1 samples.
Figure 4 – Comparison between atrazine observed and simulated values in the soil column for LV2 after 30 days.
CONCLUSIONS
The performance of the MACRO® simulator in the
assessment of both percolate and atrazine molecule behavior in the Latosols studied was satisfactory. Therefore, an adequate adjustment was verified between the values obtained in the lysimeters and in the simulations, demonstrating a high potential of using MACRO® as a
tool for the evaluation of atrazine contamination risks in surface and underground waters, for the prevalent conditions in the Rio das Mortes Basin (MG).
REFERENCES
AGÊNCIA NACIONAL DE VIGILÂNCIA SANITÁRIA-ANVISA. Sistemas de informação sobre agrotóxicos. Relatório de ingrediente ativo: atrazina. Available in: <http://www.anvisa.gov.br>. Accessed on: 25 May, 2010.
SISTEMAS DE AGROTOXICOS FITOSSANITÁRIOS-AGROFIT. Ingrediente ativo: atrazina. Available in: <http://extrane.agricultura.gov.br>. Accessed on: 25 May, 2010.
ANALYTICAL METHODS COMMITTEE.
Recomendations for the definition, estimation and use of detection limit. Analyst. Cambridge, n.112, p.199-204, 1987. ARANTES, S. A et al. Sorção da atrazina em solos representativos da sub-bacia do Rio das Mortes-MG. Pesticidas: Revista de Ecotoxicologia e Meio Ambiente, Curitiba, v.16, p.101-110, 2006
ARIAS-ESTÉVEZ, M. et al. The mobility and
BRITO, O.R.; VENDRAME, P.R.S.; BRITO, R.M. Alterações das propriedades químicas de um Latossolo Vermelho distroférrico submetido a tratamentos com resíduos orgânicos. Semina: Ciências Agrárias, Londrina, v.26, n.1, p.33, 2005.
CASTRO, N. R. A. et al. Avaliação do simulador MACRO® (versão 5.0) para predição da lixiviação do
inseticida tiametoxam em duas classes de solo.
Pesticidas: Revista de Ecotoxicologia e Meio Ambiente, Curitiba, v.16, p.1-12, 2006.
CORREIA, F. V.; LANGENBACH, T.; CAMPOS, T.M. Avaliação do transporte de atrazina em solos sob diferentes condições de manejo agrícola. Revista Brasileira de Ciência do Solo, Viçosa, v.34, n.2, p.525-534, Mar./Abr, 2010.
DAY, P. R. Particle fractionation and particle-size analyses. In: BLACK, C. A.. (Ed.). Methods of soil analysis. American Society of Agronomy, Madison, v.1, p.545-566, 1965.
EMPRESA BRASILEIRA DE PESQUISA
AGROPECUARIA-EMRAPA. Centro Nacional de Pesquisa de Solos. Manual de métodos de análises de solo. 2.ed. Rio de Janeiro: CNPS, 1997, 212p.
JACKSON, R.D.; TAYLOR, S.A. Heat transfer. In: BLACK, C. A. (ed.) Methods of soil analysis. Part 1. Phisical and mineralogical properties. Madison: American Society of Agronomy, p.349-360, 1965. OLIVEIRA JÚNIOR, A. C. et al. Indicadores químicos de qualidade da matéria orgânica de solo da sub-bacia do Rio das Mortes sob manejos diferenciais de cafeeiro. Química Nova, São Paulo, v.31, p.1733-1737, 2008. OLSEN, S. R.; WATANABE, F. S. A method to determine a phosphorous adsorption maximum of soils as
measured by the Langmuir isotherm. Soil Science Society of America Proceedings, Madison, v.21, p.144-149, 1957.
LARSBO, M.; JARVIS, N. MACRO® 5.0, a model of
water flow and solute transport in macroporous soil: technical description. Swedish University of
Agricultural Sciences: Emergo, Alnarp, v.1, 2003, 49p. LINDSAY, W. L. Chemical equilibria in soils. New York: Wiley-Interscience, 1979, 447p.
MINISTÉRIO DA AGRICULTURA, PECUÁRIA E ABASTECIMENTO-MAPA. Compêndio de defensivos agrícolas: Guia prático de produtos fitossanitários para uso agrícola. 8.ed. São Paulo: Organização Andrei Editora, 2009, 1380p.
SILVA,D. R. O. et al. Monitoramento de agrotóxicos em águas superficiais de regiões orizícolas no sul do Brasil. Ciência Rural, Santa Maria,v.39, n.9, p. 2383-2389, 2009 SILVA, A. A.; VIVIAN, R. Dinâmica de herbicidas no solo. In: Laércio Zambolim; Marcelo Coutinho Picanço; Antonio Alberto da silva; Lino Roberto Ferreira; Francisco Affonso Ferreira; Waldir Cintra de Jesus Junior. (Org.). Produtos Fitossanitários: Fungicidas, Inseticidas, Acaricidas e Herbicidas. 1 ed. Viçosa, MG: Suprema Gráfica e Editora Ltda, 2008, v.1, p.385-423. VANCLOOSTER, M.et al. European test of pesticide-leaching models: methodology and major
recommendations. Agricultural Water Management, Elsevier Science, London, v.44, p.1-19, 2000.