Uncertainty measurement in the homogenization and sample
reduction in the physical classification of rice and beans
Incerteza de medição na homogeneização e redução de
amostra na classificação física de arroz e feijão
Dieisson PivotoI* João Mathias BeckerI Carolina BremmII Filipe de Medeiros AlbanoIII
ISSN 1678-4596
ABSTRACT
The study aimed to i) quantify the measurement uncertainty in the physical tests of rice and beans for a hypothetical defect, ii) verify whether homogenization and sample
reduction in the physical classification tests of rice and beans is
effective to reduce the measurement uncertainty of the process and iii) determine whether the increase in size of beans sample increases accuracy and reduces measurement uncertainty in
a significant way. Hypothetical defects in rice and beans with
different damage levels were simulated according to the testing methodology determined by the Normative Ruling of each
product. The homogenization and sample reduction in the physical classification of rice and beans are not effective, transferring to the final test result a high measurement uncertainty. The sample size
indicated by the Normative Ruling did not allow an appropriate
homogenization and should be increased.
Key words: ISO / IEC 17025, grain classification, quality control,
precision.
RESUMO
O trabalho teve como objetivo i) quantificar a
incerteza de medição nos ensaios físicos de arroz e feijão para
um defeito hipotético; ii) verificar se a homogeneização e redução da amostra nos ensaios de classificação física de arroz e feijão são eficazes para reduzir a incerteza do processo; iii) analisar se
o aumento do tamanho da amostra de grãos de feijão aumenta a
precisão e reduz a incerteza de medição de forma considerável.
Defeitos hipotéticos em arroz e feijão com diferentes níveis de danos foram simulados de acordo com a metodologia de ensaio
da Instrução Normativa de cada produto. A homogeneização e redução da amostra na classificação física de arroz e feijão não são eficazes, transferindo para o resultado final do ensaio uma elevada incerteza de medição. O tamanho da amostra indicado pela
instrução normativa não permite uma adequada homogeneização
e deveria ser aumentado.
Palavras-chave: ABNT NBR ISO/IEC 17025, classificação de
grãos, controle de qualidade, precisão.
INTRODUCTION
Vegetable classification was institutionally set up in Brazil in 1938, when the Federal Government established the standardization, classification and
inspection of agriculture and livestock products
intended for export. In 1975, according to Law 6.305, the classification of products of plant origin was established for the domestic market, with validity throughout the national territory. The classification started to be a prerogative of the Ministry of Agriculture, Livestock and Food Supply (MAPA), with the possibility for each state to exercise it through agreements or contracts. In 2000, Law no. 9.972 (BRASIL, 2000) extinguished the classification agreements and created the accreditation of companies for the provision of classification services, thus reestablishing the exclusive competences of MAPA in the classification for inspection and import purposes.
Despite legislation in the area of vegetable
classification improved, it was not accompanied by the development of testing methods, procedures and equipment for carrying out analyses. Techniques
ILaboratório Nacional Agropecuário (LANAGRO/RS - MAPA). 90220-004, Porto Alegre, RS, Brasil. E-mail: [email protected]. *Corresponding author.
IIFundação Estadual de Pesquisa Agropecuária (FEPAGRO). Porto Alegre, RS, Brasil. IIIRede Metrológica RS, Porto Alegre, RS, Brasil.
for physical assessment of products are sensory and mostly use visual analysis as its main principle, as it can be verified in the legislation concerning some products (e.g. rice) by Normative Ruling no. 6 of 2009 (MAPA, 2009). This methodology favors subjectivity, increasing analytical uncertainty.
MAPA requires from accredited classification service providers a set of procedures based on the ABNT NBR ISO/IEC 17025 standard. The latter establishes requirements for quality management in testing laboratories; thus, ensuring reliability as well as traceability of issued results. Due to the difficulty to adapt grain classification to the quality control processes required by the standard, a study of factors contributing to the increase of uncertainty in grain classification, i.e. factors reducing precision and accuracy of tests, was carried out (EURACHEM-CITAC, 2012).
Therefore, this study aimed to i) quantify the measurement uncertainty in physical tests of rice and beans for a hypothetical defect, ii) verify whether homogenization and sample reduction in the physical classification tests of rice and beans are effective to reduce the uncertainty of the process and iii) determine whether the increase in size of the beans sample increases accuracy and reduces measurement uncertainty in a significant way.
MATERIALS AND METHODS
The study was carried out in the Analysis Laboratory for Vegetable Classification (LACV/ DLAB) connected to the Agriculture and Livestock National Laboratory in Porto Alegre (LANAGRO-RS), from February to June 2013. The products analyzed were rice and bean grains.
As for the rice grain, eight levels of the
same hypothetical defect were simulated (0.1%; 0.3%; 0.5%; 1.0%; 1.5%; 2.0%; 2.5%; 3.0%) by
using different colored food colorings, resulting in
completely colored grains. It was considered that the simulated defect or hypothetical defect, according to visual characterization, behaves in a homogenous way for the other defects in the homogenization and quartering process, within the grain mass both for rice and beans. Seven samples of 1.2 kilos each with the hypothetical defect were taken into consideration. Each sample was homogenized and resulted in 4 sub-samples totaling 28 tests. Analyses were performed according to the Normative Ruling no. 6 of 2009 of the Ministry of Agriculture, Livestock and Food Supply (MAPA), which defines the procedures and size of the working sample for
analysis purposes. A sample of 100g of Long Thin Polished Milled Rice was used.
In the second part of the study a sample of Common Black Beans was used. Six levels of the same hypothetical defect were simulated (0.5%; 1.5%; 2.5%; 3.5%; 4.5%; 5.5%), with the use of enamel paint in six different colors, resulting in completely colored grains. Seven samples of 1.2 kilos each were taken into consideration. However, a sample was discarded due to failures in the homogenization process, with a total of six samples. Each sample was homogenized and resulted in 4 sub-samples, totaling 24 tests. Analyses were performed according to the Normative Ruling no. 12 of March 28, 2008 of MAPA, which defines the procedures and size of the working sample for analysis purposes. First, a working sample of 100g was used and then this working sample was increased to 250g of beansto improve the accuracy of the analysis.
The use of different colors in the analyses aimed to eliminating the uncertainty of the analyst in the process. Therefore, all the imprecision and uncertainty of a sensory analysis are attributed to homogenization and quartering (process used for reduction and obtainment of the working sample in grain classification). Analysts that performed the tests are registered with the MAPA to provide vegetable classification. However, the methodology employed did not require experience in vegetable classification, providing that Normative Rulings are followed. Before the analyses were performed, samples were homogenized in a homogenizer (Jones-type) by repeated passage (10 times).
Repeatability and reproducibility values were calculated. In order to obtain the repeatability value, the range between repetitions of each sample for each analyst was firstly calculated by the difference between the repetitions. Mean range of the repetitions of each analyst was then calculated and the mean range found was divided by the d2 (1.15)
value, which is estimated based on the number of samples and number of analysts, so as to obtain the repeatability value. As for the reproducibility value, the average range between the means of the analysts was calculated, and then divided by the tabulated
d2 coefficient that in this case is 1.41 (ALBANO &
RAYA-RODRIGUEZ, 2009).
with two analysts (A1 and A2) and with two repetitions for each analyst (R1 and R2), totaling 28 tests by damage level for rice and 24 tests by damage level for beans.
The steps carried out for uncertainty calculation are described below:
Step 1: Identification of the mathematical model for measure and measurement.
% Defect = [defect weight(g)/working sample weight(g)]x100
Step 2: Identification of the main sources of uncertainty involved in the test (repeatability deviation, reproducibility deviation, resolution and measurement uncertainty of used equipment, among other factors);
Step 3: Uncertainty calculations, identifying the probability distributions of each entry component (source collected during the step and its degrees of freedom);
Step 4: Standard uncertainty calculation, dividing the entry value by its divisor (which varies according to the probability distribution associated with this variable) and the sensitivity coefficient, calculated by the partial derivatives of each variable involved in the uncertainty calculation, so as to transform all sources in the same measurement unit.
Step 5: Calculation of combined uncertainty and effective degrees of freedom.
Step 6: K factor calculation (coverage factor) and expanded uncertainty.
Observations of different defect levels were submitted to variance analysis (ANOVA) with a 5% level of significance, separately for type of grain (rice and beans) and sample size (100g and 250g). Analyst fixed effects, the assessed defect
level and the interaction between analyst and defect level, and sub-sample, were included in the model, within each sample as random effect.
The defect levels of the samples under observation, as well as the calculated values of uncertainty measurement, were submitted to linear regression analysis, considering 5% as level of significance (P<0.05). The JMP v.10 statistical program (SAS Inst. Inc., Cary, NC) was used.
RESULTS AND DISCUSSION
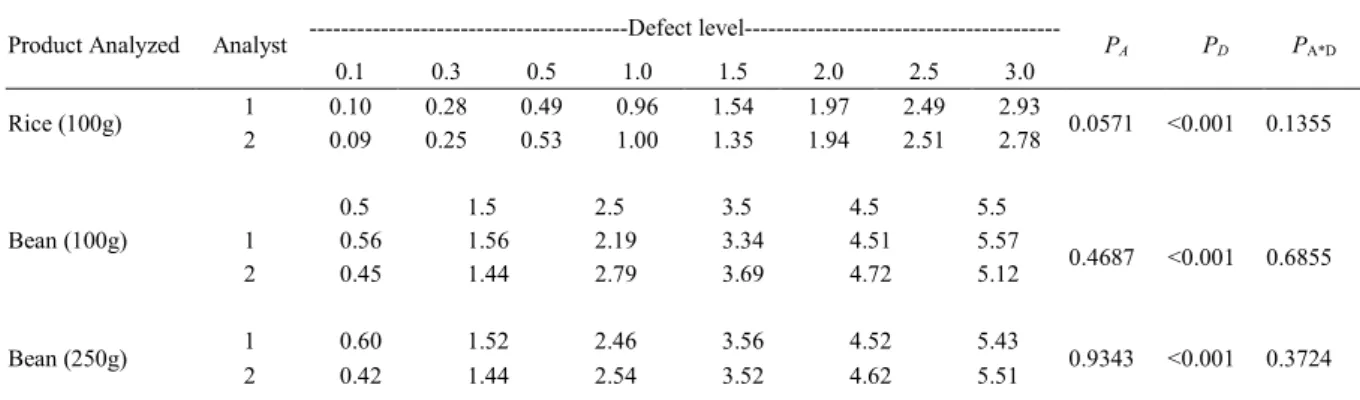
Through the variance analysis carried out (Table 1), no interaction between analyst
and intended defect level for rice and beans
grains was observed. Similarly, the analyst effect was not significant (P>0.05), which means that both analysts managed to assess the defects in a similar way. A significant relationship between the
observed defect level and the assessed defect level
was identified (Figure 1).
As for the variability in the test results (Figure 1), a high dispersion of the observed defect level (%) was observed mainly in the beans. Rice standard deviation was inferior to that of the beans, considering the same defect level (e.g. standard deviation of 0.10 for rice and 0.31 for beans with defect level of 0.5%). The range was also inferior in the rice test (0.38) when compared to the beans (1.20) for a defect level of 0.5%.
The higher variability in the beans test is mainly due to the smaller quantity of grains in the sample, since after dividing the weight of the beans sample (100g) by the mean weight of the grain (0.210g), a total of 476 grains is obtained. However,
Table 1 - Average defect level observed by two analysts for the products analyzed (Rice 100g. Bean 100g and Bean 250g).
---Defect
level---Product Analyzed Analyst
0.1 0.3 0.5 1.0 1.5 2.0 2.5 3.0
PA PD PA*D
1 0.10 0.28 0.49 0.96 1.54 1.97 2.49 2.93
Rice (100g)
2 0.09 0.25 0.53 1.00 1.35 1.94 2.51 2.78 0.0571 <0.001 0.1355
0.5 1.5 2.5 3.5 4.5 5.5
1 0.56 1.56 2.19 3.34 4.51 5.57
Bean (100g)
2 0.45 1.44 2.79 3.69 4.72 5.12 0.4687 <0.001 0.6855
1 0.60 1.52 2.46 3.56 4.52 5.43
Bean (250g)
2 0.42 1.44 2.54 3.52 4.62 5.51 0.9343 <0.001 0.3724
PA is the significance value of ANOVA for analyst. PD is the significance value to defect level and PA*D refers to the significance for the
in the rice test, after dividing the weight of the sample (100g) by the mean weight of the grain (0.018g), 5,556 grains are obtained. The difference of the mean weight of the grains for both products can have an impact on precision and, consequently, on the test uncertainty.
As a consequence of the beans sample being small and presenting high variability, traditional methods of inter laboratory quality control used in other areas, such as the physicochemical one, cannot be used for grain classification. According to CORRY et al. (2010), measurement uncertainty does not only arise from the analysis, but also from sampling processes and sample preparation. In grain classification, the process preceding the analysis keeps uncertainty high. Therefore, when quality control methods are used, disapproval generally occurs, even with the appropriate analysis.
Grain classification in Brazil is usually performed with working samples of 100g to analyze defects, without considering the mean weight of the grains. Differently, analyses in the seed area, following the Regras para Análises de Sementes
[Rules for Seed Testing] (BRASIL, 2009), based on the International Seed Testing Association (ISTA, 2008), use the number of seeds as criterion to define the sample size. Therefore, the sample weight used in the purity analysis is calculated to contain at least 2,500 seeds of any vegetable class. This aspect of the analysis procedure implies that each seed variety has a more appropriate sample weight, reducing measurement uncertainty, as observed by MAAG et al. (2013) working with soy seeds.
Due to the small size of the sample and to the high standard deviation of the beans tests with
100g, the test sample size was increased to 250g, which led to a reduction in the standard deviation and VC (Figure 1). The measurement uncertainty in each defect level for rice (100g), beans (100g) and beans (250g) can be observed in figure 2. Comparing the estimated measurement uncertainties, it was verified that the beans samples presented higher values than the rice samples.
By increasing the beans sample size from 100g to 250g, keeping the same defect level of 1.5%, it was possible to reduce the measurement uncertainty to 41.61%. However, even with the reduction of measurement uncertainty, it was not possible to create ranges of reliability for beans due to the values that were still high. The results found by CORRY et al. (2010) in microbiological tests with food samples with intervals between 10 and 100g corroborate the results herein presented. In the study the quantity of sample collected for analysis purposes was a critical factor to minimize variation between samples, independently from the creation of sub-samples in the main sample.
Sampling precision can be improved twice, theoretically, according to RAMSEY et al. (2001), if sampling mass is increased by a factor of four or if four composite samples are taken. This happens due to the fact that the sample mass is inversely proportional to the variance of the sampling error (RAMSEY et al., 2001).
The higher uncertainty found in the beans grains can be attributed to repeatability. Repeatability was high due to the insufficient sampling size. According to RAMSEY et al. (2001), the heterogeneity of the material is one of the most important factors that contribute to the sampling uncertainty. As reported in the study
Figure 1 -Observeddefect level x intended defect level in rice
classification test - 100g (▲ y = 0.974x; R2 = 0.9915; DPR = 0.152; Coefficient of variation = 11.4%; P<0.0001), bean -100 g(○y = 0.997x; R2 = 0.9604; DPR = 0.700; CV = 24.0%; P<0.0001) and bean - 250 g (●y = 0.998x; R2 = 0.9755; DPR = 0.551; CV = 18.1%; P < 0.0001).
Figure 2 - Prediction of uncertainty for defects in rice
hypothetical classification test - 100g (▲y = 0.218x; R2 = 0.9266; DPR = 0.110; P>0.0001), bean – 100 g (○y = 0.570x; R2 =0.950; DPR = 0.494; P=0.0002) and bean – 250 g (●y = 0.397x;
conducted by CHAMPEIL et al. (2004) for the determination of aflatoxins in grains, 90% of errors associated to the test were attributed to the way working sample was obtained.
As the damage level for rice and beans classification tests was increased, uncertainty levels also increased (Figure 2), with less increase value by damage level for the rice grains. Based on the limits of Type (given by the defect percentage) established by the Normative Ruling no. 6 of rice, it is possible to establish the limit of certainty for the test result and the ranges in which uncertainty related to the Type exists. Thanks to these ranges, classifiers and classification companies may have a criterion to issue a certificate with higher quality in results.
Based on the presented results, which demonstrate the uncertainty intrinsically related to the sample, standards for classified products must contemplate tolerance for each defect level, as it happens in the seed testing (ISTA, 2008). Another way to improve grain classification is the search for development and validation of automated analysis procedures of grains, which may enable the increase in size of the analyzed samples and consequent reduction in measurement uncertainty
and increase in precision.
CONCLUSIONS
The homogenization and sample reduction in the physical classification of rice and beans are not effective, transferring to the final test result a high measurement uncertainty. The sample size indicated by the Normative Ruling did not ensure an appropriate homogenization and should be increased.
By increasing the sample size in the physical classification of beans from 100g to 250g, measurement uncertainty was reduced, improving test quality. However, this increase in test precision and reduction in measurement uncertainty do not allow establishing ranges of reliability, which would enable classifiers to have a criterion to issue a certificate with higher quality in results.
Tests in the grain classification area need to consider the difference in the mean weight of grains to calculate the ideal sample size, as it happens in seed analysis.
ACKNOWLEDGMENTS
To the Conselho Nacional de Desenvolvimento Científico e Tecnológico (CNPq)
for granting the scholarship and supporting the
SAGRES Project. To the team of the Analysis Laboratory for Vegetable Classification (LACV/ DLAB) and, especially, to the Vegetable Classifier
Mendel Dornsback Weeck for the collaboration
with the tests execution . To the quality area of the Metrological Network of Rio Grande do Sul for the support with the design of this study and with the preparation of the uncertainty measurement spreadsheets. To Professor João Riboldi of the Institute of Mathematics of the Universidade Federal do Rio Grande do Sul (UFRGS) for his support with the design of this study.
REFERENCES
ABNT (ASSOCIAÇÃO BRASILEIRA DE NORMAS TÉCNICAS).
Guia para a expressão da incerteza da medição (GUM). 3.ed. Rio de
Janeiro: INMETRO, 2003. 126 p.
ALBANO, F.M.; RAYA-RODRIGUEZ, M.T.R. Validação e garantia da qualidade de ensaios laboratoriais. Porto Alegre: Rede Metrológica,
2009. 136p.
BRASIL. Lei n° 9972, de 25 de maio de 2000. Sislegis. Available from:
<http://sistemasweb.agricultura.gov.br/sislegis/action/detalhaAto.do?metho d=consultarLegislacaoFederal>. Accessed: Dec. 20, 2013.
BRASIL. Ministério da Agricultura, Pecuária e Abastecimento.
Manual de análise sanitária de sementes. Ministério da Agricultura,
Pecuária e Abastecimento. Secretaria de Defesa Agropecuária. Brasília:
Mapa, 2009. 200p.
CHAMPEIL, A. et al. Effects of grain sampling procedures on fusarium mycotoxin assays in wheat grains. Journal of Agricultural and Food Chemistry. v.52, n.20, p.6049-6054, 2004. Available from: <http://
pubs.acs.org/doi/abs/10.1021/jf049374s>. Accessed: Jan. 15, 2014. doi:
10.1021/jf049374s.
CORRY, J. et al. Minimising the between-sample variance in colony counts
on foods. Food Microbiology, v.27, n.5, p.598-603, 2010. Available from:
<http://www.sciencedirect.com/science/article/pii/S0740002010000237>. Accessed: Jan. 30, 2015. doi:10.1016/j.fm.2010.02.002.
EURACHEM-CITAC. Quantifying uncertainty in analytical measurement. 3.ed. London, 2012. 133p.
ISTA (INTERNATIONAL SEED TESTING ASSOCIATION). The purity analysis. In: _____. International rules for seed testing. Bassersdorf, 2008. Cap.3, p.31-37.
MAAG, G.B. et al. Estimativa da incerteza de medição em análise de pureza física. Informativo ABRATES, v.23, n.1, p.33-38, 2013.
MAPA. Instrução Normativa n. 6, de 16 de fevereiro de 2009.
Ministério da Agricultura Pecuária e Abastecimento. Available from: <http://sistemasweb.agricultura.gov.br/sislegis/action/detalhaAto. do?method=consultarLegislacao Federal>. Accessed: Dec. 20, 2013.
RAMSEY, M.H et al. Optimised uncertainty at minimum overall cost to achieve fitness-for-purpose in food analysis. Royal Society of Chemistry,v.126, p.1777-1783, 2001. Availble from: http:// pubs.rsc.org/en/content/articlepdf/2001/an/b104285h. Accessed: