Revista Brasileira de
Engenharia Agrícola e Ambiental
Campina Grande, PB, UAEA/UFCG – http://www.agriambi.com.br
v.19, n.8, p.767–772, 2015
Stochastic simulations of calcium contents in sugarcane area
Gener T. Pereira
1, Daniel D. B. Teixeira
2, Zigomar M. de Souza
3,
Ismênia R. de Oliveira
4& José Marques Júnior
2DOI: http://dx.doi.org/10.1590/1807-1929/agriambi.v19n8p767-772
A B S T R A C T
The aim of this study was to quantify and to map the spatial distribution and uncertainty of soil calcium (Ca) content in a sugarcane area by sequential Gaussian and simulated-annealing simulation methods. The study was conducted in the municipality of Guariba, northeast of the São Paulo state. A sampling grid with 206 points separated by a distance of 50 m was established, totaling approximately 42 ha. The calcium contents were evaluated in layer of 0-0.20 m. Techniques of geostatistical estimation, ordinary kriging and stochastic simulations were used. The technique of ordinary kriging does not reproduce satisfactorily the global statistics of the Ca contents. The use of simulation techniques allows reproducing the spatial variability pattern of Ca contents. The techniques of sequential Gaussian simulation and simulated annealing showed significant variations in the contents of Ca in the small scale.
Simulações estocásticas dos teores de cálcio
em área de cana-de-açúcar
R E S U M O
Objetivou-se, neste trabalho, quantificar e mapear a distribuição espacial e a incerteza do teor de cálcio (Ca) do solo, em área sob o cultivo de cana-de-açúcar por meio da simulação sequencial gaussiana e simulação do arrefecimento simulado. O estudo foi conduzido no município de Guariba, nordeste do estado de São Paulo. Foi estabelecida uma malha amostral contendo 206 pontos separados por uma distância de 50 m totalizando aproximadamente 42 ha. Os teores de cálcio foram avaliados na profundidade de 0-0,20 m. Foram utilizadas técnicas geoestatísticas de estimação, krigagem ordinária e de simulações estocásticas: simulação sequencial gaussiana e a simulação de arrefecimento simulado. A técnica da krigagem ordinária não reproduz satisfatoriamente as estatísticas globais do teor de Ca. A utilização das técnicas da simulação permite a reprodução do padrão da variabilidade espacial do teor de Ca e as técnicas de simulação da sequencial gaussiana e a simulação do arrefecimento simulado mostraram variações significativas dos teores de Ca na pequena escala.
Key words:
geostatistics spatial interpolation
sequential Gaussian simulation simulated annealing
Palavras-chave:
geoestatística interpolação espacial
simulação sequencial gaussiana simulação do arrefecimento simulado
1 Departamento de Ciências Exatas/Faculdade de Ciências Agrárias e Veterinárias/Universidade Estadual Paulista. Jaboticabal, SP. E-mail: genertp@fcav.unesp.br 2 Departamento de Solos e Adubos/Faculdade de Ciências Agrárias e Veterinárias/Universidade Estadual Paulista. Jaboticabal, SP. E-mail: daniel.dbt@hotmail.com;
marques@fcav.unesp.br
3 Departamento de Água e Solo/Faculdade de Engenharia Agrícola/Universidade Estadual de Campinas. Campinas, SP. E-mail: zigomarms@yahoo.com.br
(Autor correspondente)
4 Departamento de Zootecnia/Universidade Federal do Maranhão. Chapadinha, MA. E-mail: ismenia.ribeiro@ufma.br
Introduction
The spatial patterns of soil attributes, crop production or the distribution of pollutant contents are frequently obtained by geostatistical methods (Lin, 2008; Camargo et al., 2008; Siqueira et al., 2010). These methods are of great utility in the study of spatial variations of soil attributes for the most diverse purposes. In the agricultural area, these methods have been frequently applied in the characterization of soil physical, chemical and mineralogical attributes (Camargo et al., 2008), sampling optimization (Pereira et al., 2013), agricultural planning, implantation of sugarcane cultivation systems (Campos et al., 2008), studies on CO2 emissions (Teixeira et al., 2013), soil and nutrient losses through erosion (Sanchez et al., 2009), among others.
Geostatistical methods comprehend many interpolation techniques (Goovaerts, 1997). The ordinary kriging (OK) technique, the most used interpolator in agricultural sciences, stands out for being easily used and relatively simple in the interpretation of its results. This technique is based on a linear interpolation procedure, which provides the best unbiased estimate for properties that vary in space (Teixeira et al., 2012). However, its estimate is smoothed and its variance does not reflect the uncertainty associated with the estimate adequately, since it only depends on data configuration (sampling grid design) and not on the values of the observations (Deustch & Journel, 1998).
As alternatives for the smoothness promoted by OK and the incapacity to reproduce the uncertainties through its variance, stochastic simulations have been widely applied for the most diverse purposes in the last years, among which some stand out: simulation of distribution and spatial variability of heavy metals in the soil, for the identification of polluted areas (Lin, 2008); evaluation of uncertainties of soil chemical (Oliveira et al., 2013) and mineralogical attributes (Silva Júnior et al., 2013), and soil classes (Silva et al., 2015); construction of different scenarios of estimates for soil CO2 (Teixeira et al., 2012) and demarcation of erosion-prone areas (Delbari et al., 2009).
Conditional stochastic simulations, such as sequential Gaussian simulation (SGS) and simulated-annealing simulation (SAS), generate a group of values with a specified mean and variance, and also reproduce the data in many sites (Goovaerts, 2000). In SGS, each simulated value is conditioned to the original data and to all the previously simulated values. SAS, on the other hand, consists of an exhaustive application of the Monte Carlo simulation method, which perturbs or updates a value of the smallest point forming a digital image, “pixel”, through various iterations, until the value of this smallest point honors the histogram and the proposed variogram model (Caers, 2001).
This study aimed to quantify and to map the spatial distribution and the uncertainty of calcium contents in a soil under sugarcane cultivation through sequential Gaussian simulation and simulated-annealing simulation.
Material and Methods
The study area is located in the municipality of Guariba, in the northeast region of the state of São Paulo, Brazil (21º
19' S; 48º 13' W; 640 m). According to Köeppen, the climate of the region is mesothermal with dry winter (Cwa). The soil of the area was classified as eutroferric Red Latosol, with very clayey texture (LVef) (Pereira et al., 2013).
The experimental area has been cultivated with sugarcane for more than thirty years and, during the experiment, the crop was in its fifth year, in the harvest period. The area, with approximately 42 ha, was sampled in the layer of 0-0.20 m, in a regular grid, with georeferenced points at each 50 m, totaling 206 points of soil sampling. The content of calcium (Ca) was determined using the ion exchange resin method, proposed by Raij et al. (2001).
The variability of the Ca contents was previously described through descriptive statistics by calculating mean, median, standard deviation, maximum and minimum values, first quartile, third quartile and the coefficients of asymmetry, kurtosis and variation (CV). For the geostatistical analyses, it is necessary to obtain the data variogram. These variograms determine the spatial structure and are defined as the variance between the difference of pairs of regionalized random variables, Z(x) and Z(x+h), separated by the distance vector h (Eq. 1).
( )
( )
N h( )( ) (
)
2i 1 1
ˆ h Z x Z x h
2N h =
γ =
∑
− + where:
γ(h) - variogram for the distance class h;
N(h) - represents the number of pairs of regionalized variables separated by the distance h; and
Z - values measured at the points x and xi.
Among the permissible variogram models adjusted by the least square method, the variograms with the lowest residual sum of squares were adopted.
After modeling the variogram, the values were interpolated in the non-sampled sites using ordinary kriging (OK), sequential Gaussian simulation (SGS) and simulated-annealing simulation (SAS). OK is a non-stationary algorithm whose estimates are weighted sums of the values of neighboring samples, in which the weights applied to the neighbor value depend on the correlation structure modeled in the variogram (Deutsch & Journel, 1998).
The SGS algorithm assumes a random Gaussian field. Thus, the accumulated density function is totally characterized by the mean and the covariance (Goovaerts, 2001). In this process, the simulation is performed through a Gaussian transformation of the observed data (data normalization), so that each simulated value is conditioned to the original data and to all the previously simulated values.
For the SAS, a stochastic image is formulated as an optimization problem without any specific reference to a random function model. In this study, initial random images, which reproduce the variogram, were disturbed by the change of Z values in two randomly selected sites. The preestablished contrast was the reproduction of the variogram, and the correspondent function was minimized using a standard annealing procedure (Deutsch & Cockerham, 1994).
For each simulation technique, 10 realizations were performed in each cell, from which three were randomly selected for the analyses. The analyses were performed using the modules LOCMAP, GAMV, VMODEL, KB2D, SGSIM and SASIM of the software WinGslib v. 1.03 (Deutsch & Journel, 1998). The generated spatial patterns were edited using the software SURFER v. 9.0 (Golden Software Inc., 2010).
Results and Discussion
The mean Ca content (38.4 mmolc dm-3) and its standard deviation (11.89 mmolc dm-3) were similar to those observed by other authors for the same types of soil and crop (Mello et al., 2006; Souza et al., 2007). The CV value (31.00%) indicates moderate data variability. However, even for low and moderate variabilities, the use of geostatistical techniques is advised for the comprehension of data spatial distribution and possible identification of regions with more similar Ca contents. The Anderson Darling data normality test indicated that Ca contents do not have normal distribution at 5%, a fact commonly reported in evaluations of soil attributes (Souza et al., 2007). However, due to the low values of asymmetry (0.53) and kurtosis (0.53), it was not necessary the use of any procedure of data transformation for the geostatistical analyses (variogram modeling and estimation through OK), since transformations like logarithmic are indicated only for variables with intensities of asymmetry values higher than the unity (Kerry & Oliver, 2007). On the other hand, due to the need for normal distribution in the data for the simulation procedures, data normalization was opportune before variogram modeling. Thus, two variograms were calculated: one with non-transformed data for the estimation through OK and another with normalized data for the estimation through the simulation techniques.
For the non-transformed Ca data, the best adjusted model was the exponential, with nugget effect (C0) = 0.0, sill (C0 + C1) = 150.85 and range (a) = 418.62 m. These results indicate that the model adjusted to the experimental variogram is isotropic, with a null value for the nugget effect, which can be attributed to the fact that all the variability in large and small scales was captured without measurement errors. The best model adjusted to the normalized Ca data was the spherical, with nugget effect (C0) = 0.32, sill (C0 + C1) = 1.030 and range (a) = 377.06 m. The degree of spatial dependence, obtained by the ratio C0/(C0 + C1), indicates that both adopted variograms
had strong spatial dependence (Cambardella et al., 1994), showing that the normalization necessary for the geostatistical simulation methods preserved the structure of dependence of the evaluated attribute (Oliveira et al., 2013).
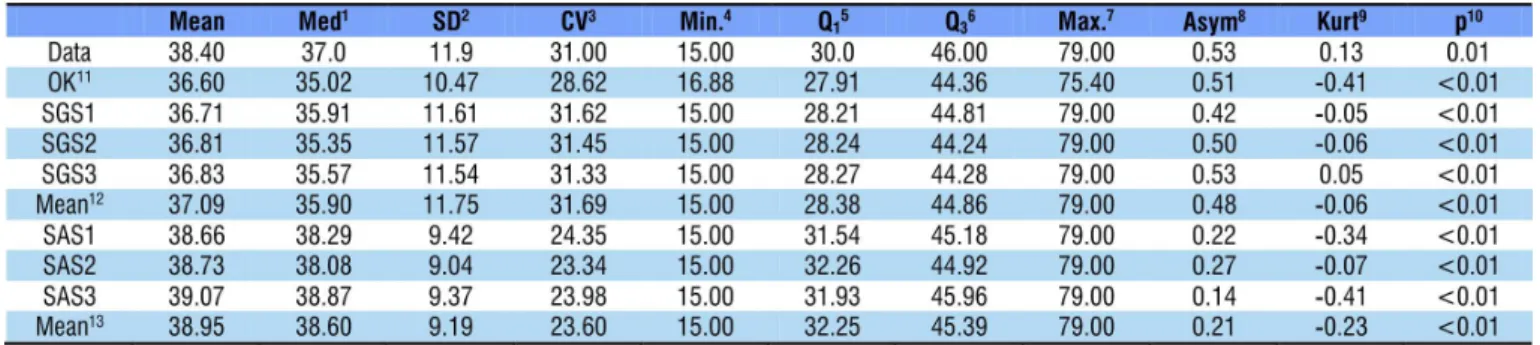
The comparison of the estimations through each geostatistical technique reveals differences between the estimates of soil Ca contents, especially regarding the reproduction of the data sampled in the study area (Table 1). The estimates of the three selected realizations of SGS and SAS are closer to the descriptive statistics of the sample data than the estimations through OK. Similar results were obtained in the comparison between these same techniques for the determination of the spatial pattern of the soil contents of arsenic (Lin, 2008) and lead (Lin et al., 2001) in study areas in Taiwan.
The mean values of Ca contents for SGS (36.71 to 36.83 mmolc dm-3) and SAS (38.66 to 39.07 mmol
c dm
-3) are much closer to the mean Ca content of the sample data (38.4 mmolc dm-3) than the mean obtained through OK (36.60 mmol
c dm -3) (Table 1). All the mean estimates of SGS realizations are below the mean of the data, while mean estimates of SAS realizations are slightly above it. The same tendency was observed for the values of Median and First quartile (Q1).
The values of standard deviation (SD) for SGS (11.54 to 11.61 mmolc dm-3) are much closer to the SD of the sample data (11.9 mmolc dm-3) than the SD of SAS realizations (9.04 to 9.42 mmolc dm-3). The SD value provided by OK (10.47 mmolc dm-3) is closer to the SD of the data (11.9 mmol
c dm -3) compared with SAS, but lower than the SD of SGS.
These results illustrate that SGS reproduces the SD of the sample data better than OK values and SAS realizations; also, the results shown in Table 1 indicate that the kriging process and the SAS realization may not preserve data variability and asymmetry, while SGS realizations reproduce the empirical statistics of Ca contents and provide results much closer to the global statistics of the measurements of Ca contents than the ones provided by OK and SAS realizations. These results agree with those obtained by Delbari et al. (2009), when studying the uncertainties of soil water content, who observed that SGS maintains the variability of the observed data.
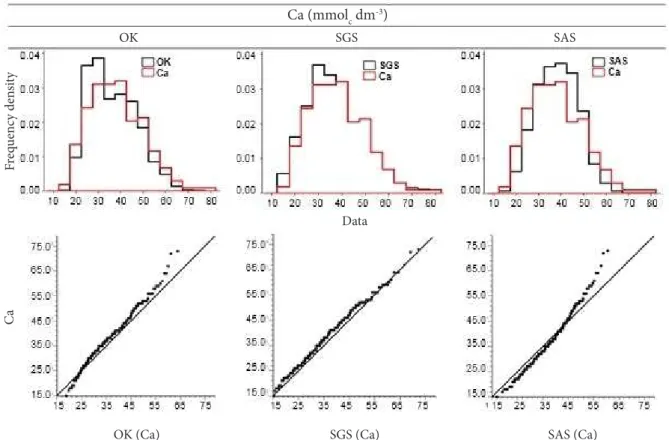
The reproduction of the data histogram through the realizations of the simulations and OK can be verified through Quantile-Quantile plots or simply Q-Q plots (Figure 1). In the graphs, the quantile of the estimated and/or simulated values are plotted against the correspondent quantiles of the sample
1Median; 2Standard deviation; 3Coefficient of variation (%); 4Minimum value; 5First quartile; 6Third quartile; 7Maximum value; 8Coefficient of asymmetry; 9Coefficient of kurtosis; 10p < 0.05 significant at 5%; p < 0.01 significant at 1%; p > 0.05 not significant at 5%, by Anderson-Darling test; 11Estimates through ordinary kriging; 12Mean value of the 10 observations through sequential Gaussian simulation (SGS); 13Mean value of the 10 observations through simulated-annealing simulation (SAS)
data (Deustch & Journel, 1998). A perfect reproduction of the quantiles of the sample data must ensure that the quantiles of both distributions are identical, i.e., all the points in the graph must fall on the 1:1 line.
Both the histogram and the Q-Q plot indicate a better performance of SGS in the reproduction of the empirical data of soil Ca contents, especially in the upper and lower tails of the distribution. On the other hand, SAS shows a lower variability and a weak performance, especially in the reproduction of the Ca data in the upper tail. In the OK graphs, its smoothness effect is evident, i.e., low values are overestimated while high values are underestimated (Teixeira et al., 2012). The distribution of the OK estimates does not reproduce the lower and upper tails of the empirical distribution of Ca data.
The maps estimated by OK indicate that the areas with higher Ca contents are located to the southwest of the study area (Figure 2). These maps visually confirmed the
characteristic of smoothness of OK, that is, they smoothed the local details of the spatial variation of the Ca contents in the area. This smoothing of the results is due to the criterion of least squares of the kriging algorithm, which overestimates low values and underestimates relevant values of Ca contents (Lin et al., 2001; Oliveira et al., 2013; Silva Júnior et al., 2013).
In the map generated by OK estimates, since the maps of the simulations also show an area with high spatial continuity of high Ca contents to the southwest of the study area (Figure 2), the maps of the simulations emphasize the significant variation for short distances and provide a measurement of the spatial uncertainty. The maps of the simulated values seem more realistic than the maps of OK estimates, since they reproduce the modeled spatial variability of the sampled grid. Therefore, the stochastic simulation is preferred over kriging for all the applications in which the spatial variability of the studied attributes must be preserved (Goovaerts, 2000).
Figure 1. Histograms and Q-Q plots of the calcium content (mmolc dm-3) distributions generated by the techniques of
ordinary kriging (OK), sequential Gaussian simulation (SGS) and simulated-annealing simulation (SAS)
Figure 2. Spatial patterns of calcium contents (mmolc dm-3) generated by the techniques of ordinary kriging (OK),
sequential Gaussian simulation (SGS) and simulated-annealing simulation (SAS)
Ca (mmolc dm-3)
Fr
eq
uen
cy den
si
ty
Ca
OK (Ca) SGS (Ca) SAS (Ca)
Data
OK SGS SAS
Each one of the three realizations is considered as an equally probable representation of the Ca contents in the studied area (Figure 2). Thus, they honor the 206 observations and reproduce approximately the sample histogram and the variogram model. The differences between the maps of the realizations provide a measurement of the uncertainty (Teixeira et al., 2012). Thus, the points with high Ca contents can be considered exact, if they appear in most realizations. The knowledge on the uncertainty allows a more precise evaluation and delimitation of areas with high or low contents of the studied attribute (Delbari et al., 2009).
The impact of a decision, such as the application of certain amount of fertilizer, can be investigated using a simulated map that reproduces aspects of the spatial dependence pattern or other statistics considered important for the problem, such as the connection between high values and the correlation with other secondary attributes. Furthermore, the viability of many equally probable realizations allows accessing the uncertainty of the consequences of the decision, such as the leaching of a fertilizer and the contamination of groundwater, which can be a result of the imperfect knowledge on the spatial distribution of Ca contents.
Conclusions
1. The technique of ordinary kriging does not reproduces satisfactorily the global statistics of calcium contents in the soil.
2. The use of simulation techniques allows the reproduction of the spatial variability pattern of calcium contents.
3. The techniques of sequential Gaussian simulation and simulated-annealing simulation showed significant variations of calcium contents in the small scale.
Literature Cited
Caers, J. Automatic histogram and variogram reproduction in simulated annealing simulation. Mathematical Geology, v.33,p.167-190, 2001. http://dx.doi.org/10.1023/A:1007583217899 Camargo, L. A.; Marques Júnior, J.; Pereira, G. T.; Horvat, R. A.
Variabilidade espacial de atributos mineralógicos de um Latossolo sob diferentes formas de relevo. I - Mineralogia da fração argila. Revista Brasileira de Ciência do Solo, v.32, p.2269-2277, 2008. http://dx.doi.org/10.1590/S0100-06832008000600006
Cambardella, C. A.; Moorman, T. B.; Novak, J. M.; Parkin, T. B.; Karlen, D. L.; Turco, R. F.; Konopka, A. E. Field-scale variability of soil properties in central Iowa soils. Soil Science Society of American Journal, v.58, p.1240-1248, 1994. http://dx.doi. org/10.2136/sssaj1994.03615995005800050033x
Campos, M. C. C.; Marques Júnior, J.; Pereira, G. T.; Souza, Z. M.; Barbieri, D. M. Aplicação de adubo e corretivo após o corte da cana-planta utilizando técnicas geoestatísticas. Ciência Rural, v.38, p.974-980, 2008. http://dx.doi.org/10.1590/S0103-84782008000400011
Delbari, M.; Afrasiab, P.; Loiskandl, W. Using sequential Gaussian simulation to assess the field-scale spatial uncertainty of soil water content. Catena, v.79, p.163-169, 2009. http://dx.doi.org/10.1016/j. catena.2009.08.001
Deutsch, C. V.; Cockerham, P. Practical considerations in the application of simulated annealing to stochastic simulation. Mathematical Geology, v.26, p.67-82, 1994. http://dx.doi. org/10.1007/BF02065876
Deuscth, C. V.; Journel, A. G. GSLIB: Geostatistical software library and user´s guide. New York: Oxford University Press, 1998. 369p. Golden Software Inc. Surfer for Windows, Realease 9.0. Surface
mapping system, 2010.
Goovaerts, P. Geostatistics for natural resources evaluation. New York: Oxford University Press, 1997. 483p.
Goovaerts, P. Estimation or simulation of soil properties? An optimization problem with conflicting criteria. Geoderma, v.97, p.165-186, 2000. http://dx.doi.org/10.1016/S0016-7061(00)00037-9 Goovaerts, P. Geostatistical modeling of uncertainty in soil science.
Geoderma, v.103, p.3-26, 2001. http://dx.doi.org/10.1016/S0016-7061(01)00067-2
Kerry, R; Oliver, M. A. Determining the effect of asymmetric data on the variogram. I. Underlying asymmetry. Computers & Geosciences, v.33, p.1212-1232, 2007. http://dx.doi.org/10.1016/j. cageo.2007.05.008
Lin, Y. P. Simulating spatial distributions, variability and uncertainty of soil arsenic by geostatistical simulations in geographic information system. Open Environmental Sciences, v.2, p.26-33, 2008. http://dx.doi.org/10.2174/1876325100802010026
Lin, Y. P.; Chang, T. K.; Teng, T. P. Characterization of soil lead by comparing sequential Gaussian simulation, simulated annealing simulation and kriging methods. Environmental Geology, v.41, p.189-199, 2001. http://dx.doi.org/10.1007/s002540100382 Mello, G.; Bueno, C. R. P.; Pereira, G. T. Variabilidade espacial das
propriedades físicas e químicas do solo em áreas intensamente cultivadas. Revista Brasileira de Engenharia Agrícola e Ambiental, v.10, p.294-306, 2006. http://dx.doi.org/10.1590/S1415-43662006000200008 Oliveira, I. R.; Teixeira, D. D. B.; Panosso, A. R.; Camargo, L. A.; Marques Júnior, J.; Pereira, G. T. Modelagem geoestatística das incertezas da distribuição espacial do fósforo disponível no solo, em área de cana-de-açúcar. Revista Brasileira de Ciência do Solo, v.37, p.1481-1491, 2013. http://dx.doi.org/10.1590/S0100-06832013000600005 Pereira, G. T.; Souza, Z. M.; Teixeira, D. D. B.; Montanari, R.; Marques Júnior, J. Optimization of the sampling scheme for maps of physical and chemical properties estimated by kriging. Revista Brasileira de Ciência do Solo, v.37, p.1128-1135, 2013. http:// dx.doi.org/10.1590/S0100-06832013000500002
Raij, B. van; Andrade, J. C.; Cantarella, H.; Quaggio, J. A. Análise química para avaliação da fertilidade de solos tropicais. Campinas: Instituto Agronômico, 2001. 285p.
Sanchez, R. B.; Marques Júnior., J.; Pereira, G. T.; Souza, Z. M.; Martins Filho, M. V. Variabilidade espacial de atributos do solo e de fatores de erosão em diferentes pedoformas. Bragantia, v.68, p.873-884, 2009. http://dx.doi.org/10.1590/S0006-87052009000400030 Silva, A. F.; Pereira, M. J.; Zimback, C. R. L.; Landim, P. M. B.; Soares,
A. Simulação sequencial de atributos diagnósticos do solo. Revista Brasileira de Engenharia Agrícola e Ambiental, v.19, p.418-425, 2015. http://dx.doi.org/10.1590/1807-1929/agriambi.v19n5p418-425 Silva Júnior, J. F.; Pereira, G. T.; Camargo, L. A.; Marques Júnior, J.
Siqueira, D. S.; Marques Júnior, J.; Pereira, G. T. The use of landforms to predict the variability of soil and orange attributes. Geoderma, v.155, p.55-66, 2010. http://dx.doi.org/10.1016/j. geoderma.2009.11.024
Souza, Z. M.; Barbieri, D. M.; Marques Júnior, J.; Pereira, G. T.; Campos, M. C. C. Influência da variabilidade espacial de atributos químicos de um latossolo na aplicação de insumos para cultura de cana-de-açúcar. Ciência e Agrotecnologia, v.31, p.371-377, 2007. http://dx.doi.org/10.1590/S1413-70542007000200016
Teixeira, D. D. B.; Bicalho, E. S.; Panosso, A. R.; Cerri, C. E. P.; Pereira, G. T.; La Scala Júnior, N. Spatial variability of soil CO2 emission in a sugarcane area characterized by secondary information. Scientia Agricola, v.70, p.195-203, 2013. http://dx.doi.org/10.1590/S0103-90162013000300008