Printed version ISSN 0001-3765 / Online version ISSN 1678-2690 http://dx.doi.org/10.1590/0001-3765201620160499
www.scielo.br/aabc
Propolis from Southwest of Parana produced by selected bees: Influence of
seasonality and food supplementation on antioxidant activity and phenolic profile
MATHEUS A. CALEGARI1
, ANACLARA PRASNIEWSKI1
, CLEIDIANE DA SILVA1
, RICARDO Y. SADO2
, FABIANA M.C. MAIA2
, LARISSA M.S. TONIAL1
and TATIANE L.C. OLDONI1
1
Departamento de Química, Universidade Tecnológica Federal do Paraná/UTFPR, Campus Pato Branco, Via do Conhecimento, Km 1, 85503-390 Pato Branco, PR, Brazil 2
Departamento de Ciência Animal, Universidade Tecnológica Federal do Paraná/UTFPR, Campus Dois Vizinhos, Estrada para Boa Esperança, Km 4, 85660-000 Dois Vizinhos, PR, Brazil
Manuscript received on July 28, 2016; accepted for publication on September 29, 2016
ABSTRACT
Propolis produced by selected bees Apis mellifera were collected from March to June of 2013 and in
March of 2015 and analyzed in order to evaluate the influence of climate, colony of origin, and food supplementation of colonies on the content of total phenolic and flavonoid by chromatographic analysis
and antioxidant activity by radical scavenging of 2,2-diphenyl-1-picrylhydrazyl hydrate (DPPH) and 2,2’-azino-bis(3-ethylbenzothiazoline-6-sulphonic acid) (ABTS) and ferric reducing antioxidant power (FRAP) methods. The Principal Component Analysis (PCA) was carried out with propolis collected in 2013 and two clusters were formed. Propolis produced in the months of March and April showed a higher content of total phenolic compounds (TPC) and antioxidant capacity than those produced in May and June. The results of PCA obtained from samples collected in March of 2013 and 2015 showed two clusters, and propolis collected in 2015 were more bioactive and presented a higher content of TPC. The
chromatographic analysis of extracts allowed the identification of phenolic acids p-coumaric, ferulic and
caffeic with similar chemical profiles that could be closely related to the botanical origin of propolis. It can be concluded that the season and food supplementation of colonies influenced the chemical composition
and the biological activity of samples analysed.
Key words: Apis mellifera, ethanolic extract, polyphenols, principal component analysis.
Correspondence to: Tatiane Luiza Cadorin Oldoni E-mail: tatianeoldoni@utfpr.edu.br
INTRODUCTION
Propolis is a natural resinous material collected by bees from different vegetable sources, and used to protect the hive against microorganisms, enclose small spaces and embalm foreign intruders (Daneshmand et al. 2015). It is widely known for presenting diverse biological properties such as anti-inflammatory (Luis-Villaroya et al. 2015,
Valenzuela-Barra et al. 2015, Wang et al. 2014), antibacterial (Gülçin et al. 2010, Luis-Villaroya et al. 2015, Oldoni et al. 2011), antioxidant (Cottica et al. 2015, Luis-Villaroya et al. 2015, Mahmoud et al. 2015, Oldoni et al. 2015), antifungal (Luis-Villaroya et al. 2015, Da Silva et al. 2015) and anticariogenic (Gülçin et al. 2010, Oldoni et al. 2011).
(Miguel et al. 2010). The antioxidants act as defense agents against free radicals that are naturally present in organisms. Studies indicate that these compounds protect the organism from chronic diseases caused by oxidative stress, such as cancer and metabolic disorders (Wang et al. 2014, De-Melo et al. 2014, Kumazawa et al. 2004, Mohammadzadeh et al. 2007).
Studies described in the literature show that the chemical composition of propolis is varied and complex and it is intimately related to the biodiversity of flora, geographical region and climate where it is collected (Buratti et al. 2007, Gong et al. 2012, López et al. 2014). It is generally composed of resin, vegetable balm, wax, essential oils, pollen, and several other substances (Kalogeropoulos et al. 2009, Luis-Villaroya et al. 2015, Valenzuela-Barra et al. 2015).
Analysis of TPC and total flavonoids content (TFC) and the determination of antioxidant activity, contribute to the determination of both chemical and biological composition of propolis, allowing a relationship to be established with its geographical origin (Falcão et al. 2013). Nevertheless, a detailed discussion could be promoted if chemometric tools were used. Among them, PCA receives attention because it allows the evaluation of dataset, establishing relationships between variables, reducing its dimensions, and maintaining most of the statistical information (Ranđelovic et al. 2015).
Therefore, the goals of this study were to determine the influence of climate, origin of colony, and food supplementation of colonies in the phenolic profile by High-Performance Liquid Chromatography with Diode-Array Detection (HPLC-DAD), TPC and TFC and the antioxidant activity in Brazilian propolis produced by selected bees (by means of the animal model approach for weight at the emergence of Africanized queens) collected from March to June of 2013 and March of 2015, in addition to classifying these samples using the parameters evaluated, and the PCA tool.
MATERIALS AND METHODS REAGENTS
The reagents DPPH, ABTS, (6-hydroxy-2,5,7,8-tetramethylchroman-2-carboxylic acid) (Trolox), 2,4,6-Tripyridyl-s-triazine (TPTZ) and authentic standards (grade HPLC) were acquired from Sigma Aldrich Co. (St. Louis, MO) with ≥ 99% purity. All chemical products were of analytical grade and its aqueous solutions were prepared with ultrapure water (Milli-Q system).
SAMPLE COLLECTION
The samples of propolis were acquired from selected colonies of Africanized honey bees (Hymenoptera: Apidae) collected at an apiary within the Unidade de Ensino e Pesquisa de Apicultura (UNEPE) in Federal Technological University of Parana, Dois Vizinhos, Parana, Brazil (latitude: -25,699063°, longitude: - 53,095273°, altitude: 546m). The collections were performed between March and June of 2013 and March of 2015. The selection of Africanized bees was done through generations and was based on the weight of queen at emergence. In 2013 the colonies were under systematic selection and in 2015 under relaxed selection. In 2015 the colonies received food supplementation every three days throughout the year. Samples were collected of propolis produced by fifth generation bees and obtained from three distinct colonies. The selection of the colonies used in this study was based on phenotypic reference to the potential of the bees.
The identification used in this study is described in Table I relates to the variables: month of collection, year, color, and colony.
SAMPLE PREPARATION
PREPARATION OF ETHANOLIC ExTRACT OF PROPOLIS (EEP)
The EEP was prepared as described by Oldoni et al. (2015). Samples (2 g) of propolis were adding 25 mL of ethanol:water 80:20 (v v-1) was added. The total volume was transferred to a thermostatically controlled water bath at 70 ºC and held for 45 min. The samples were cooled and filtered using qualitative filter paper. All extracts and analyses were performed in triplicate.
ANTIOxIDANT ACTIVITy USING THE ABTS METHOD
The antioxidant activity was performed through the ABTS method according to Re et al. (1999) where the ABTS•+ radical was formed by the reaction of 7 mmol L-1 of ABTS with potassium persulfate 140 mmol L-1, incubated at 25 °C in the dark for 16
hours. The radical was diluted with ethanol and resulted in an absorbance value of 0.700 ± 0.200 at 734 nm. Under dark conditions, 3.0 mL of the ABTS•+ solution was added to 30 µL of EEP (16
g L-1) and the absorbance was read at 734 nm at a spectrophotometer after 6 min. Ethanol was used as a blank and Trolox was used as reference in concentrations that varied from 100 to 2000 μmol L-1. The results of antioxidant activity were
equivalent to the antioxidant capacity of Trolox per gram of sample (μmol Trolox g-1
).
ANTIOxIDANT ACTIVITy USING THE DPPH FREE RADICAL SCAVENGING METHOD
The antioxidant activity by the free radical scavenging method DPPH was performed as described by Brand-Williams et al. (1995) where the reaction medium consisted in 0.5 mL of EEP (1.6 g L-1), 3 mL of ethanol and 0.3 mL of radical DPPH solution 0.5 mmol L-1 in ethanol. The mixture was
incubated without light at room temperature for 45 min. and, later, the absorbance was measured using a spectrophotometer (model UV-VIS Lambda 25, Perkin Elmer) at 517 nm. The ethanol was used as blank and the quantification was performed based on an analytical curve using Trolox as standard in TABLE I
Identification’s table of samples of propolis.
Code of samples Month of collection (2013) Color Colony
A A1
A2 A3 A4
03 04 05 06
Greenish brown Greenish brown
Red Red
20
B B1
B2 B3 B4
03 04 05 06
Brown Chesty Red Red
02
C C1
C2 C3 C4
03 04 05 06
Greenish brown Chesty Brown Brown
44
Code of samples Month of collection (2015*) Color Colony
D D1
D2 D3
03 Red
Red Red
20 02 44
concentrations that varied from 15 to 200 μmol L-1
. The results were expressed in μmol of Trolox per gram of propolis (μmol Trolox g-1
).
ANTIOxIDANT ACTIVITy USING THE FRAP METHOD
The antioxidant activity by the FRAP was proposed by Benzie and Strain (1996). The FRAP reagent was obtained from a mixture of 25 mL of acetate buffer 0.3 mol L-1
, 2.5 mL of a solution of TPTZ, 10 mmol L-1 and 2.5 mL of iron chloride in an aqueous solution at 20 mmol L-1, used after preparation.
The method consisted of a mixture of 100 µL of EEP (1.6 g L-1) with 3 mL of FRAP reagent. The mixture was homogenized and kept in a water bath at 37 °C for 30 min. and, next, the absorbance in 595 nm was determined by a spectrophotometer (model UV-VIS Lambda 25, Perkin Elmer). The FRAP reagent was used as a blank and an aqueous solution of ferrous sulphate (100 - 2000 μmol L-1)
was used for the calibration curve. The results were expressed as μmol of Iron2+ ion per gram of propolis (μmol Fe2+ g-1
).
TOTAL PHENOLIC CONTENT
The TPC was determined through colorimetric analysis using the Folin-Ciocalteau reagent (Sin-gleton et al. 1998). In a test tube, 0.5 mL of EEP (3.2 g L-1) was added, 2.5 mL of Folin-Ciocalteau
reagent diluted in 10 g L-1 and 2.0 mL of Na2CO3 at 40 g L-1. After incubation without light for a period of 2 hours at room temperature, the absorbance was measured in a spectrophotometer (model UV-VIS Lambda 25, Perkin Elmer) at 740 nm. The blank was performed using ethanol:water 80:20 (v v-1). The TPC of the extracts was determined by com-parison with a standard calibration curve of gallic acid and represented in equivalent mg of gallic acid (EAG) per gram of propolis (mg EAG g-1).
TOTAL FLAVONOID CONTENT
The TFC present in EEP was determined by applying the colorimetric method described by
Jurd and Geissman (1956). An aliquot of 0.5 mL of EEP (16 g L-1) was added to a series of tubes identified as with or without nitrate. In the tubes that received nitrate, 4.3 mL of ethanol:water 80:20 (v v-1) were added, and in those tubes that had not
received nitrate, 4.4 mL of ethanol:water 80:20 (v v-1) was added. In all tubes, 0.1 mL of potassium
acetate 1 mol L-1 was added. In the series of tubes
identified as “with nitrate”, 0.1 mL of aluminum nitrate at 10% was added. A control (blank) was also prepared from 4.9 mL of ethanol at 80% and 0.1 mL of potassium acetate. After 40 min., the absorbance was measured in a spectrophotometer (model UV-VIS Lambda 25, Perkin Elmer) at 415 nm. The TFC was determined by comparison with the calibration curve using quercetin as standard, and the results were expressed in mg of equivalent to quercetin (EQ) per gram of propolis (mg EQ g-1
).
HIGH-PERFORMANCE LIQUID
CHROMATOGRAPHy WITH PHOTODIODE ARRAy DETECTION (HPLC-PDA)
For the analysis by HPLC-PDA a volume of 10 µL of EEP was injected at a concentration of 30 g L-1 in a liquid chromatography instrument coupled to a detector of photodiode array (PDA) (Varian 920-LC). An analytical column MICROSORB–MV 100 C18 was used; the composition of the mobile phase was constituted of (A) H2O:CH3COOH 98:2 (v v-1) and (B) H2O:CH3COOH:CH3CN 58:2:40 (v v v-1), and elution was made in the gradient mode starting with 5% solvent B to 7% of B in 7 minutes, 20% B in 15 minutes, 50% B in 30 minutes, 90% B in 50 minutes, and 95% B in 55 minuteswith flow of 1 mL min.-1and the column was maintained at
a constant temperature of 30oC. The identification
was performed through comparison of the retention time and maximum absorbance wavelength with authentic standards.
MULTIVARIATE ANALySIS
on the propolis characterization (ABTS, DPPH, FRAP, TFC and TPC). The pre-processing ap-proach of the data used in this study was autoscal-ing, where each variable is centered in the average and divided by its standard deviation. Samples of propolis produced in the months from March to June 2013 were submitted to multivariate analysis, through the PCA to check the influence of season -ality in qu-ality of material. After that, the results obtained from samples produced in March of 2013 and 2015 were compared with the main objective of verifying the influence of supplementation and year of production in the chemical composition of propolis.
RESULTS AND DISCUSSION
Propolis produced in March and April of 2013 showed a difference in color (Table I) and higher
results for antioxidant activity and content of TPC when compared with those produced in May and June (Table II) of the same year, indicating that there is a variation in chemical composition of the material and this variation can be related to the month of production. Among the samples of propolis collected in March of 2013 and 2015 the best results for TPC and TFC content as well as antioxidant activity (Table II) were obtained for propolis collected in March of 2015 suggesting that food supplementation of colonies can improve the quality of material. The antioxidant activity through the ABTS radical scavenging varied from 25.5 to 439.2 µmol Trolox g-1, corresponding to samples C4 and D3 respectively.
Samples C4 and D3 also presented the lowest and highest capacity to scavenge the radical DPPH,
TABLE II
Total content of phenolic and flavonoid compounds and antioxidant activity determined by the FRAP, ABTS and DPPH methods.
Code ABTS DPPH FRAP Phenolic Flavonoid
(μmol Trolox g-1
) (μmol Fe2+ g-1
) (mg EAG g-1
)* (mg EQ g-1 )** 2013
A1 85.5 ± 1.33c
39.2 ± 5.39b
243.9 ± 29.18b
17.9 ± 0.73a
1.23 ± 0.09b A2 84.9 ± 2.88c 40.6 ± 0.55b 250.2 ± 31.58b 16.9 ± 0.46b 0.92 ± 0.07c A3 89.1 ± 2.90b
41.9 ± 0.94b
229.4 ± 7.85c
18.3 ± 0.40a
1.00 ± 0.06c A4 57.2 ± 5.90f
27.5 ± 4.80c
90.5 ± 8.03f
10.0 ± 0.25d
0.34 ± 0.06f B1 78.2 ± 0.81d
25.3 ± 0.46d
121.0 ± 6.13e
10.0 ± 0.46d
0.62 ± 0.03e B2 92.2 ± 3.10b 29.0 ± 3.07c 223.6 ± 5.81c 13.4 ± 0.59c 0.56 ± 0.06e B3 49.1 ± 4.16h
23.2 ± 1.94d
112.5 ± 6.19e
10.2 ± 0.47d
0.48 ± 0.03e B4 55.2 ± 3.82g
21.0 ± 1.07d
124.0 ± 6.82e
8.54 ± 0.31e
0.24 ± 0.08g C1 109.2 ± 1.19a 49.4 ± 2.03a 286.7 ± 7.88a 17.0 ± 0.79b 2.19 ± 0.06a C2 53.4 ± 0.91g
30.0 ± 0.58c
267.1± 4.99a
13.5 ± 0.27c
0.79 ± 0.13d C3 61.5 ± 1.78e
21.0 ± 1.05d
152.7 ± 5.56d
8.67 ± 0.37e
0.65 ± 0.16e C4 25.5 ± 1.39i
11.8 ± 0.34e
89.7 ± 3.00f
5.36 ± 0.23f
0.16 ± 0.02g
RSD (%) 4.18 8.26 7.51 3.87 10.90
2015 D1 370.7 ± 5.57b
145.2 ± 12.80b
1041.0 ± 95.44a
39.4 ± 3.92b
3.03 ± 0.19b D2 298.1 ± 25.1c
159.7 ± 24.63b
690.7 ± 49.80b
36.6 ± 0.94b
5.56 ± 0.92a D3 439.2 ± 3.51a
235.6± 8.14a
638.1 ± 17.64b
48.2 ± 1.29a
1.02 ± 0.13c
RSD (%) 4.54 10.1 6.85 6.09 20.6
The same letter in the column, are not significantly different at the level of 0.05 according to ANOVA. The value is the average ± standard deviation (n = 4). RSD: Relative Standard Deviation.
*equivalents to gallic acid.
11.8 and 235.6 µmol of Trolox g-1, respectively (Table II). Kalogeropoulos et al. (2009) evaluated the antioxidant activity of ethanolic propolis extracts originating from Greece and Cyprus through the DPPH radical scavenging method and obtained as response values between 0.33 and 1.11 mmol Trolox g-1, respectively.
Sample D1 produced in 2015 was the most successful in reducing the complex Fe3+ to Fe2+, 1041.0 µmol Fe2+ g-1, and presented high TFC (3.03 mg EQ g-1) (Table II). However, sample C4, produced in 2013, showed the lowest antioxidant activity through the FRAP method and the lowest TFC, 89.7 µmol of Fe2+ g-1 and 0.16 mg EQ g-1, respectively.
A high variability of results was also observed in propolis originating from Maringá – PR, which showed variation from 528 to 2068 μmol Fe2+ g-1
of propolis for antioxidant activity through the FRAP method, and from 10 to 26 mg EQ g-1 for the TFC (Cottica et al. 2011). In propolis produced in Transylvania, values between 740 and 2540 µmol Fe2+ g-1 were determined (Mihai et al. 2011).
The lowest and highest contents of TPC were observed for C4 and D3 samples, with 5.36 and 48.2 mg EAG g-1, respectively. Propolis collected in Anhui, China, showed values for TPC that
varied from 174.7to 235.6 μg EAG mg-1
(yang et al. 2011). Matos et al. (2014) evaluated the content of TPC in propolis collected in the Northeast of Brazil and obtained values values between 7.68 to 36.78 ± 1.52 mg EAG g-1, corroborating the results of this study.
It can be concluded that there is a signifi cant diff erence among propolis produced in diff erent months and years by fi fth generation bees. It is evident that propolis produced in 2015 is rich in phenolic compounds which should be directly related to higher antioxidant activity.
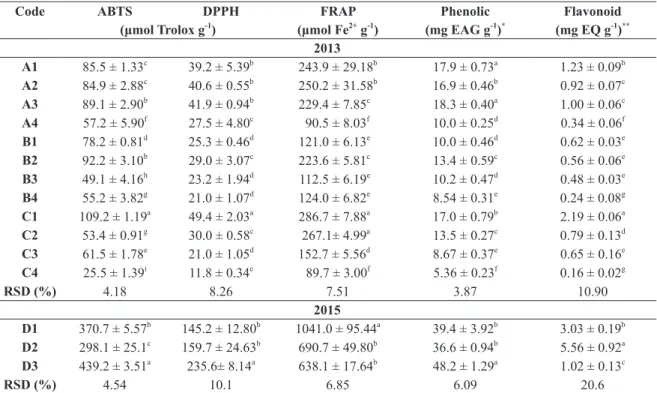
PCA is a technique used in multivariate analy-sis, allowing eased visualization of all information contained in a data set and classifi cation of samples according to similarity, determination of objects showing diff erent properties from others (outliers), and defi nition of important variables for classifi ca-tion (Morlock et al. 2014). In the current study, the fi rst PCA (Figure 1) was performed using results obtained from samples collected in the summer and fall of 2013. Two principal components (PCs) de-scribed 92% of the total data variability. PC1 and PC2 described 86.2 and 5.8% of the variability re-spectively.
There were two general clusters on the 2D PC score (Figure 1a), one group corresponding
to samples collected in March and April, with the exception of sample A3, and the other group was composed of samples collected in May and June, with the exception of sample B1. All parameters evaluated had a positive correlation with PC1 and their concentration in sample collected in March and April was significantly higher. According to Figure 1b, PC2 showed a negative correlation with TPC and FRAP while DPPH, ABTS and TFC showed a positive correlation.
Nevertheless, results showed that is impossible to group the samples in relation to the colony, which indicates that the physical-chemical characteristics of the propolis cannot be associated with these classes.
The variations in the results for samples collected from March to June 2013 can be explained by variations in temperature observed in this period (Table III). Depending on the yield in the production of propolis in UTFPR - campus Dois Vizinhos, samples were collected between summer and fall, as well as in the transitional period between seasons. In southern Brazil there is a gradual decrease in temperature during this period and the change in average temperature directly influences the activity of bees, that is, the lower the temperature, the lower the activity of the bees will be. According to the data obtained by Jiang et al. (2016) activity of bees becomes more energetic when the temperature exceeds 25 °C and relative
humidity is between 60% and 70%. It was also observed that the bees leave their hives at sunrise and cease activities at sunset.
In 2013 changes were observed in the average temperatures of 5 °C and 6 °C for the minimum and maximum respectively between the months of March to June, with an average maximum above 25 °C in March and April. The propolis samples collected in the months with the lowest average temperature showed the lowest levels for TPC and TFC, as well as for the antioxidant activity. It is possible that due to the lower activity presented by bees and lower availability of material collected, product quality was affected, and as a result, different biological activities were observed.
In the study by McCall and Primack (1992), the shape of the flower, light, and temperature of the year are the most important variables that influence the rate of visitation of insects to flowers. Malerbo-Souza and Silva (2011) observed in their results that Apis mellifera bees have a different foraging
behavior (insects searching for food) during the year. The bees collected less nectar in July 2007 (winter) and more in February 2008 (summer), which correlates with our results.
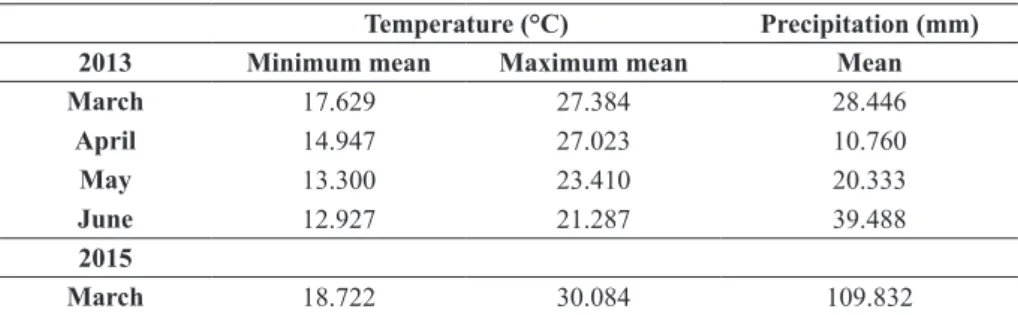
A second PCA was performed with samples collected in March of 2013 and 2015. The main objective was to compare the influence of year of production and food supplementation in the qual -ity of propolis. Two PCs described 96.3% of the
TABLE III
Temperature and precipitation data in 2013 and 2015.
Temperature (°C) Precipitation (mm)
2013 Minimum mean Maximum mean Mean
March 17.629 27.384 28.446
April 14.947 27.023 10.760
May 13.300 23.410 20.333
June 12.927 21.287 39.488
2015
March 18.722 30.084 109.832
total data variability. PC1 and PC2 described 75.8 and 20.5% of the variability respectively. Two gen-eral clusters on the 2D PC score (Figure 2a) were formed related to the samples of 2013 and 2015. All parameters evaluated had a positive correla-tion with PC1 and their concentracorrela-tion in samples collected in 2015 was signifi cantly higher. The pa-rameter fl avonoid is related to the D2 sample, while results obtained by the FRAP method were higher for D1 sample. PC2 showed a negative correlation with TPC, ABTS and DPPH while FRAP and TFC showed a positive correlation (Figure 2b).
These results indicate that, despite diff erent methods being used to evaluate the antioxidant activity, there is a strong positive correlation between content of TPC and antioxidant activity by DPPH and ABTS methods (Figure 2b), indicating that the antioxidant activity by these methods could be related to TPC content.
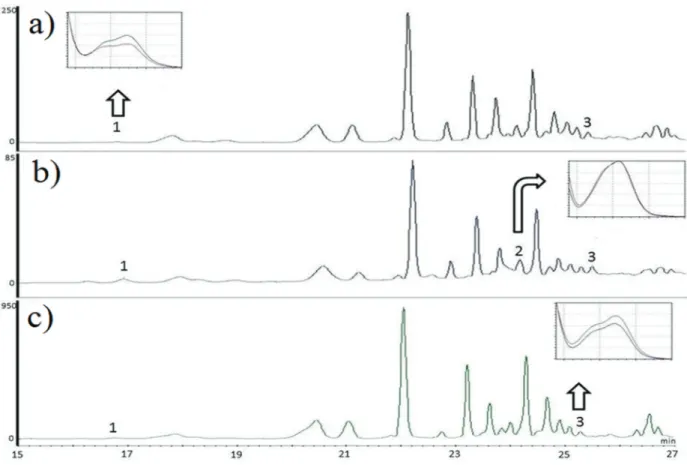
The phenolic profi les of EEP were identifi ed by using High Performance Liquid Chromatography and the samples A2, A4 and D1 (Figure 3) are representative of summer and fall of 2013 and 2015 respectively and presented a chromatographic profi le with diff erences in intensities of absorbance. The phenolic acids p-coumaric, ferulic and caff eic
were identified and quantified (Table IV). The chromatographic method used to identify the TPC
was eff ective, as it showed a high selectivity and resolution for the majority of signals analyzed.
Samples showed a complex chemical composition with multiple signals mainly eluting with retention times of between 20 and 30 minutes, which indicates compounds with chemical structures of medium polarity (Figure 3). The phenolic acids caffeic, p-coumaric and ferulic were identifi ed in the most extracts and from the identifi ed compounds, which showed the highest levels. These results correlate with those obtained by Oldoni et al. (2015).
It is important to note the similarity of chemical profi les that samples produced in 2013 and 2015 showed, indicating that the botanical origin of the material analyzed is the same. The main diff erence between the propolis extracts was the content of phenolic acids identifi ed in extracts (Table IV and Figure 3). The extracts D1, D2 and D3, produced in 2015 showed a higher content of phenolic acids caffeic, ferulic and p-coumaric. The D3 extract showed the highest levels of p-coumaric acid (617.69 µg g-1) and ferulic acid (305.56 µg g-1) and
sample D1 showed higher content of caff eic acid (150.84 µg g-1) indicating a positive correlation of these compounds with antioxidant activities determined by radical scavenger methods DPPH and ABTS (Table II).
TABLE IV
Content of phenolic acids present in the extracts of propolis determined by HPLC-DAD. Samples Caff eic acid (µg g
-¹) p-coumaric acid (µg g
-¹)
Ferulic acid (µg g -¹)
A1 126.7 n.d. 85.76
A2 121.0 n.d. 101.1
A3 124.3 n.d. 84.48
A4 128.3 53.55 64.58
B1 n.d. 43.22 51.32
B2 124.3 29.21 n.d.
B3 n.d. 38.55 62.37
B4 127.6 n.d. 56.85
C1 127.5 379.5 67.93
C2 124.3 47.89 n.d.
C3 117.7 57.23 44.25
C4 n.d. 66.6 45.79
D1 150.8 n.d. 211.6
D2 n.d. 206.7 145.3
D3 137.6 617.7 305.6
n.d.: not detected.
In 2013 and 2015 changes were observed in average temperatures of 1 to 3 °C for the minimum and maximum respectively. This variation may have had an impact on bee activity, as well as the daily supplementation provided in 2015. In addition, the temperature can influence the production of secondary metabolites in plants as a function of environmental variables, such as attack by microorganisms, temperature and UV radiation. Resins, flower buds and resinous exudates are sources of material for the production of propolis and a variation in the chemical composition of these materials means changes in the composition of propolis.
De Figueiredo et al. (2015) evaluated the chemical composition of propolis produced in Minas Gerais, Brazil by RP-HPLC and identified
p-coumaric acid Li et al. (2016) obtained caffeic
and ferulic acids in large quantities by HPLC in aqueous extract of propolis from China.
CONCLUSIONS
The PCA results provided two clusters for propolis produced in 2013 and it was possible to separate samples produced in warmer months from those produced in colder months. Among the samples collected in March of 2013 and 2015, it was possible to verify more bioactivity in those collected in 2015 from colonies that received food supplementation.
In addition, a positive correlation was verified between the TPC and the antioxidant activity through the DPPH and ABTS radical scavenging. The chromatographic analysis showed a similar chemical profile for propolis produced in different months and years, with identification of phenolic acids p-coumaric, caffeic and ferulic.
ACKNOWLEDGMENTS
The authors acknowledge fellowship from Conselho Nacional de Desenvolvimento Científico e Tecnológico – (CNPq) and Central de Análises
da Universidade Tecnológica Federal do Paraná (UTFPR).
REFERENCES
BENZIE IF AND STRAIN JJ. 1996. The ferric reducing ability of plasma (FRAP) as a measure of “antioxidant power”: the FRAP assay. Anal Biochem 239: 70-76. BRAND-WILLIAMS W, CUVELIER ME AND BERSET C.
1995. Use of a free radical method to evaluate antioxidant activity. LWT - Food Sci Technol 28: 25-30.
BURATTI S, BENEDETTI S AND COSIO MS. 2007. Evaluation of the antioxidant power of honey, propolis and royal jelly by amperometric flow injection analysis. Talanta 71: 1387-1392.
COTTICA SM, SABIK H, ANTOINE C, FORTIN J, GRAVELINE N, VISENTAINER JV AND BRITTEN M. 2015. Characterization of Canadian propolis fractions obtained from two-step sequential extraction. LWT - Food Sci Technol 60: 609-614.
COTTICA SM, SAWAyA ACHF, EBERLIN MN, FRANCO SL, ZEOULA LM AND VISENTAINER JV. 2011. An-tioxidant Activity and Composition of Propolis Obtained by Different Methods of Extraction. J Braz Chem Soc 22: 929-935.
DANESHMAND A, SADEGHI GH, KARIMI A, VAZIRy A AND IBRAHIM SA. 2015. Evaluating complementary effects of ethanol extract of propolis with the probiotic on growth performance, immune response and serum metabo-lites in male broiler chickens. Livest Sci 178: 195-201. DA SILVA RO, ANDRADE VM, RÊGO ESB, DÓRIA GAA,
LIMA BS, DA-SILVA FA, ARAÚJO AAS, JÚNIOR RLCA, CARDOSO JC AND GOMES MZ. 2015. Acute and sub-acute oral toxicity of Brazilian red propolis in rats. J Ethnopharmacol 170: 66-71.
DE FIGUEIREDO SM ET AL. 2015. Green Propolis: Thir-teen Constituents of Polar Extract and Total Flavonoids Evaluated During Six years through RP-HPLC. Curr Drug Discov Technol 12: 229-239.
DE-MELO AAM, MATSUDA AH, FREITAS ADSD, BARTH OM AND ALMEIDA-MURADIAN LBD. 2014. Capacidade antioxidante da própolis. Pes Agrop Trop 44: 341-348.
FALCÃO SI, TOMÁS A, VALE N, GOMES P, FREIRE C AND VILAS-BOAS M. 2013. Phenolic quantification and botanical origin of Portuguese propolis. Ind Crops Prod 49: 805-812.
GONG S, LUO L, GONG W, GAO y AND xIE M. 2012. Multivariate analyses of element concentrations revealed the groupings of propolis from different regions in China. Food Chem 134: 583-588.
activity of lyophilized aqueous extract of propolis from Erzurum, Turkey. Food Chem Toxicol 48: 2227-2238. JIANG JA, WANG CH, CHEN CH, LIAO MS, SU yL,
CHEN WS, HUANG CP, yANG EC AND CHUANG CL. 2016. A WSN-based automatic monitoring system for the foraging behavior of honey bees and environmental factors of beehives. Comput Electron Agric 123: 304-318. JURD L AND GEISSMAN TA. 1956. Absorption Spectra of
Metal Complexes of Flavonoid Compounds. J Org Chem 21: 1395-1401.
KALOGEROPOULOS N, KONTELES SJ, TROULLIDOU E, MOURTZINOS I AND KARATHANOS VT. 2009. Chemical composition, antioxidant activity and antimicrobial properties of propolis extracts from Greece and Cyprus. Food Chem 116: 452-461.
KUMAZAWA S, HAMASAKA T AND NAKAyAMA T. 2004. Antioxidant activity of propolis of various geographic origins. Food Chem 84: 329-339.
LI A, xUAN H, SUN A, LIU R AND CUI J. 2016. Preparative separation of polyphenols from water-soluble fraction of Chinese propolis using macroporous absorptive resin coupled with preparative high performance liquid chromatography. J Chromatogr B Anal Technol Biomed Life Sci 1012-1013: 42-49.
LÓPEZ BGC, SCHMIDT EM, EBERLIN MN AND SAWAyA ACHF. 2014. Phytochemical markers of different types of red propolis. Food Chem 146: 174-180.
LUIS-VILLAROyA A, ESPINA L, GARCÍA-GONZALO D, BAyARRI S, PÉREZ C AND PAGÁN R. 2015. Bioactive properties of a propolis-based dietary supplement and its use in combination with mild heat for apple juice preservation. Int J Food Microbiol 205: 90-97.
MAHMOUD UT, ABDEL-RAHMAN MAM, DARWISH MHA, APPLEGATE TJ AND CHENG HW. 2015. Behavioral changes and feathering score in heat stressed broiler chickens fed diets containing different levels of propolis. Appl Anim Behav Sci 166: 98-105.
MALERBO-SOUZA DT AND SILVA FAS. 2011. Comportamento forrageiro da abelha Africanizada Apis mellifera L. no decorrer do ano. Acta Sci Anim Sci 33: 183-190.
MATOS VR, ALENCAR SM AND SANTOS FAR. 2014. Pollen types and levels of total phenolic compounds in propolis produced by Apis mellifera L. (Apidae) in an area of the Semiarid Region of Bahia, Brazil. An Acad Bras Cienc 86: 407-418.
MCCALL C AND PRIMACK RB. 1992. Influence of Flower Characteristics, Weather, Time of Day, and Season on Insect Visitation Rates in Three Plant Communities. Am J Bot 79: 434.
MIGUEL MG, NUNES S, DANDLEN SA, CAVACO AM AND ANTUNES MD. 2010. Phenols and antioxidant activity of hydro-alcoholic extracts of propolis from
Algarve, South of Portugal. Food Chem Toxicol 48: 3418-3423.
MIHAI CM, MARGHITAS LA, DEZMIREAN DS AND BARNUTIU L. 2011. Correlation between Polyphenolic Profile and Antioxidant Activity of Propolis from Transylvania. Anim Sci Biotechnol 44: 100-103.
MOHAMMADZADEH S, SHARRIATPANAHI M, HAMEDI M, AMANZADEH y, EBRAHIMI SES AND OSTAD SN. 2007. Antioxidant power of Iranian propolis extract. Food Chem 103: 729-733.
MORLOCK GE, RISTIVOJEVIC P AND CHERNETSOVA ES. 2014. Combined multivariate data analysis of high-performance thin-layer chromatography fingerprints and direct analysis in real time mass spectra for profiling of natural products like propolis. J Chromatogr A 1328: 104-112.
OLDONI TLC, CABRAL ISR, D’ARCE MABR, ROSALEN PL, IKEGAKI M, NASCIMENTO AM AND ALENCAR SM. 2011. Isolation and analysis of bioactive isoflavonoids and chalcone from a new type of Brazilian propolis. Sep Purif Technol 77: 208-213.
OLDONI TLC, OLIVEIRA SC, ANDOLFATTO S, KARLING M, CALEGARI MA, SADO Ry, MAIA FMC, ALENCAR SM AND LIMA VA. 2015. Chemical Characterization and Optimization of the Extraction Process of Bioactive Compounds from Propolis Produced by Selected Bees. J Braz Chem Soc 26: 2054-2062.
RANĐELOVIC SS, KOSTIC DA, ARSIC BB, MITIC SS, RASIC ID, MITIC MN, DIMITRIJEVIC DS AND STOJANOVIC GS. 2015. Chemometric Analysis of Grapes. Open Chem 13: 675-682.
RE R, PELLEGRINI N, PROTEGGENTE A, PANNALA A, yANG M AND RICE-EVANS C. 1999. Antioxidant activity applying an improved ABTS radical cation decolorization assay. Free Radic. Biol Med 26: 1231-1237. SINGLETON VL, ORTHOFER R AND LAMUELA-RAVENTÓS RM. 1998. Analysis of total phenols and other oxidation substrates and antioxidants by means of folin-ciocalteu reagent. Methods Enzymol 299: 152-178. VALENZUELA-BARRA G, CASTRO C, FIGUEROA
C, BARRIGA A, SILVA x, DE LAS HERAS B, HORTELANO S AND DELPORTE C. 2015. Anti-inflammatory activity and phenolic profile of propolis from two locations in Región Metropolitana de Santiago, Chile. J Ethnopharmacol 168: 37-44.
WANG K, ZHANG J, PING S, MA Q, CHEN x, xUAN H, SHI J, ZHANG C AND HU F. 2014. Anti-inflammatory effects of ethanol extracts of Chinese propolis and buds from popular (Populus×canadensis). J Ethnopharmacol 155: 300-311.