Adriane Molardi Bainy(1), Rodrigo Pelicioni Savegnago(1), Luara Afonso de Freitas(1), Beatriz do Nascimento Nunes(1), Jaqueline Oliveira Rosa(1), Mônica Corrêa Ledur(2) and Danísio Prado Munari(1)
(1)Universidade Estadual Paulista Júlio de Mesquita Filho, Faculdade de Ciências Agrárias e Veterinárias, Departamento de Ciências Exatas, Via de Acesso Prof. Paulo Donato Castellane, s/no, CEP 14884-900 Jaboticabal, SP, Brazil. E-mail: [email protected], [email protected], [email protected], [email protected], [email protected], [email protected] (2)Embrapa Suínos e Aves, Rodovia BR-153, Km 110, Distrito de Tamanduá, Caixa Postal 321, CEP 89715-899 Concórdia, SC, Brazil. E-mail: [email protected]
Abstract – The objective of this work was to estimate genetic parameters for bird carcass and meat quality traits, as well as to explore the genetic patterns of the breeding values of this population using cluster analyses. Data from 1,846 birds were used to estimate the genetic parameters of production and quality traits using the multiple-trait animal model, and cluster analyses were performed. The heritability estimates ranged from 0.08±0.03 for meat pH measured 24 hours after slaughter to 0.85±0.09 for body weight. The genetic correlations between production traits were high and positive. The genetic correlations between meat quality traits were low and were not informative due to the high standard errors (same magnitudes as those of the genetic correlations). The genetic correlations between meat production and quality traits were negative, except between production traits and meat lightness intensity. Based on breeding values (EBVs), the evaluated population can be divided into four groups through cluster analyses, and one group is suitable for selection because the birds presented EBVs above and around the average of the population, respectively, for production and quality traits. Therefore, it is possible to obtain genetic gains for production-related traits without decreasing meat quality.
Index terms: genetic correlation, heritability, meat color, White Leghorn.
Estimativa de parâmetros genéticos e análises de agrupamento
para características de carcaça e qualidade da carne em aves
Resumo – O objetivo deste trabalho foi estimar os parâmetros genéticos para características de carcaça e
qualidade da carne de aves, bem como explorar o perfil dos valores genéticos desta população, com uso de
análises de agrupamento. Foram utilizados dados de 1.846 aves para estimar os parâmetros genéticos de
características de produção e qualidade por meio do modelo animal multicaracterística, e foram realizadas
análises de agrupamento. As estimativas de herdabilidade variaram de 0,08±0,03 para o pH da carne medido 24 horas após o abate a 0,85±0,09 para o peso corporal. As correlações genéticas entre as características
de produção foram altas e positivas. Já as correlações genéticas entre as características de qualidade da carne foram baixas e não foram informativas devido aos altos erros-padrão (mesmas magnitudes que as das correlações genéticas). As correlações genéticas entre as características de produção e de qualidade da carne foram negativas, exceto entre as características de produção e o teor de luminosidade da carne. Com base nos valores genéticos (VGs), a população avaliada pode ser dividida em quatro grupos por meio da análise de agrupamento, e um dos grupos é mais adequado para seleção, uma vez que as aves apresentaram VGs acima e em torno da média da população, respectivamente, para as características de produção e de qualidade da carne. Assim, é possível obter ganhos genéticos para características relacionadas à produção sem diminuir a
qualidade da carne.
Termos para indexação: correlação genética, herdabilidade, cor da carne, White Leghorn.
Introduction
The emphasis of selection in increasing broiler body weight has led to undesirable results regarding muscle structure, metabolism, and meat quality. Pale, soft, and
exudative (PSE) meat (Dransfield & Sosnicki, 1999)
meat pH and associated heat dissipation problems, resulting in pale, extremely soft, and exudative meat. Because of these traits, PSE meat is not well accepted by consumers, which consequently leads to economic losses. It should be noted, however, that the nutritional value of PSE meat is not altered and does not cause any damage or pose any threat to human health (Komiyama et al., 2009).
Several studies have shown that the final quality
of poultry breast meat is affected by pre-slaughter handling and transportation of birds, changes in metabolic parameters due to environmental temperature, and post-slaughter effects (Debut et al., 2003; Simões et al., 2009). Pre-slaughter stress, for example, can alter the amount of muscle glycogen, which is the most important energy reserve, affecting the rate and range of pH decrease in the muscles, when
measured 15 min after slaughter, and also the final pH
measured 24 hours postmortem (Berri et al., 2007). The decline in the pH of meat after slaughter is the main factor that affects all quality attributes, including color and water retention. According to Lara et al. (2002), PSE meat in birds can be detected through a combination of pH (below 5.8) and meat lightness (above 52) values, measured 24 hours after slaughter.
Populations from crossings of different bird lines are important for studying genetic variability. When included in selection indexes, the estimates of genetic parameters for traits related to PSE meat in broilers can assist in obtaining products with higher sensory
quality and profitability.
Besides these estimates, another tool used for data analysis is the multivariate cluster analysis, which can help to achieve the selection goals of a breeding
program. Cluster analyses can also aid in exploring
the genetic pattern of the individual most suitable for selection. The main goal of this type of analysis is grouping individuals based on a set of variables, so as to maximize the homogeneity within groups and the heterogeneity between them (Hair et al., 2009). Savegnago et al. (2011) used this technique to group birds according to their weekly egg production during
54 weeks of the first egg cycle, revealing subgroups
of birds even though they were formed from the same base population.
The objective of this work was to estimate genetic parameters for bird carcass and meat quality traits, as well as to explore the genetic patterns of the breeding values of this population using cluster analyses.
Materials and Methods
Records of 1,846 third-generation (F3) birds from
crosses of a male broiler line (TT) with a hen line (CC)
were used in the present study, considering that crossing parents from different lines is an important resource to determine the genetic markers for economic traits in poultry. This population was previously described by Nunes et al. (2011) and Savegnago et al. (2011).
The birds were slaughtered between 41 and 44 days of age, in alignment with commercial conditions. After this process, carcass and meat quality traits were measured.
According to Simões et al. (2009) and Langer et al. (2010), the distance during the transportation of the
birds interferes in the final quality of the meat, since
fewer occurrences of PSE meat were observed after
shorter distances. Considering this, in the present
study, two different groups of animals were established randomly: control group, in which the journey of the birds from the sheds to the slaughterhouse took around 10 min along roads in excellent conditions; and group subjected to pre-slaughter stress, in which the journey of the birds from the sheds to the slaughterhouse took around 30 min along roads in poor conditions. Pre-slaughter fasting was about 7 hours for both groups; however, the birds in the latter group were exposed
to a temperature of around 40°C for 1 hour before
slaughtering. The differentiated handling aimed to induce stress among the birds and increase the variability of their physiological responses (Lara et al., 2003).
Body weight (BW) was measured at slaughtering, i.e., 41 to 44 days of age, in kilograms. The following traits related to the carcass were measured in grams: wing weight, drumstick weight, thigh weight, weight of the deboned pectoralis major muscle, breastbone weight, back weight, and abdominal fat (AF).
Meat pH was measured 15 min (pH15m) and 24 hours (pH24h) after slaughter. Two devices were used to measure pH15m. The pH measurements were performed using the Sentron 1001 potentiometer (Sentron, Gig Harbor, Washington, USA). Three measurements were made in different areas of the pectoralis major muscle after slaughter, and the mean was considered the pH24h value. Meat lightness, redness, and yellowness intensities were measured on deboned breast tissue samples that had been kept
Sensing Americas, Inc., Ramsey, NJ, USA). Bird meat was classified according to lightness, as: pale, when
lightness >53; dark, when lightness <44; or normal,
when 44≤ lightness ≤53 (Qiao et al., 2001). Three
measurements of lightness, redness, and yellowness intensities were performed 24 hours after slaughter, and the means of each color and lightness measurement were used in the statistical analysis.
The fixed effects included in the multiple-trait model for the genetic analysis were defined based on
the least-squares method using the GLM procedure of
the SAS software (SAS Institute Inc., Cary, NC, USA). The fixed effects of gender, pre-slaughter stress, and hatch (four hatches) of birds were significant (p<0.05)
for BW, wing weight, drumstick weight, thigh weight, breast weight, back weight, AF, pH15m, lightness, and redness. For the traits breastbone weight, pH24h,
and yellowness, only the fixed effects of gender and incubation were significant (p<0.05). For pH15m, the fixed effect of the pH meter (p<0.05) was also taken
into account. Since the birds were slaughtered between 41 and 44 days of age, the linear and quadratic effects
of the covariate age at slaughtering were significant
(p<0.05) for all the traits, except for thigh weight and AF. The Kolmogorov-Smirnov test was carried out to check if the traits were well modeled by normal distribution. All traits met the normality assumption (p<0.05), except redness intensity, which was subjected to square root transformation in order to attempt meeting the normality and homoscedasticity assumptions of the model.
The pedigree matrix, considering the base population, included 2,085 birds. The (co)variance components and the genetic parameters were estimated using restricted maximum likelihood (REML) procedures, in a multiple-trait animal model, implemented in the Wombat software (Meyer, 2007). The convergence criterion for the AIREML algorithm was set at 10-6.
The multiple-trait animal model included: the fixed
effect of each group; the linear and quadratic effects of the covariate age at slaughtering, except for thigh weight and AF; and the random additive genetic and residual effects. The general formula of the mixed model was: yi = Xiβi + Ziui + εi, in which yi is the vector
of the ith trait; β
i, ui, and εi are the vectors for the ith
trait with the solutions for the fixed, additive genetic,
and residual effects, respectively; and Xi and Zi are the
incidence matrixes for βi and ui, respectively.
The assumptions of the general model were as follows:
E y X E u
e Var
Gu A
[ ]= ; ; = ⊗ β 0
0
0
0 R⊗I ;
in which Gu is the 13×13 (co)variance matrix of the
direct additive genetic effects; R is the 13×13 (co) variance matrix of the residual effects; A is the numerator relationship matrix; I is the identity matrix whose order is equal to the number of individuals with observations; and ⊗ is the Kronecker operator.
Cluster analyses were used in order to group the
birds based on the breeding values (EBV) for meat production and quality traits.
Hierarchical and nonhierarchical cluster analyses,
respectively, were used to find the number of
subgroups that the population could be divided into and to verify the genetic pattern of each subgroup. With the hierarchical cluster analysis, this was done based on the breeding values of the 13 traits evaluated. In this analysis, the dissimilarity measurement was the Euclidian distance, according to which the shorter the distance between two individuals is, the greater the similarity between them will be. Ward’s clustering algorithm was used to form the groups, and the number of groups was chosen by the graphical analysis of the dendrogram resulting from this analysis. After that, the nonhierarchical cluster analysis, using the k-means method, was performed in order to explore the genetic pattern of the EBVs for the 13 bird traits in each cluster, which was done by checking the mean of the breeding values for each trait in each subgroup.
In order to perform all cluster analyses, the breeding values of the birds for the studied traits were standardized by the standard normal curve, as part of the procedure required for hierarchical and
nonhierarchical cluster analyses. Cluster analyses
were performed using the Statistica software, version 8.0 (Statistica, Tulsa, OK, USA).
Results and Discussion
In the present study, the means for pH15m and pH24h (Table 1) were similar to those of 6.45±0.13 and 5.64±0.12, respectively, reported by Le Bihan-Duval et al. (2008) for a pure line of broiler birds, whereas the means for lightness, redness, and yellowness were close to those of 56.07±3.00, 5.35±1.10, and
(2008) for an elite flock that had undergone selection for the development of a sire line. Bressan & Beraquet
(2002) observed similar averages of 6.03 and 5.79 for pH15m and pH24h, respectively. Approximately 12% of the animals assessed in the present study showed indications of PSE meat, considering pH15m values below 5.8 and lightness values above 52.
The heritability estimates for BW, breast weight, drumstick weight, thigh weight, and wing weight were very high (Table 2), ranging from 0.74±0.09 to 0.85±0.09, which indicates that a large part of the variation of these traits can be attributed to the additive effect of the genes. It is possible that these heritability estimates were higher than the traditional values reported in the literature due to the increased additive genetic variancebecause of the cross between a broiler and a layer line.
Genetic selection can be an effective way to make genetic progress in these traits. However, the genetic correlations between production and meat quality traits should also be considered, which ranged from -0.79±0.08 for breast weight and redness to 0.48±0.16 for BW and yellowness (Table 2). The heritability estimate for AF (0.80±0.08) was also high, indicating
that this trait can respond very well to selection.
Chen et al. (2008) worked with Beijing-You birds
and obtained a heritability estimate of 0.62, close to
those reported in the present study, whereas Lotfi et
al. (2011), while studying quails, found heritability estimates of 0.28±0.06 for AF, different from those obtained here.
In the present study, the heritability estimates for pH15m and pH24h were of 0.12±0.04 and 0.08±0.03, respectively, lower than those reported by Le Bihan-Duval et al. (2008), which ranged from 0.30±0.05 to 0.49±0.01 and from 0.16±0.06 to 0.34±0.06. The heritability estimate for pH24h was the lowest among the evaluated traits, which indicated that nearly all the phenotypic variation was due to the nonadditive genetic effects and/or environment effects. Therefore,
selection based on pH15m and pH24h was not efficient
to obtain genetic gains. The same explanation was valid for lightness, redness, and yellowness, since the obtained heritability estimates for these traits ranged from 0.12±0.04 to 0.22±0.05. Those authors found heritability estimates of 0.35±0.05 for lightness, 0.25±0.05 for the color red, and 0.31±0.06 for the color yellow in bird meat. Gaya et al. (2011) reported heritability estimates of 0.29±0.04 for lightness, 0.24±0.03 for redness, and 0.12±0.03 for yellowness.
In general, BW, the weights of the carcass parts, and AF showed high and positive genetic correlations, indicating favorable indirect genetic gains if selection is applied to one of these traits. The genetic correlations of the production traits BW, wing weight, drumstick weight, thigh weight, breast weight, breastbone weight, back weight, and AF with pH15m and pH24h ranged from -0.43±0.20 to -0.08±0.19 (Table 2). Some of those estimates had high standard errors, with almost the same magnitude as that of the genetic correlation estimates, which indicates that they were not reliable. Moreover, the pH would only have small genetic gains, due to the low heritability observed. Gaya et al. (2011) found low estimates for the genetic correlation of pH measurements with BW and breast yield, ranging from -0.13±0.12 to 0.07±0.30.
Lightness presented positive and moderate genetic correlations with BW and the weights of the carcass parts, except with breast and AF due to the high standard errors, which indicated that selection for the weight of the bird parts and BW should increase meat lightness. However, it is important to point out that
Table 1. Number of records (n), mean ( X ), standard
deviation (SD), coefficient of variation (CV), and minimum
(Min.) and maximum (Max.) values of the evaluated traits in a line of F3 birds.
Trait (unit)(1) n
X SD CV (%) Min. Max.
BW (kg) 1,510 0.99 0.16 16.81 0.43 1.55 Wing (g) 1,401 81.44 13.14 16.13 38.00 130.00 Breast (g) 1,403 110.70 22.66 20.47 34.00 187.00 Breastbone (g) 1,351 50.05 9.20 18.38 24.00 81.00 Drumstick (g) 1,403 88.66 17.08 19.26 39.00 149.00 Thigh (g) 1,402 135.17 26.31 19.47 54.00 222.00 Back (g) 1,403 186.71 34.21 18.32 78.00 304.00 AF (g) 1,400 15.42 6.53 42.33 1.00 37.00 pH15m 1,383 6.01 0.20 3.35 5.60 6.60 pH24h 1,369 5.62 0.14 2.50 5.13 6.07 Lightness 1,507 51.93 2.83 5.45 43.20 61.80 Redness 1,507 5.42 1.42 26.18 1.70 11.50
Yellowness 1,459 13.55 1.71 12.62 8.60 19.40
(1)BW, body weight of the birds at slaughtering age; Wing, wing weight;
Breast, deboned breast weight; Breastbone, breastbone weight; Drumsti-ck, drumstick weight; Thigh, thigh weight; BaDrumsti-ck, back weight; AF, abdo-minal fat weight; pH15m, pH 15 min postmortem; pH24h, pH 24 hours postmortem; Lightness, lightness intensity; Redness, redness intensity;
the heritability estimates for meat color, lightness, and pH were low. Therefore, substantial changes in these traits depend more on bird handling before and after slaughter than on genetic changes.
Redness and yellowness presented negative genetic correlations with BW and the weights of the carcass parts, ranging from -0.79±0.08 to 0.43±0.17, indicating that selection for BW or the weight of the bird parts would reduce the yellowness and redness of the meat. According to Le Bihan-Duval et al. (2001), selection for muscle development in broiler birds could alter meat color due to reductions in the redness and yellowness measurements, which is not desirable.
Color is one of the most important factors in the
consumer’s perception of meat quality, since it affects both the initial choice of the product by the consumer, as well as the acceptance at the time of consumption (Fletcher, 2002).
The genetic correlations between pH15m, lightness, redness, and yellowness were low; however, the standard errors of these estimates almost had the same magnitude as that of the genetic correlation estimates, indicating that the genetic associations were unreliable. The genetic correlation between pH24h and lightness was high and negative (-0.67±0.18), showing that the quality of the meat also depends on the conditions after slaughter. To keep the lightness unchangeable, it is important to maintain the pH conditions even after slaughter.
The genetic correlations of pH24h with redness
and yellowness were not significant due to the high
standard errors of these estimates, similarly to the genetic associations between meat lightness and color measurements. Different results were reported by Gaya et al. (2011), according to which pH24h presented negative genetic correlations with redness, yellowness, and lightness intensities (-0.38±0.13, -0.25±0.06, and -0.41±0.11, respectively). The same authors observed genetic correlation of -0.32±0.12 between lightness and redness, and of 0.34±0.15 between lightness and yellowness, highlighting that pale meat presents lower redness intensity, but higher yellowness.
The estimates of the environmental and phenotypic correlations between BW and the weights of the carcass parts ranged from 0.62±0.10 to 0.92±0.03 (Table 2) and from 0.87±0.01 to 0.95±0.01, respectively (Table 3). These results suggest that these traits presented direct responses to environmental changes, with directly associated phenotypic performances.
The estimates of the environmental and phenotypic correlations between AF, BW, and the weights of the carcass parts were positive, indicating directly proportional environmental and phenotypic associations. The environmental and phenotypic correlation estimates between the evaluated meat quality traits and BW, the weights of the bird parts, and AF were low (some close to zero or negative), showing that there were little or no environmental
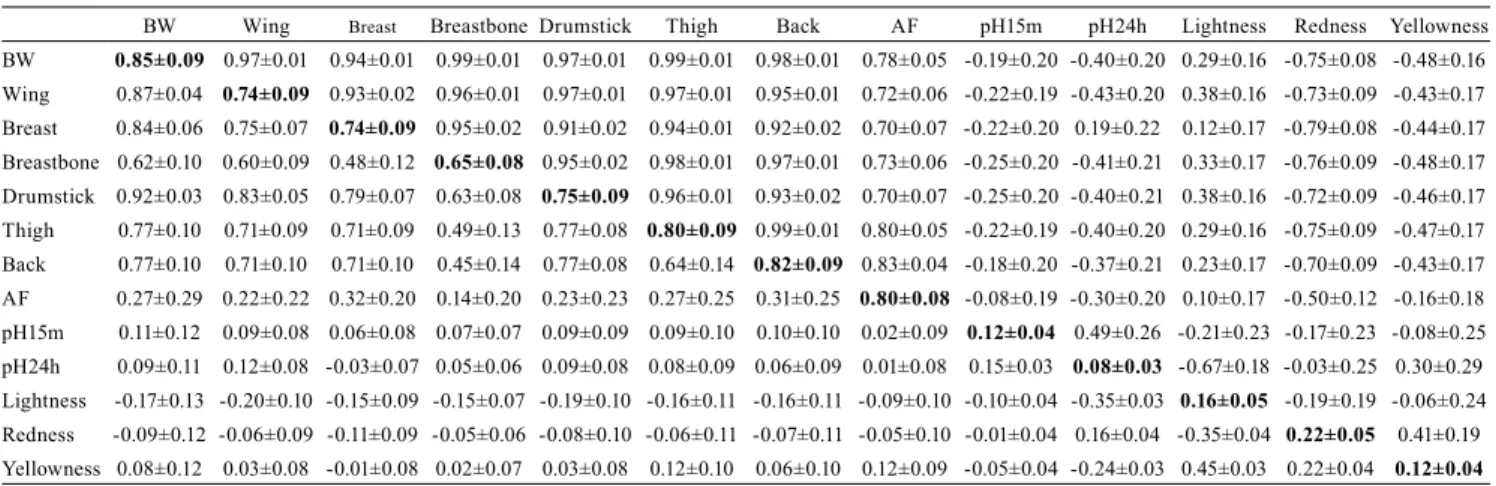
Table 2. Heritability estimates (diagonal), genetic correlations (above the diagonal), and environmental correlations (below
the diagonal) between the carcass and meat quality traits evaluated in a line of F3 birds(1).
BW Wing Breast Breastbone Drumstick Thigh Back AF pH15m pH24h Lightness Redness Yellowness
BW 0.85±0.09 0.97±0.01 0.94±0.01 0.99±0.01 0.97±0.01 0.99±0.01 0.98±0.01 0.78±0.05 -0.19±0.20 -0.40±0.20 0.29±0.16 -0.75±0.08 -0.48±0.16
Wing 0.87±0.04 0.74±0.09 0.93±0.02 0.96±0.01 0.97±0.01 0.97±0.01 0.95±0.01 0.72±0.06 -0.22±0.19 -0.43±0.20 0.38±0.16 -0.73±0.09 -0.43±0.17
Breast 0.84±0.06 0.75±0.07 0.74±0.09 0.95±0.02 0.91±0.02 0.94±0.01 0.92±0.02 0.70±0.07 -0.22±0.20 0.19±0.22 0.12±0.17 -0.79±0.08 -0.44±0.17
Breastbone 0.62±0.10 0.60±0.09 0.48±0.12 0.65±0.08 0.95±0.02 0.98±0.01 0.97±0.01 0.73±0.06 -0.25±0.20 -0.41±0.21 0.33±0.17 -0.76±0.09 -0.48±0.17
Drumstick 0.92±0.03 0.83±0.05 0.79±0.07 0.63±0.08 0.75±0.09 0.96±0.01 0.93±0.02 0.70±0.07 -0.25±0.20 -0.40±0.21 0.38±0.16 -0.72±0.09 -0.46±0.17
Thigh 0.77±0.10 0.71±0.09 0.71±0.09 0.49±0.13 0.77±0.08 0.80±0.09 0.99±0.01 0.80±0.05 -0.22±0.19 -0.40±0.20 0.29±0.16 -0.75±0.09 -0.47±0.17
Back 0.77±0.10 0.71±0.10 0.71±0.10 0.45±0.14 0.77±0.08 0.64±0.14 0.82±0.09 0.83±0.04 -0.18±0.20 -0.37±0.21 0.23±0.17 -0.70±0.09 -0.43±0.17
AF 0.27±0.29 0.22±0.22 0.32±0.20 0.14±0.20 0.23±0.23 0.27±0.25 0.31±0.25 0.80±0.08 -0.08±0.19 -0.30±0.20 0.10±0.17 -0.50±0.12 -0.16±0.18
pH15m 0.11±0.12 0.09±0.08 0.06±0.08 0.07±0.07 0.09±0.09 0.09±0.10 0.10±0.10 0.02±0.09 0.12±0.04 0.49±0.26 -0.21±0.23 -0.17±0.23 -0.08±0.25
pH24h 0.09±0.11 0.12±0.08 -0.03±0.07 0.05±0.06 0.09±0.08 0.08±0.09 0.06±0.09 0.01±0.08 0.15±0.03 0.08±0.03 -0.67±0.18 -0.03±0.25 0.30±0.29
Lightness -0.17±0.13 -0.20±0.10 -0.15±0.09 -0.15±0.07 -0.19±0.10 -0.16±0.11 -0.16±0.11 -0.09±0.10 -0.10±0.04 -0.35±0.03 0.16±0.05 -0.19±0.19 -0.06±0.24
Redness -0.09±0.12 -0.06±0.09 -0.11±0.09 -0.05±0.06 -0.08±0.10 -0.06±0.11 -0.07±0.11 -0.05±0.10 -0.01±0.04 0.16±0.04 -0.35±0.04 0.22±0.05 0.41±0.19
Yellowness 0.08±0.12 0.03±0.08 -0.01±0.08 0.02±0.07 0.03±0.08 0.12±0.10 0.06±0.10 0.12±0.09 -0.05±0.04 -0.24±0.03 0.45±0.03 0.22±0.04 0.12±0.04
(1)BW, body weight of the birds at slaughtering age; Wing, wing weight; Breast, deboned breast weight; Breastbone, breastbone weight; Drumstick,
dru-mstick weight; Thigh, thigh weight; Back, back weight; AF, abdominal fat weight; pH15m, pH 15 min postmortem; pH24h, pH 24 hours postmortem;
and phenotypic associations between meat quality and production traits.
The studied population could be divided genetically into four groups (Figure 1) by the hierarchical cluster analysis, based on the Euclidian distance between
the breeding values for the 13 traits assessed in the birds. Although several criteria for choosing the ideal number of clusters have been described in
the literature (Charrad et al., 2014), according to Johnson & Wichern (2007), Hair et al. (2009), and
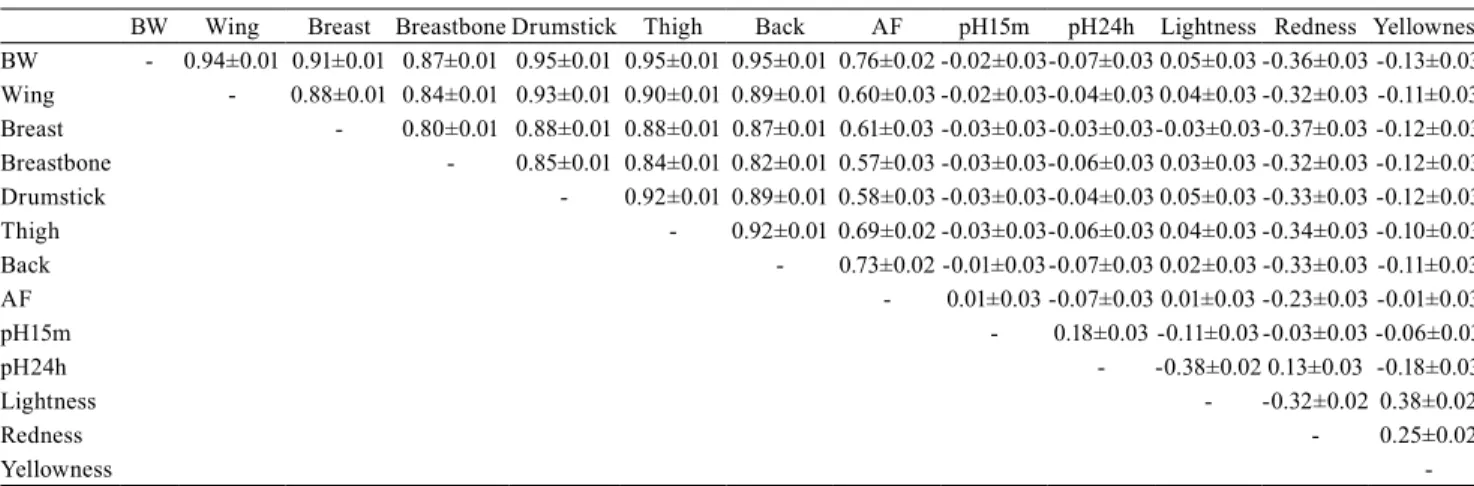
Table 3. Phenotypic correlations between the carcass and meat quality traits evaluated in a line of F3 birds(1).
BW Wing Breast Breastbone Drumstick Thigh Back AF pH15m pH24h Lightness Redness Yellowness BW - 0.94±0.01 0.91±0.01 0.87±0.01 0.95±0.01 0.95±0.01 0.95±0.01 0.76±0.02 -0.02±0.03-0.07±0.03 0.05±0.03 -0.36±0.03 -0.13±0.03 Wing - 0.88±0.01 0.84±0.01 0.93±0.01 0.90±0.01 0.89±0.01 0.60±0.03 -0.02±0.03-0.04±0.03 0.04±0.03 -0.32±0.03 -0.11±0.03 Breast - 0.80±0.01 0.88±0.01 0.88±0.01 0.87±0.01 0.61±0.03 -0.03±0.03-0.03±0.03-0.03±0.03-0.37±0.03 -0.12±0.03 Breastbone - 0.85±0.01 0.84±0.01 0.82±0.01 0.57±0.03 -0.03±0.03-0.06±0.03 0.03±0.03 -0.32±0.03 -0.12±0.03 Drumstick - 0.92±0.01 0.89±0.01 0.58±0.03 -0.03±0.03-0.04±0.03 0.05±0.03 -0.33±0.03 -0.12±0.03 Thigh - 0.92±0.01 0.69±0.02 -0.03±0.03-0.06±0.03 0.04±0.03 -0.34±0.03 -0.10±0.03 Back - 0.73±0.02 -0.01±0.03-0.07±0.03 0.02±0.03 -0.33±0.03 -0.11±0.03
AF - 0.01±0.03 -0.07±0.03 0.01±0.03 -0.23±0.03 -0.01±0.03
pH15m - 0.18±0.03 -0.11±0.03 -0.03±0.03 -0.06±0.03
pH24h - -0.38±0.02 0.13±0.03 -0.18±0.03
Lightness - -0.32±0.02 0.38±0.02
Redness - 0.25±0.02
Yellowness
-(1)BW, body weight of the birds at slaughtering age; Wing, wing weight; Breast, deboned breast weight; Breastbone, breastbone weight; Drumstick,
drumstick weight; Thigh, thigh weight; Back, back weight; AF, abdominal fat weight; pH15m, pH 15 min postmortem; pH24h, mean pH 24 hours
postmortem; Lightness, lightness intensity; Redness, redness intensity; and Yellowness, yellowness intensity.
Figure 1. Dendrogram for the birds based on the breeding values for the carcass and meat quality traits evaluated. The
Charrad et al. (2014), the choice of the number of
groups that the population could be divided into depends on the interpretability and utility of the results, i.e., on empirical results, even though several numerical criteria have been adopted for choosing
the ideal number of clusters (Charrad et al., 2014).
These authors suggest using up to six clusters, since
a number higher than that may make it difficult to
interpret the obtained results because of the greater
specificities that can be found in the dataset due to a
large number of clusters.
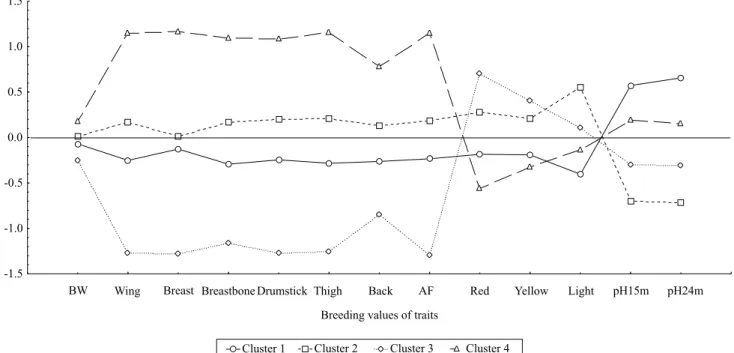
The genetic patterns of these groups were shown in Figure 2 using the nonhierarchical cluster analysis.
In this analysis, 638 birds were classified in cluster 1,
513 in cluster 2, 418 in cluster 3, and 516 in cluster 4, totaling 2,085 birds. The cluster analysis could help to select birds based on their genetic patterns, depending on the selection goals of the breeding program. The
cluster analysis could also give a graphical view of the best group of animals for certain traits of interest that would be selected to compose the next generation. The means of the breeding values for each trait were quite different between groups 3 and 4, and very close between groups 1 and 2 (Figure 2). The birds of group 4 presented EBVs for production and quality traits above and around the average of the population, respectively. Therefore, these birds would be suitable for selection, since it is possible to obtain genetic gains for production-related traits without decreasing meat quality. Although the birds in this group presented, on average, breeding values slightly lower than the average of the population for meat redness and yellowness, it should be taken into account that the heritability of these traits was low, indicating little effect of the additive genes.
Figure 2. Standardized means of the breeding values (EBVs) of the traits used to classify the evaluated birds into four
groups: cluster 1, with 638 birds; cluster 2, with 513; cluster 3, with 418; and cluster 4, with 516, totaling 2,085 birds, using the k-means method. EBVs of: BW, body weight of the birds at slaughtering age; wing, wing weight; breast, deboned breast weight; breastbone, breastbone weight; drumstick, drumstick weight; thigh, thigh weight; back, back weight; AF, abdominal fat weight; red, redness intensity; yellow, yellowness intensity; light, lightness intensity; pH15m, pH 15 min postmortem; and pH24h, mean pH 24 hours postmortem.
BW Wing Breast Breastbone Drumstick Thigh
Breeding values of traits -1.5
-1.0 -0.5 0.0 0.5 1.0 1.5
Standardized mean
Cluster 1 Cluster 2 Cluster 3 Cluster 4
Conclusions
1. The correlated response obtained when birds are selected based on body weight or the weights of the carcass parts can be used to increase meat lightness and decrease postmortem pH, yellowness, and redness, resulting in paler meat with the pale, soft, and exudative (PSE) phenotype.
2. The selection of birds based only on meat quality traits, including meat redness, yellowness, lightness, pH measured 15 min and 24 hours after slaughter,
is not efficient due to the low heritability estimates
obtained.
3. It is possible to obtain genetic gains for production-related traits without decreasing meat quality.
Acknowledgments
To Embrapa, for the data; and to Conselho Nacional de Desenvolvimento Científico e Tecnológico (CNPq), to Fundação de Amparo à Pesquisa do Estado de São Paulo (Fapesp), and to Coordenação de Aperfeiçoamento de Pessoal de Nível Superior (Capes), for financial support.
References
BERRI, C.; LE BIHAN-DUVAL, E.; DEBUT, M.; SANTÉ-LHOUTELLIER, V.; BAÉZA, E.; GIGAUD, V.; JÉGO, Y.; DUCLOS M.J. Consequence of muscle hypertrophy on pectoralis major characteristics and breast meat quality of broiler chickens. Journal of Animal Science, v.85, p.2005-2011, 2007. DOI: 10.2527/jas.2006-398.
BRESSAN, M.C.; BERAQUET, N.J. Efeito de fatores pré-abate sobre a qualidade da carne de peito de frango. Ciência e Agrotecnologia, v.26, p.1049-1059, 2002.
CHARRAD, M.; GHAZZALI, N.; BOITEAU, V.; NIKNAFS, A. NbClust: an R package for determining the relevant number of clusters in a data set. Journal of Statistical Software, v.61, p.1-36, 2014. DOI: 10.18637/jss.v061.i06.
CHEN, J.L.; ZHAO, G.P.; ZHENG, M.Q.; WEN, J.; YANG, N. Estimation of genetic parameters for contents of intramuscular fat and inosine-5’-monophosphate and carcass traits in Chinese Beijing-You Chickens. Poultry Science, v.87, p.1098-1104, 2008. DOI: 10.3382/ps.2007-00504.
DEBUT, M.; BERRI, C.; BAÉZA, E.; SELLIER, N.; ARNOULD, C.; GUÉMENÉ, D.; JEHL, N.; BOUTTEN, B.; JEGO, Y.; BEAUMONT, C.; LE BIHAN-DUVAL, E. Variation of chicken technological meat quality in relation to genotype and preslaughter stress conditions. Poultry Science, v.82, p.1829-1838, 2003. DOI: 10.1093/ps/82.12.1829.
DRANSFIELD, E.; SOSNICKI, A.A. Relationship between muscle growth and poultry meat quality. Poultry Science, v.78, p.743-746, 1999. DOI: 10.1093/ps/78.5.743.
FLETCHER, D.L. Poultry meat quality. World’s Poultry Science Journal, v.58, p.131-145, 2002. DOI: 10.1079/WPS20020013. GAYA, L. de G.; MOURÃO, G.B.; FERRAZ, J.B.S.; MATTOS, E.C.; COSTA, A.M.M.A. da; MICHELAN FILHO, T.; ROSA, A.F.; FELÍCIO, A.M.; ELER, J.P. Estimates of heritability and genetic correlations for meat quality traits in broilers. Scientia Agricola, v.68, p.620-625, 2011. DOI: 10.1590/S0103-90162011000600002. GAYA, L.G.; FERRAZ, J.B.S.; REZENDE, F.M.; MOURÃO, G.B.; MATTOS, E.C.; ELER, J.P.; MICHELAN FILHO, T. Heritability and genetic correlation estimates for performance and carcass and body composition traits in a male broiler line. Poultry Science, v.85, p.837-843, 2006. DOI: 10.1093/ps/85.5.837. HAIR, J.F.; BLACK, W.C.; BABIN, B.J.; ANDERSON R.E. Multivariate data analysis. 7th ed. New Jersey: Prentice Hall,
2009. 816p.
JOHNSON, R.A.; WICHERN, D.W. Applied multivariate
statistical analysis. 6th ed. Upper Saddle River: Pearson
Prentice-Hall International, 2007. 773p.
KOMIYAMA, C.M.; MENDES, A.A.; TAKAHASHI, S.E.; MOREIRA, J.; BORBA, H.B.A.; LEONEL, F.R.; ROÇA, R. de O.; ALMEIDA, I.C.L.P.; BALOG NETO, A. Características qualitativas de produtos elaborados com carne de frango pálida e normal. Food Science and Technology, v.29, p.38-45, 2009. DOI: 10.1590/S0101-20612009000100007.
LANGER, R.O. de S.; SIMÕES, G.S.; SOARES, A.L.; OBA, A.; ROSSA, A.; SHIMOKOMAKI, M.; IDA E.I. Broiler transportation conditions in a Brazilian commercial line and the occurrence of breast PSE (Pale, Soft, Exudative) meat and DFD-like (Dark, Firm, Dry) meat. Brazilian Archives of Biology and Technology, v.53, p.1161-1167, 2010. DOI: 10.1590/S1516-89132010000500021.
LARA, J.A.F.; NEPOMUCENO, A.L.; LEDUR, M.C.; IDA, E.I.; SHIMOKOMAKI, M. Carne PSE em frangos. Ocorrência de mutações no gene receptor da rianodina. Revista Brasileira de Ciência Avícola, v.5, p.112, 2003.
LOTFI, E.; ZEREHDARAN, S.; AHANI AZARI, M. Genetic evaluation of carcass composition and fat deposition in Japanese quail. Poultry Science, v.90, p.2202-2208, 2011. DOI: 10.3382/ ps.2011-01570.
MEYER, K. WOMBAT – a tool for mixed model analyses in quantitative genetics by restricted maximum likelihood (REML). Journal of Zhejiang University Science B, v.8, p.815-821, 2007. DOI: 10.1631/jzus.2007.B0815.
MOURÃO, G.B.; GAYA, L.G.; FERRAZ, J.B.S.; MATTOS, E.C.; COSTA, A.M.M.A.; MICHELAN FILHO, T.; CUNHA NETO, O.C.; FELÍCIO, A.M.; ELER, J.P. Genetic trend estimates of meat quality traits in a male broiler line. Genetics and Molecular Research, v.7, p.749-761, 2008. DOI: 10.4238/vol7-3GMR479.
NUNES, B. do N.; RAMOS, S.B.; SAVEGNAGO, R.P.; LEDUR, M.C.; NONES, K.; KLEIN, C.H.; MUNARI, D.P. Genetic parameters for body weight, carcass chemical composition and yield in a broiler-layer cross developed for QTL mapping.
Genetics and Molecular Biology, v.34, p.429-434, 2011. DOI: 10.1590/S1415-47572011005000019.
QIAO, M.; FLETCHER, D.L.; SMITH, D.P.; NORTHCUTT, J.K. The effect of broiler breast meat color on pH, moisture, water-holding capacity, and emulsification capacity. Poultry Science, v.80, p.676-680, 2001. DOI: 10.1093/ps/80.5.676.
SAVEGNAGO, R.P.; CAETANO, S.L.; RAMOS, S.B.; NASCIMENTO, G.B.; SCHMIDT, G.S.; LEDUR, M.C.; MUNARI, D.P. Estimates of genetic parameters, and cluster and principal components analyses of breeding values related to egg production traits in a White Leghorn population. Poultry Science, v.90, p.2174-2188, 2011. DOI: 10.3382/ps.2011-01474.
SIMÕES, G.S.; OBA, A.; MATSUO, T.; ROSSA, A.; SHIMOKOMAKI, M.; IDA, E.I. Vehicle thermal microclimate evaluation during Brazilian summer broiler transport and the occurrence of PSE (Pale, Soft, Exudative) meat. Brazilian Archives of Biology and Technology, v.52, p.195-204, 2009. Special number. DOI: 10.1590/S1516-89132009000700025.