Guilherme Wolff Bueno(1), Dominique Bureau(2), James Owen Skipper-Horton(2), Rodrigo Roubach(3), Flávia Tavares de Mattos(4) and Francisco Ernesto Moreno Bernal(5)
(1)Universidade Estadual Paulista (Unesp), Faculdade de Engenharia de Pesca, Centro de Aquicultura da Unesp (Caunesp), Avenida Nelson Brihi Badur, no 430, Sala 05, CEP 11900-000 Registro, SP, Brazil. E-mail: gwolff@reitoria.unesp.br (2)University of Guelph, Animal Biosciences Department, Guelph, ON, N1G 2W1, Canada. E-mail: dbureau@uoguelph.ca, jskipper@uoguelph.ca (3)Ministério da Ciência, Tecnologia, Inovações e Comunicações, Esplanada dos Ministérios, Bloco E, CEP 70067-900 Brasília, DF, Brazil. E-mail: rodrigo.roubach@mctic.gov.br (4)Embrapa Pesca e Aquicultura, Prolongamento da Avenida NS 10, Cruzamento com a Avenida LO 18, Sentido Norte, s/no, Loteamento Água Fria, CEP 77008-900 Palmas, TO, Brazil. E-mail: flavia.tavares@embrapa.br (5)Universidade de Brasília, Faculdade de Agronomia e Medicina Veterinária, Campus Darcy Ribeiro, ICC Sul, Asa Norte, CEP 70910-900 Brasília, DF, Brazil. E-mail: framobe@unb.br
Abstract – Flooded areas of reservoirs and artificial lakes have been increasingly used for fish production; however, the waste generated by aquaculture has become a concern for the sustainable development of this activity. One of the main strategies adopted by management and regulatory agencies is the use of hydrodynamic models that calculate the carrying or nutrient load capacity of a particular water body and the effect of fish farming. These models are precise in the development of optimal strategies for feeding and waste calculation. This review paper addresses this topic and describes the methodology developed for the analysis and simulation of the carrying capacity for fish production, based on the integration of the Fish‑PrFEQ nutritional bioenergetic model and the hydrodynamic model of Dillon & Rigler. This methodology allows evaluating the real contribution of aquaculture waste and assists in the planning and management of aquaculture in these aquatic environments, besides enabling and encouraging producers and the aquaculture industry to use fish food with better nutritional quality and lower environmental impact.
Index terms: hydrodynamic modeling, mass balance, nutritional bioenergetics, solid waste, sustainable aquaculture.
Modelagem matemática para gestão da capacidade de suporte
de empreendimentos aquícolas em lagos e reservatórios
Resumo – Áreas inundadas de reservatórios e lagos artificiais estão sendo cada vez mais utilizadas para a produção de peixes; contudo, os resíduos lançados pela aquicultura tornaram‑se uma preocupação para o desenvolvimento sustentável desta atividade. Uma das principais estratégias adotadas pelos órgãos gestores e fiscalizadores consiste no uso de modelos hidrodinâmicos que calculam a capacidade de suporte ou de carga de nutrientes de um determinado corpo hídrico e a influência dos cultivos de peixes. Esses modelos são precisos no desenvolvimento de estratégias ideais de alimentação e cálculo de resíduos. Este trabalho de revisão aborda esta temática e traz uma descrição da metodologia desenvolvida para análise e simulação da capacidade de suporte para produção de pescados, baseada na integração do modelo bioenergético nutricional “Fish‑PrFEQ” com o modelo hidrodinâmico de Dillon & Rigler. Esta metodologia permite avaliar a real contribuição de resíduos aquícolas e auxilia no planejamento e na gestão da aquicultura nestes ambientes aquáticos, além de possibilitar e incentivar que os produtores e a indústria aquícola utilizem rações de melhor qualidade nutricional e menor impacto ambiental.
Termos para indexação: modelagem hidrodinâmica, balanço de massa, bioenergética nutricional, resíduos sólidos, aquicultura sustentável.
Introduction
Aquaculture is considered a viable and cheap source of high‑quality protein, especially in developing countries, where there is a need to increase food
production, the expansion of this activity brings benefits to the regional economies, in the form of employment and income generation throughout the aquaculture production chain (Ross et al., 2011), and is an important alternative productive activity for populations affected by dams, for example (Béné et al., 2016).
In this scenario, according to Montanhini Neto & Ostrensky (2015), in order to produce a ton of tilapia, approximately 1,040 kg organic matter (OM), 45 kg N, and 14 kg P are released into the environment. Alves & Baccarin (2005) reported that 66% of the P obtained by intensive feeding in fish farms is absorbed by the sediment, 11% is dissolved in water, and 23% is incorporated by the farmed fish.
Therefore, the solid wastes generated by aquaculture become a concern for the sustainable development of the activity. Several researchers have shown that the residual products from different types of fish farming can be estimated by factorial mathematical models (Cho & Bureau, 1998; Lupatsch & Kissil, 1998; Yi, 1998; Bureau & Hua, 2010; Azevedo et al., 2011).
In this context, this paper presents a review of the topic and a description of the methodology developed to analyze and simulate the carrying capacity for fish production based on the integration of the “Fish‑ PrFEQ” nutritional bioenergetics model of Cho & Bureau (1998) with the hydrodynamic model of Dillon & Rigler (1974).
The adoption of this approach will allow evaluating each process or farm in a compartmentalized way, aiming to determine the real contribution of wastes in the aquatic environment, besides aiding in defining the carrying capacity of the reservoir for fish production. These measures will assist in monitoring zootechnical efficiency and in improving the regulations for public water concessions for aquaculture purposes, besides enabling and encouraging producers and the aquaculture industry to use feeds with better nutritional quality and lower environmental impact.
Environmental impact of aquaculture
in lakes and reservoirs
The main impacts related to aquaculture in rivers, lakes, and reservoirs are associated to the increased flow of particles and dissolved nutrients in the environment (Sugiura et al., 2006; Azevedo et al.,
2011; Gondwe et al., 2011; Canale et al., 2016); the mortality and loss of biodiversity of fishes (Sang, 2006); the contamination by chemical compounds (through the use of antibiotics, antiparasitics, anesthetics, and disinfectants) (Burridge et al., 2010); the lower dissolved oxygen concentrations (Hamblin & Gale, 2002); the occurrence of harmful algal blooms (Sowles, 2009); and the increase in the contents of organic matter and metals in the sediment (Xia et al., 2016). In addition to these factors, the following were observed: changes in the biodiversity of the microflora and benthic sediments (Buschmann et al., 2009); changes in the trophic structure and biological attributes of the diet of wild fishes due to the introduction of exotic species from aquaculture (Arthur et al., 2010; Carvalho et al., 2012; Ramos et al., 2014); dissemination of diseases that may affect wild populations of aquatic organisms (Israel, 2007); and, in some cases, direct conflicts with other users of water resources, which can cause adverse social effects (Béné & Obirih‑Opareh, 2009).
Aquaculture effluents
Most of the effluents from aquaculture come from diets and from excess feed not consumed during feeding, resulting in solid and dissolved wastes (Bureau & Hua, 2010). The releases of P in continental water bodies (freshwater) are more alarming, because this nutrient is usually a limiting factor for plant (algae and macrophyte) growth. In marine environments, the outputs of nitrogenous wastes cause the greatest concern regarding environmental impact (Rabassó & Hernández, 2015); however, in some reservoirs, the high entry of N (coming mainly from the protein in the feed) can generate toxic ammonia in the water and endanger fish survival.
Hua & Bureau (2006) emphasize that solid waste (fecal material and food lost when feeding) can settle and impact the benthic ecosystem of inland and marine waters; therefore, estimating solid and dissolved wastes is the main strategy for monitoring and planning mitigation actions in environments where aquaculture farms are installed.
Nitrogenous wastes
amino acids in relation to the nutritional requirements of fish (NRC, 2011). The imbalance of amino acids can lead to decreased protein deposition and to increased nitrogen excretion (Cai et al., 2016).
Since the diets for fish contain high levels of protein (28 to 50%), a great amount of energy is supplied as nitrogen compounds, which leads to increased production of catabolites, as nitrite, nitrate, and ammonia, for example. In this way, saving protein content with the inclusion of digestible energy in the diet can significantly reduce pollution, due to the decrease in nitrogen end products.
Another strategy used to reduce pollution is using the ideal protein for the species. Botaro et al. (2007) showed that it is possible to reduce the content of digestible crude protein (CP) from 27 to 24.3% in diets for Nile tilapia (Oreochromis niloticus) reared in cages, and that this reduction can be achieved by a supplementation with amino acids.
In this scenario, Bureau & Hua (2010) highlighted the importance of digestible protein (DP) and digestible energy (DE) in the diet to increase N retention. Hargreaves (1998) conducted a literature review to identify the percentage of N retained by fish and its release into the environment in several aquaculture production systems. The author found differences from 19 to 21% retention with 73 to 86% of excreted nitrogenous compounds for species such as Ictalurus pagrus, O. niloticus, and Clarias macrocephalus, and that the use of diets with reduced
levels of protein and increased levels of DE resulted in a decrease in the effect of feed pollution in the aquatic environment.
Phosphate waste
The way in which P is excreted by fish can have a direct effect on the enrichment of the aquatic environment and on algae growth. Usually P is excreted in soluble forms and particles: the soluble forms consist of organic P and PO43-, which directly
affect water quality, while the form of particles settles at the bottom of lakes and reservoirs or accumulates in the sediment (Tundisi & Tundisi, 2008; Canale et al., 2016).
Soluble P is readily available as a nutrient for plant growth, and a significant amount of the free fraction contained in total P is in the form of inorganic orthophosphate. The form of P consumed by fish
will affect the amount of soluble P and particulate excreta, as well as the amount of P that could later be biologically degraded in the sediment (Canale et al., 2016). Therefore, the definition of nutrient inputs via aquaculture feed is of extreme importance for the sustainable development of this activity.
Wang et al. (2012) reported that wastes from salmon (Salmo salar) farms in Norway, in 2009,
were released into the environment – equivalent to a discharge of about 404,000, 50,600, and 9,400 Mg C, N, and P, respectively, based on the total production of 1,02x10⁶ Mg salmon. These results
confirm those obtained by Chowdhury et al. (2013), who assessed O. niloticus fed different levels of protein in the diet (40, 38, and 35%) and found an increase of 4.2 to 5.0 kg in the excretion of P and a decrease of 46.2 to 40.9 kg in that of N per ton of tilapia produced. Montanhini Neto & Ostrensky (2015) also analyzed the potential waste load of the commercial production of O. niloticus. According to these authors, the total nutrient content in the waste generated per ton of biomass of produced tilapia was of 1,040.63 kg OM, 44.95 kg N, and 14.26 kg P, which represent 78% OM, 65% protein, and 72% P provided by feed.
Penczak et al. (1982) state that only 32% of P is used for the metabolism of fish, and the remaining 68% are transferred to the environment. Alves & Baccarin (2005) also reported that 66% of the P obtained by intensive feeding is deposited in the sediment, 11% is dissolved in water, and 23% is incorporated by the farmed fish; this emphasizes the need for programs for the management and control of aquaculture waste.
Tacon (2005) points out that, in 1985, the diets used in salmon farming in Chile contained 60% CP and only 6 to 8% lipids; however, in 2005, the average percentage of each of these nutrients was 35%, causing a decrease in the rates of excretion of metabolites by fish. For this author, these practical results minimized the polluting potential of the fish farms evaluated.
in feed digestibility and in processing technologies (Technical..., 2005; Bureau & Hua, 2010).
The average feed conversion of the diets used in Norway’s salmon industry reduced from 2.08, in 1974, to 1.00 in 2005 (Technical..., 2005). In Canada, the average feed conversion of the diets for salmon, in the 1980s, was 1.50, and, 20 years later, 1.10. Consequently, there was a decrease in excretion of 14 kg solid P per ton of fish produced (Bureau & Hua, 2010).
Mathematical models applied to aquaculture
Factorial modeling has been successfully used to estimate amino acid requirements; to improve the energy protein balance of diets for several animals, such as laying hens (Gous & Nonis, 2010), poultry, and swine (Sakomura et al., 2015); and also to determine the dietary needs of horses (Cordero et al., 2013) and cattle (Albertini et al., 2012).
In general, a deductive factorial model can be used to examine the relationship between the net requirement of an essential element for animals (the requirement for growth and the replacement of endogenous loss, for example) and the concentration in the diet needed to meet this requirement, with reduction in losses and excretions (NRC, 2011; Montanhini Neto & Ostrensky, 2015). It should be noted that each model considers the characteristics of the species, environment, and diet, among other factors that affect the final response to be evaluated.
Fish growth is a complex process that represents the results of a series of physiological and behavioral processes, involving food intake, the deposition of animal tissue, and the excretion of metabolites (Jobling, 2011). In each situation in commercial fish production, the knowledge of the growth rates in a given period, in relation to feed consumption, is essential for the analysis of the future viability of the venture.
Mathematical models that predict fish growth rates and feed requirements can be used to maximize efficiency and improve animal growth. These models can be a useful tool both for planning and managing production, as well as describing future scenarios; however, they must be used properly (Iwama & Tautz, 1981; Cho & Bureau, 1998; Dumas et al., 2010).
Despite the many attempts to develop mathematical expressions to describe fish growth, there is a wide range of approaches and concepts (Iwama & Tautz, 1981). It is common to find growth expressed in centimeters per month, instant growth rates, percentage in length change or percentage in weight change, often without any references to temperature, feed, or farming conditions (NRC, 2011).
Therefore, the adoption of an appropriate growth model allows estimating the (feed) requirements for the energy needs and growth rates of fish. This information allows the producer to solve several problems related to growth and feeding rates that arise in the routine of fish farming (Dumas et al., 2010).
Furthermore, it is possible, for example, to predict the average final weight of fish after a certain time of farming; to estimate the time required for the fish to reach a given commercial size, at a set temperature; or to decide on the necessary average temperature to produce a given size of fish in an exact period of time. In addition, a good mathematical model can also provide information about the biomass stock and daily feed, energy, and amino acid requirements (Iwama & Tautz, 1981; Bureau et al., 2002).
Prediction models of body growth applied in
fish farming
To measure fish growth, the ratio of length or weight is usually used (Ricker, 1979; Bureau et al., 2002; Jobling, 2011). The simplest method of reporting growth is by evaluating the absolute increase in weight or growth. This implies that the relationship between time and weight is linear, and that the rate of absolute growth is the same, regardless of the size of the fish. However, the growth rate varies with the size of the fish, and the relative growth rate (GRR) will allow comparing between treatments with fishes of different sizes (Hopkins, 1992). Relative growth (GR) and the GRR are mathematically expressed according to the following equations: GR = (Wt ‑ Wi)/Wi and GRR = (Wt ‑ Wi)/Wi × ∆t, in which Wt is the weight at time t; Wi is the initial weight; and ∆t is the duration of the experiment (Ricker, 1979; Hopkins, 1992).
the GRR is restricted to the period of time calculated and cannot be easily converted to another time period (Hopkins, 1992). Therefore, other models and equations for growth can be used to obtain better growth simulations and values.
To eliminate the problem related with relative growth rates over time, another model of exponential growth rate recommended is the specific growth rate (SGR) coefficient (Ricker, 1979; Hopkins, 1992). It is usually reduced to an instantaneous growth rate or to a specific, intrinsic, exponential, logarithmic, or compound interest rate (Ricker, 1979). The logarithm of final (lnPf) and initial (lnPi) weights at a given time in days (d) is used, as shown in the following equation: SGR = [(lnPf ‑ lnPi)/d] × 100.
Another equation that is very used in aquaculture is the one to calculate daily growth coefficient (DGC), given by: DGC = [(Pf1/3 - Pi1/3)/d] × 100. Only the
mean values of the weight at the beginning (Pi) and at
the end (Pf) of animal growth are considered, being
divided by the time in days (d) at a given exponential (1/3), which represents a ratio of exponential growth of
0.3333 and is used to adjust the growth curve that is not considered in the equation for SGR.
The equation for linear growth coefficient (LGC), as the other ones, does not reflect the actual trajectory of the animal during farming, since it considers only the final weight subtracted by the initial weight and divided by the number of farming days. It was believed that this would be a representation of what actually happened during farming; however, the used equations disregard oscillations and differences in growth related to water temperature and metabolic conditions during the period, as exemplified in the following equation: LGC = (Pf - Pi)/d.
Due to the great diversity of models for the prediction and calculation of the growth trajectory of fish (SGR, DGC, and LGC), it is necessary to consider factors such as water temperature in the relationship between fish metabolism and growth. In this sense, Iwama & Tautz (1981) applied the concept of thermal unit to estimate growth in juvenile trout. Cho (1992), in turn, explicitly introduced the concept of degree‑days in his model and proposed a mathematical derivation for thermal growth coefficient (TGC), given by the following equation:
TGC = {[Pf(1 ‑ b) - Pi(1 ‑ b)] / ∑t × d} × 100,
in which Pi and Pf are the initial and final body
weights, respectively; d is day; t is the temperature in °C; and (1 ‑ b) is the exponent of body weight.
The TGC model, since then, has been widely used in aquaculture (Kaushik, 1998; Bureau & Hua, 2010; Milne et al., 2015), allowing a fine adjustment of fish growth curves.
Integration between growth models and fish
energy requirements
The prediction models were developed to determine animal growth and feed consumption, as shown by the studies of Pfeffer & Pieper (1979) and Ricker (1979). These models are also used to determine metabolic excretion and nutrient bioavailability for several species and production systems, as observed in the works by Cho & Bureau (1998), Booth et al. (2010), Bureau & Hua (2010), Chowdhury et al. (2013), Bouwman et al. (2013), Bueno (2015), and Canale et al. (2016).
In general, the first models, of varying complexity, partition the energy ingested through the use of energy balance equations (Dumas et al., 2010). A simple model would be: C = ME + GR + E, in which C is the energy ingested, ME is the metabolizable energy, GR is the growth retention, and E is the endogenous excretion (Jobling, 2011).
From this balance equation, an energy balance can be built using any period of time from the entire life cycle in a snapshot in time. Pfeffer & Pieper (1979) suggested a deductive model, containing empirical components, which was used to determine the dietary needs of essential elements for fish. The model included factors for dietary requirement (Edt), GR, E, and the availability of the element in the diet (A). These factors were empirically determined, but their relationship was deductively built as Edt = (GR + E) / A.
Nutritional bioenergetics
Bioenergetics describes the energy flow of nutrients within a biological system, for example, in a fish or a shrimp. This approach shows the biological process of using and transforming absorbed nutrients for energy, for the synthesis of the own body (NRC, 2011). The feed that is consumed is transformed in the body; complex chemical compounds are divided into more simple components – proteins into amino acids, carbohydrates into glucose, and lipids into fatty acids –; and the energy released from the metabolic processes, is used for maintenance, production, and reproduction (Strand, 2005).
The metabolic expenditure by an animal is often measured as the amount of heat produced, which is often called respiration (R). By analyzing the difference between ME and R, the retained energy is obtained, usually referred to as production (Pd): Pd = ME ‑ R.
A part of this energy is lost in feces, but there are also losses by urinary excretion and by the gills through diffusion on body surface. Two forms of energy can be defined: DE and ME; DE is able to transform itself into ME.
According to Jobling (2011), when an animal is under starvation (C = 0), the body tissues are catabolized to support respiration, the production (retained energy) is negative, and the animal loses body mass. However, if an animal ingests some food, but the energy retained is null over time (i.e., Pd = 0), there is a balance, and the animal meets the requirements for maintenance.
Therefore, determining and providing diets that allow meeting the ideal energy requirements will make it possible to maintain the metabolic functions, increase the production (growth, fat, and reproduction), and minimize losses and wastes generated by the metabolism of fish.
Bioenergetic factorial model applied
in fish farming
According to Cho et al. (1982), the principles of the bioenergetic factorial model were applied to fish, in 1914, by Ege & Krogh and, in 1939, by Ivlev. Many studies regarding the use and waste of energy have been carried out since then for various species of fish
(Kaushik & Médale, 1994; Booth et al., 2010; Canale et al., 2016).
Strand (2005) reports that models based on similar principles had already been previously proposed by other researchers (Kerr, 1971). However, the model developed by Kitchell et al. (1974), used to simulate the growth of bluegill (Lepomis macrochirus), was
the most effective and was later used as a standard in research on poikilotherms, representing the bioenergetics model approach (Cui & Xie, 2000).
This model has been applied to several different species, such as, for example: Phoxinus phoxinus (Cui
& Xie, 2000), O. niloticus (Yi, 1998; Chowdhury et
al., 2013; Bueno, 2015), Oncorhynchus mykiss (Milne
et al., 2015), and Larimichthys crocea (Cai et al.,
2016).
In fish ecology, bioenergetic models have been used primarily to calculate the consumption of feed based on temperature and growth data (Kitchell et al., 1977; Hanson et al., 1997), subsidizing the development of computer software, as Fish Bioenergetics, version 3.0 (Hanson et al., 1997). However, these software are very generalist because they use the same metabolic rate, regarding the natural food chain (plankton and wild fish) and disregarding oscillations in temperature and body energy retention rates in different life stages and species. This may generate inaccurate and little precise values to estimate wastes produced by the animal metabolism.
However, the application of the bioenergetic models for aquaculture takes into account all of these factors, as exemplified by the free software Aquability . These models are accurate in the development of ideal strategies for feed and waste calculation (Cho & Bureau, 1998; Strand, 2005), and can be improved and become effective tools for farmers and for agencies funding and monitoring the activity.
Use of nutritional bioenergy to estimate
aquaculture waste
rest of the feed (not digested) is excreted in feces as solid waste (SW).
The by‑products of the metabolism, such as ammonia, urea, phosphates, and carbon dioxide, are excreted as dissolved waste (DW), mainly through the kidneys. The total waste (TW) from fish feed during farming is composed by solid and dissolved wastes, along with the waste of apparent feed loss (AFL) during feeding, in which TS = SW + DW + AFL.
However, the SW, DW, and AFL outputs are biologically estimated by: SW = [food consumed × (1 ‑ apparent digestibility coefficient, ADC)]; and DW = [(food consumed × ADC) ‑ nutrients retained by the fish].
Therefore, the DW may be calculated by the difference between the digestible and retained nutrients in the carcass. The precise estimate of total SW requires a reliable calculation of the wastes of AFL. Therefore, the estimation of AFL is almost impossible. However, the best estimates can be made based on the energy requirements and the expected gain, as in Cho (1992), in which the energy efficiency (energy gain/consumption) indicates the degree of AFL for a particular operation. In this context, the requirement and quantity of theoretical feed (QTF) can be calculated based on the nutritional energy balance (QTF = gain + excrete), which includes heat loss.
The amount of feed input that exceeds the QTF is assumed as AFL, and all nutrients that encompass AFL must be included in the quantification of solid waste. According to Cho (1992), this approach can lead to a relatively conservative estimate.
However, biological procedures based on the ADC for SW and on comparative analyzes of carcasses for DW provide reliable estimates, and the biological methods are flexible and able to adapt to a variety of conditions and farming environments (Bureau & Hua, 2010).
Mathematical models for the analysis
of the carrying capacity of reservoirs
One of the main strategies adopted by the managing and monitoring agencies is the use of hydrodynamic models that calculate the carrying or nutrient load capacity of a particular water body, as well as the effect of fish farming.
Based on these aspects, several mathematical models were proposed: of Dillon & Rigler (1974), of Vollenweider (1975), Mike application, ECO Lab module (DHI Water and Environment), “Variáveis que Interagem de Modo Seminquantitativo” (Visq), Structural Thinking Experimental Learning Laboratory with Animation (Stella), Qualres, Ecopath Modeling, “Pegada Ecológica”, Delph 3D, and 3D Water Modeling System (Mohid), which are tools that simulate the dynamics of the variables that occur in the aquatic environment.
In general, these models are based on the direct relationship between P increase and algae growth. However, when these models are used to determine the carrying capacity for fish production, specific zootechnical and limnological factors are not always considered, which can under‑ or overestimate the real contribution of effluents from fish production. This shows the importance of the integration of bioenergetic models to determine the wastes from fish farms and to assist in the input of data for hydrodynamic modeling.
Integration between the mathematical models for
the definition of carrying capacity
To define the carrying capacity, the Dillon & Rigler model (1974) was applied, considering the P concentration (mg m-3) in water as a function
of the annual P load (La, in mg m-2 per year), the
P retention coefficient (Rp), average depth (z, in meters), and water residence time of the reservoir (ρ, in years). P concentration is given by the equation: [P] = La (1 ‑ Rp) / (z × ρ), in which z is calculated by the ratio between the volume and the area of the body of water; ρ is calculated by the ratio between the average and maximum flow volume of the reservoir; and Rp is the P retention coefficient from the study by Larsen & Mercier (1976), with modifications by Canfield & Bachmann (1981), obtained by the following equation: Rp = 1 / (1 + 0.614 × ρ0.491).
maximum concentration allowed by Resolution No. 357/2005 of Conselho Nacional do Meio Ambiente (Conama) (Brasil, 2005). From the Δ[P] permitted, the maximum La allowed is calculated, i.e., the amount of P that can be added to water.
Currently, Agência Nacional das Águas (ANA) takes into account the multiple uses of the reservoir in the issuance of permits for aquaculture activities, based on Resolution No. 357/2005 of Conama (Brasil, 2005). According to legislation, the limit for the total P is 30 mg m-3, in lentic
environments, and 50 mg m-3 in intermediary
environments, with water residence time varying from 2 to 40 days and permanent tributaries for lentic environments.
Based on these numbers and to standardize the amount of P allowed for aquaculture activities, the maximum amount of P allowed is limited to the fraction of 1/6 for lentic environments (30 mg m-3),
i.e., the maximum load to be discharged by aquaculture is of 5 mg m-3 P per year (ANA, 2009).
The remaining 5/6 would be reserved for other uses with P contributions to water, such as the dilution of domestic and industrial sewages, besides the amount of natural P. It should be noted that, in specific cases, in which there is a prior study of the reservoir, analyzing its multiple uses, the ability of the hydric body for aquaculture activities may vary; however, it will depend on the analysis and approval of the regulatory agency.
Therefore, La was calculated in function of a Δ[P] of 5 mg m-3. Then, the P load allowed in all the
reservoir (Lr) was determined, in mg per year, using
the La, representing the maximum load of P allowed per square meter, multiplying the value obtained by the water surface area (A, in m2) from the reservoir,
according to the equation: Lr = La × A. The water permanence of 90% was used, which is obtained by the equation: Lr = (Δ[P] × V90 × ρ) / (1 ‑ Rp), in
which V90 is the volume at 90% of water permanence
(ANA, 2009). Then, Lr was converted into the annual authorized fish production. For this purpose, the amount of P in water for each ton of fish produced must be estimated.
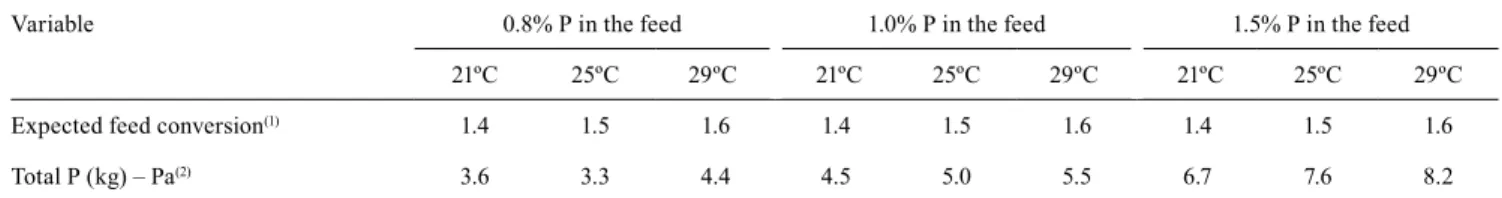
Example of the application of the proposed methodology
The Fish‑PrFEQ factorial bioenergetic model of Cho & Bureau (1998) is used to simulate the P load released by fish production (Pa). Different levels of total P in the feed (0.8, 1.0, and 1.5%) are considered for tilapia under different water temperatures (21, 25, and 29ºC, respectively) (Table 1). With Pa, the total P load allowed throughout the reservoir (Lr) is calculated by the equation that multiplies the L value (which represents the maximum load of permitted P per square meter) by A (total surface area, in m2), i.e.,
Lr = L × A. Then, having Lr and Pa, the authorized fish production is calculated (B, in mg per year) based on the allowed P load in the reservoir (Lr, in kg per year), with B = Lr / Pa.
Specifically, a simulation of the application of this methodology was carried out in the reservoir of Ilha Solteira, in Paraná river, in the state of São Paulo, Brazil (Table 2).
Table 1. Estimation of solid waste (total P) in the production of Nile tilapia (Oreochromis niloticus), at different temperatures,
in cages, by the bioenergetic nutritional model.
Variable 0.8% P in the feed 1.0% P in the feed 1.5% P in the feed
21ºC 25ºC 29ºC 21ºC 25ºC 29ºC 21ºC 25ºC 29ºC
Expected feed conversion(1) 1.4 1.5 1.6 1.4 1.5 1.6 1.4 1.5 1.6
Total P (kg) – Pa(2) 3.6 3.3 4.4 4.5 5.0 5.5 6.7 7.6 8.2
Concluding remarks
The use of factorial bioenergetic models, integrated with the hydrodynamic model, aids in determining the waste load and in adjusting the values used to calculate the carrying capacity of the reservoir for fish production.
The approach presented allows monitoring and managing aquaculture enterprises installed in lakes and reservoirs, besides improving the analysis methodology used for licensing each aquaculture enterprise, considering water quality parameters, feed nutritional quality, and peculiarities of each species (feeding habits, genetics, and growth stages). In this way, it becomes possible to encourage producers and the industry to use feed with lower environmental impact and management techniques that promote aquaculture sustainability.
Regarding fish production, in loco joint inspection actions (production reports) are recommended, as well as programs for monitoring the quality of water and
sediments for the control of the carrying capacity of lakes and reservoirs.
Acknowledgments
To Conselho Nacional de Desenvolvimento Científico e Tecnológico (CNPq), to International Science and Technology Partnerships Canada (ISTP Canada, process No. 490226/2012‑4), and to Fundação de Amparo à Pesquisa do Estado de São Paulo (Fapesp, project No. 2016/10.563‑0), for financial support.
References
ALBERTINI, T.Z.; MEDEIROS, S.R.; TORRES JÚNIOR, R.A.A.; ZOCCHI, S.S.; OLTJEN, J.W.; STRATHE, A.B.; LANNA, D.P.D. A methodological approach to estimate the lactation curve and net energy and protein requirements of beef cows using nonlinear mixed‑effects modeling. Journal
of Animal Science, v.90, p.3867‑3878, 2012. DOI: 10.2527/
jas.2010‑3540.
ALVES, R.C.P.; BACCARIN, A.E. Efeitos da produção de peixes em tanques‑rede sobre sedimentação de material em suspensão e de nutrientes no Córrego da Arribada (UHE Nova Table 2. Application of the new methodology of the bioenergetic nutritional model used to determine the carrying capacity and to manage the maximum fish production of the reservoir of Ilha Solteira, in the state of São Paulo, Brazil.
Item Information
Type of reservoir Lentic
Blocked river Rio Preto
Basin/region Paraná
Water level (n.a.) Operating minimum
Maximum value 328.00
Minimum value 314.00
Maximum area 1,195.20
Minimum area 638.20
Maximum volume 21,060.30
Minimum volume 8,232.40
Average depth at the minimum value considered (m) 12.90
Average flow rate (m³ s-1) 5,222.62
Residence time (td, years) 0.13
Residence time (td, days) 46.67
Δ[P] (mg m-3)(1) 5.00
Coefficient of retention of P (R)(2) 0.56
Species Oreochromis niloticus
Maximum P load in the reservoir (kg per year) 726,531.16
Maximum fish production (Mg per year) – 0.8 P at 25ºC 219,182.13 (obtained by the model) Maximum fish production (Mg per year) – 1.0 P at 25ºC 145,188.21 (obtained by the model) Maximum fish production (Mg per year) – 1.5 P at 25ºC 96,035.45 (obtained by the model)
Avanhandava), baixo rio Tietê. In:NOGUEIRA, M.G.; HENRY, R.; JORCIN, A. (Org.). Ecologia de reservatórios: impactos
potenciais, ações de manejo e sistemas em cascata. São Carlos: Rima, 2005. p.329‑347.
ANA. AGêNCIA NACIONAL DE ÁGUAS. Nota Técnica
n.009/2009/GEOUT/SOF-ANA: atualização na metodologia de
análise de pedidos de outorga para piscicultura em tanques‑rede. Brasília, 2009. 3p.
ARTHUR, R.I.; LORENZEN, K.; HOMEKINGKEO, P.; SIDAVONG, K.; SENGVILAIKHAM, B.; GARAWAY, C.J. Assessing impacts of introduced aquaculture species on native fish communities: Nile tilapia and major carps in SE Asian freshwaters. Aquaculture, v.299, p.81‑88, 2010. DOI: 10.1016/j.
aquaculture.2009.11.022.
AYER, N.W.; TYEDMERS, P.H. Assessing alternative aquaculture technologies: life cycle assessment of salmonid culture systems in Canada. Journal of Cleaner Production, v.17, p.362‑373, 2009. DOI: 10.1016/j.jclepro.2008.08.002.
AZEVEDO, P.A.; PODEMSKI, C.L.; HESSLEIN, R.H.; KASIAN, S.E.M.; FINDLAY, D.L.; BUREAU, D.P. Estimation of waste outputs by a rainbow trout cage farm using a nutritional approach and monitoring of lake water quality. Aquaculture, v.311, p.175‑186, 2011. DOI: 10.1016/j.aquaculture.2010.12.001. BARTON, J.R.; FLøYSAND, A. The political ecology of Chilean salmon aquaculture, 1982‑2010: a trajectory from economic development to global sustainability. Global
Environmental Change, v.20, p.739‑752, 2010. DOI: 10.1016/j.
gloenvcha.2010.04.001.
BÉNÉ, C.; ARTHUR, R.; NORBURY, H.; ALLISON, E.H.; BEVERIDGE, M.; BUSH, S.; CAMPLING, L.; LESCHEN, W.; LITTLE, D.; SQUIRES, D.; THILSTED, S.H.; TROELL, M.; WILLIAMS, M. Contribution of fisheries and aquaculture to food security and poverty reduction: assessing the current evidence. World Development, v.79, p.177-196, 2016. DOI: 10.1016/j.worlddev.2015.11.007.
BÉNÉ, C.; OBIRIH‑OPAREH, N. Social and economic impacts of agricultural productivity intensification: the case of brush park fisheries in Lake Volta. Agricultural Systems, v.102, p.1-10, 2009. DOI: 10.1016/j.agsy.2009.06.001.
BOOTH, M.A.; PIROZZI, I.; ALAN, G.A. Estimation of digestible protein and energy requirements of yellowtail kingfish
Seriola lalandi using a factorial approach. Aquaculture, v.307, p.247-259, 2010.
BOTARO, D.; FURUYA, W.M.; SILVA, L.C.R.; SANTOS, L.D. dos; SILVA, T.S. de C.; SANTOS, V.G. dos. Redução da proteína da dieta com base no conceito de proteína ideal para tilápias‑do‑ nilo (Oreochromis niloticus) criadas em tanques‑rede. Revista
Brasileira de Zootecnia, v.36, p.517-525, 2007. DOI: 10.1590/
S1516‑35982007000300001.
BOUWMAN, A.F.; BEUSEN, A.H.W.; OVERBEEK, C.C.; BUREAU, D.P.; PAWLOWSKI, M.; GLIBERT, P.M. Hindcasts and future projections of global inland and coastal nitrogen and phosphorus loads due to finfish aquaculture.
Reviews in Fisheries Science, v.21, p.112-156, 2013. DOI:
10.1080/10641262.2013.790340.
BRASIL. Resolução nº 357, de 17 de março de 2005. Dispõe sobre a classificação dos corpos de água e diretrizes ambientais para o seu enquadramento, bem como estabelece as condições e padrões de lançamento de efluentes, e dá outras providências.
Diário Oficial da União, 18 mar. 2005. Seção 1, p.58‑63.
BUENO, G.W. Modelo bioenergético nutricional e balanço de massas para o monitoramento e estimativa de efluentes da
produção comercial de tilápia do Nilo (Oreochromis niloticus)
em reservatório tropical. 2015. 127p. Tese (Doutorado) –
Universidade de Brasília, Brasília.
BUREAU, D.P.; HUA, K. Towards effective nutritional management of waste outputs in aquaculture, with particular reference to salmonid aquaculture operations. Aquaculture
Research, v.41, p.777‑792, 2010. DOI: 10.1111/j.1365‑
2109.2009.02431.x.
BUREAU, D.P.; KAUSHIK, S.J.; CHO, C.Y. Bioenergetics.In: HALVER, J.E.; HARDY, R.W. (Ed.). Fish Nutrition. 3rd ed.
San Diego: Academic Press, 2002. p.78‑95. DOI: 10.1016/B978‑ 012319652-1/50002-1.
BURRIDGE, L.; WEIS, J.S.; CABELLO, F.; PIZARRO, J.; BOSTICK, K. Chemical use in salmon aquaculture: A review of current practices and possible environmental effects.
Aquaculture, v.306, p.7-23, 2010.
BUSCHMANN, A.H.; CABELLO, F.; YOUNG, K.; CARVAJAL, J.; VARELA, D.A.; HENRíQUEZ, L. Salmon aquaculture and coastal ecosystem health in Chile: Analysis of regulations, environmental impacts and bioremediation systems. Ocean and
Coastal Management, v.52, p.243‑249, 2009. DOI: 10.1016/j.
ocecoaman.2009.03.002.
CAI, H.; ROSS, L.G.; TELFER, T.C.; CHANGWEN, W.; ZHU, A.; ZHAO, S.; XU, M. Modelling the nitrogen loadings from large yellow croaker (Larimichthys crocea) cage aquaculture.
Environmental Science and Pollution Research, v.23,
p.7529-7542, 2016. DOI: 10.1007/s11356-015-6015-0.
CANALE, R.P.; WHELAN, G.; SWITZER, A.; EISCH, E. A bioenergetic approach to manage production and control phosphorus discharges from a salmonid hatchery. Aquaculture, v.451, p.137‑146, 2016. DOI: 10.1016/j.aquaculture.2015.09.008. CANFIELD, D.E.; BACHMANN, R.W. Prediction of total phosphorus concentrations, chlorophyll a, and Secchi depths in natural and artificial lakes. Canadian Journal of Fisheries and
Aquatic Sciences, v.38, p.414‑423, 1981. DOI: 10.1139/f81‑058.
CARVALHO, E.D.; DAVID, G.S; SILVA, R.J. (Ed.). Health
and Environment in Aquaculture. Rijeka: Intech, 2012. 428p.
DOI: 10.5772/2462.
CHO, C.Y. Feeding systems for rainbow trout and other salmonids with reference to current estimates of energy and protein requirements. Aquaculture, v.100, p.107-123, 1992. DOI: 10.1016/0044‑8486(92)90353‑M.
CHO, C.Y.; BUREAU, D.P. Development of bioenergetic models and the Fish‑PrFEQ software to estimate production, feeding ration and waste output in aquaculture. Aquatic
Living Resources, v.11, p.199‑210, 1998. DOI: 10.1016/S0990‑
CHO, C.Y.; SLINGER, S.J.; BAYLEY, H.S. Bioenergetics of salmonid fishes: energy intake, expenditure and productivity.
Comparative Biochemistry and Physiology Part B:
Comparative Biochemistry, v.73, p.25‑41, 1982. DOI:
10.1016/0305‑0491(82)90198‑5.
CHOWDHURY, M.A.K.; SIDDIQUI, S.; HUA, K.; BUREAU, D.P. Bioenergetics‑based factorial model to determine feed requirement and waste output of tilapia produced under commercial conditions. Aquaculture, v.410/411, p.138‑147,
2013. DOI: 10.1016/j.aquaculture.2013.06.030.
CORDERO, V.V.; CAVINDER, C.A.; TEDESCHI, L.O.; SIGLER, D.H.; VOGELSANG, M.M.; ARNOLD, C.E. The development and evaluation of a mathematical nutrition model to predict digestible energy intake of broodmares based on body condition changes. Journal of Animal Science, v.91, p.2169-2177, 2013. DOI: 10.2527/jas.2011‑4659.
CUI, Y.; XIE, S. Modelling Growth in Fish. In:THEODOROU, M.K.; FRANCE, J. (Ed.). Feeding Systems and Feed Evaluation
Models. Wallingford: Cabi, 2000. p.413‑434.
DILLON, P.J.; RIGLER, F.H. A test of a simple nutrient budget model predicting the phosphorus concentration in lake water.
Journal of the Fisheries Research Board of Canada, v.31,
p.1771‑1778, 1974. DOI: 10.1139/f74‑225.
DUMAS, A.; FRANCE, J.; BUREAU, D. Modelling growth and body composition in fish nutrition: where have we been and where are we going? Aquaculture Research, v.41, p.161‑181,
2010. DOI: 10.1111/j.1365‑2109.2009.02323.x.
EGE, R.; KROGH, A. On the relation between the temperature and the respiratory exchange in fishes. International
Review of Hydrobiology, v.7, p.48‑55, 1914. DOI: 10.1002/
iroh.19140070105.
GONDWE, M.J.S.; GUILDFORD, S.J.; HECKY, R.E. Carbon, nitrogen and phosphorus loadings from tilapia fish cages in Lake Malawi and factors influencing their magnitude. Journal
of Great Lakes Research, v.37, p.93‑101, 2011. Supplement 1.
DOI: 10.1016/j.jglr.2010.11.014.
GOUS, R.M.; NONIS, M.K. Modelling egg production and nutrient responses in broiler breeder hens. Journal of
Agricultural Science, v.148, p.287‑301, 2010. DOI: 10.1017/
S0021859610000183.
HAMBLIN, P.F.; GALE, P. Water quality modeling of caged aquaculture impacts in Lake Wolsey, North Channel of Lake Huron. Journal of Great Lakes Research, v.28, p.32‑43, 2002.
DOI: 10.1016/S0380‑1330(02)70560‑1.
HANSON, P.C.; JOHNSON, T.B.; SCHINDLER, D.E.; KITCHELL, J.F. Fish bioenergetics 3.0 for windows manual. Madison: University of Wisconsin, Centre for Limnology, 1997. 116p.
HARGREAVES, J.A. Nitrogen biogeochemistry of aquaculture ponds. Aquaculture, v.166, p.181‑212, 1998. DOI: 10.1016/
S0044‑8486(98)00298‑1.
HOPKINS, K.D. Reporting fish growth: a review of the basics.
Journal of the World Aquaculture Society, v.23, p.173-179,
1992. DOI: 10.1111/j.1749‑7345.1992.tb00766.x.
HUA, K.; BUREAU, D.P. Modelling digestible phosphorus content of salmonid fish feeds. Aquaculture, v.254, p.455-465, 2006. DOI: 10.1016/j.aquaculture.2005.10.019.
ISRAEL, D.C.The current state of aquaculture in Laguna de Bay. Makati City: Philippine Institute for Development Studies,
2007. p.1‑65. (Discussion Paper Series No. 2007‑20).
IVLEV, V.S. Energy balance in the carp. Zoological Journal, v.18, p.303‑318, 1939.
IWAMA, G.K.; TAUTZ, A.F. A simple growth model for salmonids in hatcheries. Canadian Journal of Fisheries and
Aquatic Sciences, v.38, p.649‑656, 1981. DOI: 10.1139/f81‑087.
JOBLING, M. Bioenergetics in aquaculture settings. In: FARRELL, A.P. (Ed.). Encyclopedia of Fish Physiology: from
genome to environment. Amsterdam: Elsevier, 2011. p.1664‑ 1674. DOI: 10.1016/B978‑0‑12‑374553‑8.00152‑0.
KAUSHIK, S.J. Nutritional bioenergetics and estimation of waste production in non‑salmonids. Aquatic Living Resources, v.11, p.211‑217, 1998. DOI: 10.1016/S0990‑7440(98)89003‑7. KAUSHIK, S.J.; MÉDALE, F. Energy requirements, utilization and dietary supply to salmonids. Aquaculture, v.124, p.81‑97,
1994. DOI: 10.1016/0044‑8486(94)90364‑6.
KERR, S.R. A simulation model of lake trout growth. Journal
of Fisheries Research Board of Canada, v.28, p.815‑819, 1971.
DOI: 10.1139/f71-122.
KITCHELL, J.F.; KOONCE, J.F.; O’NEILL, R.V.; SHUGART JR., H.H.; MAGNUSON, J.J.; BOOTH, R.S. Model of fish biomass dynamics. Transactions of the
American Fisheries Society, v.103, p.786‑798, 1974. DOI:
10.1577/1548‑8659(1974)103<786:MOFBD>2.0.CO;2.
KITCHELL, J.F.; STEWART, D.J.; WEININGER, D. Application of a bioenergetics model to yellow perch (Perca
flavescens) and walleye (Stizostedion vitreum vitreum). Journal
of the Fisheries Research Board of Canada, v.34, p.1922-1935,
1977. DOI: 10.1139/f77‑258.
LARSEN, D.P.; MERCIER, H.T. Phosphorus retention capacity of lakes. Journal of the Fisheries Research Board of Canada, v.33, p.1742-1750, 1976. DOI: 10.1139/f76-221.
LUPATSCH, I.; KISSIL, G.W. Predicting aquaculture waste from gilthead seabream (Sparus aurata) culture using a
nutrional approach. Aquatic Living Resourses, v.11, p.265‑268,
1998. DOI: 10.1016/S0990‑7440(98)80010‑7.
MILNE, J.E.; MARVIN, C.H.; YERUBANDI, R.; MCCANN, K.; MOCCIA, R.D. Monitoring and modelling total phosphorus contributions to a freshwater lake with cage‑aquaculture.
Aquaculture Research, p.1‑15, 2015. DOI: 10.1111/are.12881.
MONTANHINI NETO, R.; OSTRENSKY, A. Nutrient load estimation in the waste of Nile tilápia Oreochromis niloticus
(L.) reared in cages in tropical climate conditions. Aquaculture
Research, v.46, p.1309‑1322, 2015. DOI: 10.1111/are.12280.
NRC. National Research Council. Nutrient requirements of
fish and shrimp. Washington: National Academy Press, 2011.
PENCZAK, T.; GALICKA, W.; MOLINSKI, M.; KUSTO, E.; ZALEWSKI, M. The enrichment of a mesotrophic lake by carbon, phosphorus and nitrogen from the cage aquaculture of rainbow trout, Salmo gairdneri. Journal of Applied Ecology, v.19, p.371‑393, 1982. DOI: 10.2307/2403474.
PFEFFER, E.; PIEPER, A. Application of the factorial approach for determining nutrient requirements of growing fish. In:
HALVER, J.E.; TIEWS, K. (Ed.). Fish nutrition and fish feed
technology. Hamburg: Heeneman Verlagsgesell‑schaft, 1979.
p.123-156.
RABASSÓ, M.; HERNÁNDEZ, J.M. Bioeconomic analysis of the environmental impact of a marine fish farm. Journal
of Environmental Management, v.158, p.24‑35, 2015. DOI:
10.1016/j.jenvman.2015.04.034.
RAMOS, I.P.; FRANCESCHINI, L.; ZICA, É.O.P.; CARVALHO, E.D.; SILVA, R.J. The influence of cage farming on infection of the corvine fish Plagioscion squamosissimus (Perciformes:
Sciaenidae) with metacercariae of Austrodiplostomum compactum (Digenea: Diplostomidae) from the Chavantes reservoir, São Paulo State, Brazil. Journal of Helminthology, v.88, p.342‑348, 2014. DOI: 10.1017/S0022149X13000229. RICKER, W.E. Growth rates and models. In: HOAR, W.S.; RANDALL, D.J.; BRETT, J.R. (Ed.) Fish physiology. London:
Academic Press, 1979. v.8, p.678‑743. DOI: 10.1016/s1546‑ 5098(08)60034‑5.
ROSS, L.G.; FALCONER, L.L.; CAMPOS MENDOZA, A.; MARTINEZ PALACIOS, C.A. Spatial modelling for freshwater cage location in the Presa Adolfo Mateos Lopez (El Infiernillo), Michoacán, México. Aquaculture Research, v.42, p.797‑807,
2011. DOI:10.1111/j.1365‑2109.2010.02689.x.
SAKOMURA, N.K.; GOUS, R.M.; KYRIAZAKIS, I.; HAUSCHILD, L. (Ed.). Nutritional modelling for
pigs and poultry. Oxfordshire: Cabi, 2015. 318p. DOI:
10.1079/9781780644110.0000.
SANG, J.‑S. Lawmaking for Management and Protection of Wetlands in China. Wetland Science and Management, v.3, p.50-53, 2006.
SOWLES, J. Aquaculture task force discussion paper on
bio-physical carrying capacity. 2009. Available at: ˂https://
www1.maine.gov/dmr/aquaculture/repor ts/documents/ carryingcapacity.pdf˃. Accessed on: Mar. 11 2015.
STRAND, Å. Growth and Bioenergetic Models and their Application in Aquaculture of Perch
(Perca fluviatilis). Umea: SLU, 2005. 61p. Rapport
n. 42. Available at: ˂http://www.haparanda.se/ download/18.786ab49113d008f 9ee5fdd/1362143818794/ Growth‑+and+Bioenergetic+Models+and+their+Applications+i n+Aquaculture+of+Perch.pdf˃. Accessed on: July 21 2016. STRASKRABA, M. Lake and reservoir management.
Verhandlungen des Internationalen Verein Limnologie, v.26,
p.193-209, 1996.
SUGIURA, S.H.; MARCHANT, D.D.; KELSEY, K.; WIGGINS, T.; FERRARIS, R.P. Effluent profile of commercially used low‑ phosphorus fish feeds. Environmental Pollution, v.140, p.95-101, 2006.
TACON, A.G.J. Salmon aquaculture dialogue: Status of information on salmon aquaculture feed and the environment. Aquafeed International, v.8, p.22‑37, 2005.
TECHNICAL Assistance Republic of the Philippines: strategy for sustainable aquaculture development for poverty reduction project. [S.l.]: Asian Development Bank, 2005. 16p. Technical Assistance Report. Project Number: 39031.
TUNDISI, J.G.; TUNDISI, T.M. Limnologia. São Paulo: Oficina
de textos, 2008. 631p.
VOLLENWEIDER, R.A. Input‑output models with special reference to the phosphorus loading concept in limnology.
Schweizerische Zeitschrift für Hydrologie, v.37, p.53‑84,
1975. DOI: 10.1007/BF02505178.
WANG, X.; OLSEN, L.M.; REITAN, K.I.; OLSEN, Y. Discharge of nutrient wastes from salmon farms: environmental effects, and potential for integrated multi‑trophic aquaculture.
Aquaculture Environment Interactions, v.2, p.267‑283, 2012.
DOI: 10.3354/aei00044.
XIA, B.; GUO, P.; LEI, Y.; ZHANG, T.; QIU, R.; KNORR, K.‑H. Investigating speciation and toxicity of heavy metals in anoxic marine sediments—a case study from a mariculture bay in Southern China. Journal of Soils and Sediments, v.16, p.665-676, 2016. DOI: 10.1007/s11368‑015‑1267‑3.
YI, Y. A bioenergetics growth model for Nile tilapia (Oreochromis niloticus) based on limiting nutrients and fish standing crop in
fertilized ponds. Aquacultural Engineering, v.18, p.157‑173,
1998. DOI: 10.1016/S0144‑8609(98)00028‑4.