Artigo
*e-mail: bellato@ufv.br
TRACE ELEMENTS IN RIVER WATERS AND SEDIMENTS BEFORE AND AFTER A MINING DAM BREACH (BENTO RODRIGUES, BRAZIL)
Danilo de C. Silvaa, Carlos R. Bellatoa,*, José de O. Marques Netoa and Maurício P. F. Fontesb aDepartamento de Química, Universidade Federal de Viçosa, 36570-000 Viçosa – MG, Brasil bDepartamento de Solos, Universidade Federal de Viçosa, 36570-000 Viçosa – MG, Brasil
Recebido em 15/02/2018; aceito em 28/05/2018; publicado na web em 26/06/2018
On November 5, 2015, the Fundão dam ruptured which caused the spill of a large quantity of tailings from the extraction of iron ores to the Gualaxo do Norte, Carmo and Doce Rivers. Seven months prior to the rupture, our group had collected water and sediment samples at 13 points along the Tripuí Creek and the entire length of the Carmo River. Six months after deposition of the mud, new samples were collected in the Carmo River. Thus, the present study sought to evaluate the concentrations of trace elements in the waters and their distribution and mobility in sediment by BCR sequential extraction before and after the deposition of the tailings mud. Arsenic concentrations in the water samples were between 10.4 and 50.4 µg L-1, which exceeded 10 ug L-1 (maximum limit permitted by Brazilian environmental regulations for water destined for human consumption) . The tailing mud layer on the sediments caused concentration increases of As (20%), Cd (13%), Co (5%), Cr (9%), Cu (11%), Ni (4%), Pb (7%) and Zn (19%) in the easily remobilized fractions. The presence of the elements in these fractions was indicative of high ecotoxicological risk and potential harm to the health of the local population.
Keywords:Mariana accident; Carmo River; fractionation; sequential extraction; bioavailability.
INTRODUCTION
On November 5, 2015, one of tailings dams of the mining company Samarco, denominated of the Fundão located in the municipality of Mariana, collapsed and released large quantities of tailings. This was considered the greatest environmental accident in Brazilian mining history.1–3 The flow of tailings mud reached the rivers Gualaxo do Norte (~55 Km), Carmo (~22 Km), Doce (~600 Km) and then the Atlantic Ocean on November 22, 2015, in the Brazilian state of Espírito Santo.2 The accident caused significant damages, including: native flora of the Atlantic Forest, areas of permanent preservation, destruction of agricultural areas, mortality of aquatic biota and terrestrial fauna water-dependent , devastation of cities, the death of mining workers and Bento Rodrigues residents and other problems.4,5 Mud collected directly from the Fundão tailings dam on November 28, 2015 presented Fe and Mn as the main elements, as well as trace elements (Pb, As, Sr, Zn, Cu, Ni and Co).2 Deposition of the mud on river sediments (mud layer) can cause remobilization of As, Co, Cu, Ni, Pb, Sr and Zn to the aquatic environment, resulting in environmental damage. Thus, after the environmental accident in Mariana, which caused the deposit of a layer of mud on sediments of the Gualaxo do Norte, Carmo and Doce Rivers, studies should be conducted to evaluate the distribution and mobility of trace elements in sediment samples and their concentrations in water samples.
In the southeastern region of the Iron Quadrangle (IQ), arsenic is distributed in close association with sulfur-rich auriferous rocks. In addition to pyrite and arsenopyrite, which are the most abundant mineral phases, trace metals sulfides appear as subordinate phases.6–8 The historic mining activities developed in this region have been responsible for the release of chemicals elements into aquatic and terrestrial environments.9–11 Large quantities of arsenic in soil (200-860 mg kg-1), sediments (22-3200 mg kg-1) and groundwater (0.4-350 µg L-1) have been found in this region.9 Besides of the arsenic, quantities of Cd (5.9-6.9 mg kg-1), Co (29.9-48.4 mg kg-1),
Cr (61.7-102.5 mg kg-1), Cu (24.3-34.8 mg kg-1), Ni (22.0-69.0 mg kg-1), Pb (21.9-37.1 mg kg-1) and Zn (33.1-77.7 mg kg-1) in sediments were also found in this region.11
Chemicals elements can be present in the sediments in the following chemical fractions: soluble, exchangeable, bound to organic matter, bound to iron, aluminum and manganese oxides/hydroxides, carbonates, phosphates, sulfates (or other secondary minerals), or bound to silicates.12,13 Therefore, determinations of total chemicals elements concentrations in environmental samples provide little detailed information on their potential effect as pollutants.14–18
The majority of metals present in the sediments are mainly associated with silicates and primary minerals, and therefore present less availability.19 When these chemical elements are introduced into the environment by human activity they show greater mobility, and are associated with other sediment fractions such as carbonates, organic matter, oxides, hydroxides and sulfides.17,20,21 The evaluation of these chemical fractions is possible when using sequential extraction methods.22–24 The methods most commonly used are the Tessier25 and BCR,26,27 proposed by the European Community Bureau of Reference. In the BCR sequential extraction method the metal fractions are evaluated in three phases: exchangeable and bound to carbonates, reducible (bound to Fe-Mn oxides) and oxizable (bound to organic material and sulfides).22 The last phase (residual) concerns metals bound to the mineral, which are soluble in strong acid solutions.20 The procedure simulates the mobilization and retention of these species in the natural environment, using alterations in environmental conditions such as pH, redox potential and degradation of organic matter.11 A series of reagents is applied to the sample, increasing the extraction force in each stage in order to dissolve the metals present in different phases of the sediments.28 The advantage of using the BCR sequential extraction method is the provision of detailed information on the origin, mode of occurrence, physical-chemical and biological availability, mobilization and transport of trace metals.17,20,28,29,30
of trace metals by means of the Cd, Cr, Cu, Ni, Pb and Zn fractionations present in the sediments. Ma et al.28 also applied the BCR sequential extraction method to evaluate the polutions levels of Cr, Pb, Cd, Co, Cu, Zn and Ni metals in sediment samples of the Yellow River (China). The results showed high availability of Cd and Co due to their high concentrations in the available fractions of the sediments.
Therefore, this work presents the results of water and sediment sample analyses covering the entire length of the Carmo River (~134 km) at two different times, before of the environmental accident at Mariana and 6 months after the accident . The second analysis was carried out in an extension that covers ~22 km of the Carmo River where tailings mud deposition occurred, from its confluence with the Gualaxo do Norte River to its encounter with the Doce River. In the iron ore mining, several processes occur to produce richer iron ore pulp, where the tailings mud is generated containing Fe, Mn and trace elements.2 During its flow through the river, mud was mixed with the bottom material (sediment), which contains high quantities of trace elements, forming a mud layer. Thus, the objective of this study was (i) to estimate the distribution and mobility of trace elements (As, Cd, Co, Cr, Cu, Ni, Pb and Zn) by the sequential extraction procedure in sediment samples, (ii) determine the concentrations of trace elements in the waters, and (iii) evaluate the possible environmental impacts of trace elements after spillage of the tailings mud. To the best of our knowledge, this work is unpublished in relation to the results obtained in evaluation of the distribution and mobility of trace elements, using a sequential extraction procedure in sediments collected a few months before and after the Mariana environmental accident.
EXPERIMENTAL SECTION
Area under study
The Carmo River (Figure 1), located in the state of Minas Gerais, in southeastern Brazil, is part of the Doce River Basin which has a drainage area of 83400 km2, including 222 municipalities and 461 districts.11 The Carmo River runs for a length of 134 km, and near its headwaters are its main tributaries, the Funil Creek and Tripuí Creek, which have their sources in the municipality of Ouro Preto, located in the southern portion of the IQ. Its mouth is in the municipality of Rio Doce, at its confluence with the Piranga River where the Doce River is formed. Among its tributaries, highlighted are the Gualaxo do Norte River on its left bank and the Gualaxo do Sul River on its right bank.
Sample collection and preparation
The first collection was performed at 13 sampling points on April 8, 2015 along the Tripuí Creek (S1) and the entire length of the Carmo River (S2 to S13), obtaining both water and surface sediment samples. On April 29, 2016, six months after the environmental accident in the municipality of Mariana, a new collection was made in this same section (S1 to S13). However, for the purpose of comparison, the present study only shows the results referring to points S11 to S13, which were subject to the tailings mud and presented higher concentrations of trace elements in the water and in the sediment fractions considered as available. These samples were labeled S11a, S12a and S13a, located downstream of the confluence with the Gualaxo do Norte River which contained the mud from the Fundão dam. Figure 1 shows the location of the sampling points. Five water samples were collected at each sampling point using 1000 mL polytetrafluoroethylene vials, previously washed and rinsed with water. The samples were acidified to pH 2 with nitric acid, stored in refrigerators and immediately transported. In the laboratory, the water samples were maintained refrigerated at 4 °C until analysis. At each sampling site, five sediment subsamples were collected (0 to 20 cm deep) using a plastic shovel. In the second collection the sediment samples containing the tailings mud were collected in the same manner described above, and the upper layer (~4 cm) of the sediment (mud layer) was collected separately. The mud layer was deposited throughout the river channels and was formed during the flow of tailings mud, which was mixed with the bottom material (sediment). Sediment samples and the mud layer were transferred to plastic bags and transported to the laboratory in refrigerators. They were then dried naturally, sieved (< 2 mm), carefully ground in a porcelain mortar and homogenized.
Reagents and glassware
All reagents used were of analytical grade as well as high purity deionized water produced with a Milli-Q® system (Millipore, Bedford, MA, USA). The multielementar standard-stock solution containing 10 mg L-1 of As and the Cd, Co, Cr, Cu, Ni, Pb and Zn metals was purchased from Perkin Elmer. Ultrapure 69.5% (w/w) HNO3 (Fluka) was used for the preparation of all standard solutions and in the preservation and dilution of the samples. All glassware was previously decontaminated using HNO3 (10%, v/v) for 48 hours, followed by repeated washing with ultrapure water.
Instrumentation
The analysis of trace elements was performed using an ICP-MS (model NexION 300D) in kinetic energy discrimination (KED) mode with helium gas. The instrumental parameters of ICP-MS are presented in the Table 1S. All of the isotopes were selected as a function of their natural abundance and spectral interference possibility. Multielement standards were used to construct a linear calibration curve. All measurements were made by employing optimized conditions previously established. A portable pH, redox potential and temperature meter (WTW, model 340i) and a portable dissolved oxygen (DO) meter (HANNA, model HI-9142) were used to characterize the physicochemical properties of the water samples. An analytical balance (AB204-S; METTLER TOLEDO, Brazil), a Fanen 315 centrifuge (São Paulo, Brazil) and a Milestone Ethos 1 microwave oven for closed-vessel acid digestion (Milestone, Sorisole, Italy) were used for the digestion of sediments and waters samples.
Analytical procedure
Physicochemical characterization of the samples
The redox potential, pH, temperature and DO were determined using portable devices to characterize the physicochemical properties of the water samples in the field. The analysis of the trace elements in the water samples was done by adding 5 mL of concentrated nitric acid to 45 mL of water. The mixture was digested in a microwave oven, raising the temperature to 160 °C in 10 min (1,000 W) and maintaining these conditions for 10 min. After digestion, the aliquots were filtered into 50 mL flasks and the volume completed with purified water (Milli-Q). For Cu dissolved analysis, the samples were filtered through a cellulose acetate filter with a pore size of 0.45 µm. The determination of trace elements was performed using ICP-MS. For the physicochemical characterization of the sediment samples, the procedures included pH, cationic exchange capacity (CEC), organic matter determination, grain size analysis and X-ray diffraction. The sediment samples were sieved (< 2 mm) and submitted to chemical and physical characterization. The pH was determined on a 1:2.5 soil: deionized water and KCl 1 mol L-1 ratio; the potential acidity (H + Al) was extracted with Ca(OAc)2 0.5 mol L−1 buffered to pH 7.0, and quantified by titration with NaOH 0.0606 mol L−1. Exchangeable Ca2+, Mg2+ and Al3+ were extracted with 1 mol L−1 KCl and Na+ and K+ were extracted with Melich-1.31 The effective cation exchange capacity was calculated by sum of cations (Ca2+, Mg2+, Na+, K+ and Al3+) and total cation exchange capacity was estimated by the sum of bases (SB) and potential acidity. The organic matter was determined according to Walkley–Black titration method32 by wet oxidation with K2Cr2O7 0.167 mol L−1 in the presence of sulfuric acid with external heating.33 The textural analysis, proportion of different grain sizes, was performed by the pipette method.31,34
Diffractograms were obtained using powder X-ray diffraction, performed on a Panalytical X’Pert PRO diffractometer equipped with a cobalt tube (Co-Kα radiation, λ = 1.790269 Å) operated at 40 kV and 40 mA. Scanning was performed using the step-by-step method, in the range between 4° and 50° 2θ, with an increment of 0.05° and time of 1 s per step.
BCR sequential extraction procedure
Approximately 0.8000 g of sediment sample sieved to < 1 mm were transferred to 50 mL centrifuge tubes and subjected to the BCR sequential extraction procedure (Table 2S) as reported by Rauret et al.26 All analyses were performed in triplicate. At the end of each step, the extracts were separated from the residual solids by centrifugation
for 20 min at 3000 rpm. The residue was washed by the addition of 16 ml of water, stirring for 15 min, and finally the resulting suspension was centrifuged. The supernatant was decanted and discarded, taking care not to discard any of the solid residues. In the fourth step, the residue was digested with aqua regia in a microwave oven, raising the temperature to 200 °C in 10 min (1,200 W) and maintaining these conditions for 15 min. This same digestion process was applied to 0.5000 g of the integral sediment (not subjected to the extraction steps) for determination of the pseudototal content. Determination of the element concentrations in each step of the BCR method and in pseudototal digestion was performed by ICP-MS. The internal standard (Rh 5 µg L-1) and collision cell (He > 99.999%) were used during the determinations to avoid interferences. The SRM 2704 reference material from the National Institute of Standards and Technology (NIST; Buffalo River Sediment) was submitted to the first three steps of the BCR extraction method. The recoverability capacity of the method was evaluated by the relationship between the sum of the content extracted in the three initial steps and the certified values. The accuracy and interference effects were evaluated using SRM 2704 reference material and addition-recovery experiments. Addition-recovery experiments were carried out using three concentration levels (10 µg kg-1, 25 µg kg-1 and 50 µg kg-1).35 For performing these procedures, sub-samples of a randomly selected sample (S11) were digested in triplicate with aqua regia in a microwave oven maintaining the same conditions described above and subsequently analyzed by ICP-MS. Limits of detection (LOD) were calculated as 3s divided by the slope of the calibration graph, for ten reagent blanks.18 The LOD values varied from 0.01 µg L-1 (Co) to 0.09 µg L-1 (Zn) (Table 3S). These detection limits are considered acceptable for general analysis in environmental studies,16,30 and are comparable to those obtained in previous work using similar material.19,35,36
RESULTS AND DISCUSSION
Sediment analysis
Physicochemical characterization
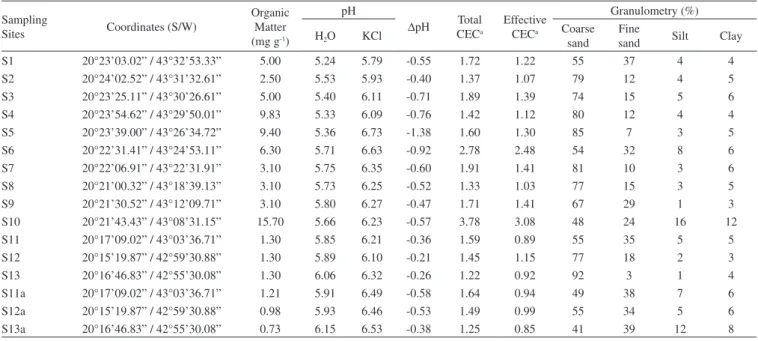
The physical-chemical characteristics of sediment samples are presented in Table 1. The results show the absolute predominance of sand, on average 91%, in relation to the silt (4%) and clay (5%) fractions. Another characteristic of the sediments are the negative
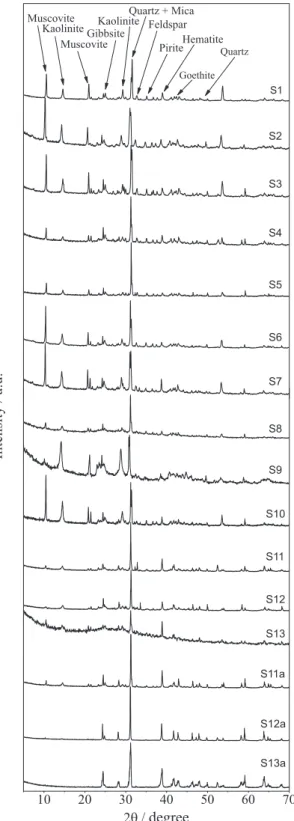
∆pH values, obtained by the difference between pH in KCl and pH in H2O, which indicate a prevalence of negative charges on its surface, allowing the adsorption of trace elements. In acidic conditions, the cationic metal ions (Cd2+, Co2+, Cr2+, Cu2+, Ni2+, Pb2+ and Zn2+) become more mobile,37 so that in areas with predominantly sandy texture under acidic conditions there is increased potential for leaching of the soluble forms of the metal compounds.38 The collected sediment samples (S1 to S13 and S11a to S13a) showed low Cation Exchange Capacity (CEC), which can be explained by the absolute prevalence of the sand fraction. However, the presence of secondary minerals such as kaolinite, gibbsite, goethite and hematite in the silt fraction, as shown in the X-ray diffraction patterns (Figure 2), gives the sediments a good trace element retention capacity.
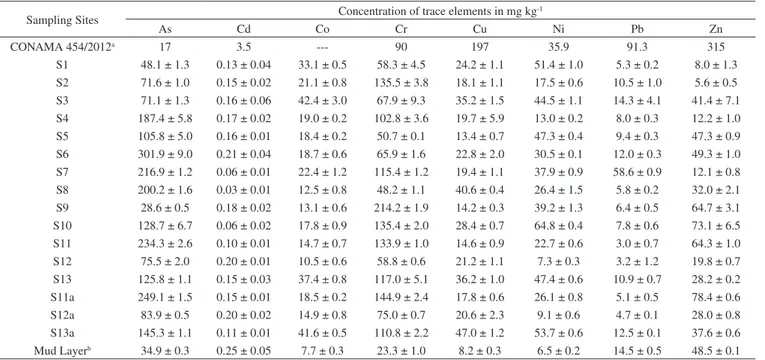
Total trace elements
The results indicate that these elements were already deposited in the bed of the Carmo River before the arrival of material from the tailings dam. The presence of arsenic may be related to the development of gold mining in the region for centuries, and although much of it is deactivated, there is still activity on the Carmo River. Furthermore, these sampling points are located along the Carmo River, which drains the cities of Ouro Preto and Mariana, and also drains the Passagem Mine (municipality of Mariana ) that is geologically rich in arsenic minerals.11
Segura et al.2 collected samples of tailings mud 23 days after rupture of the dam of Fundão (November 28, 2015), where it was determined that Fe (~20000 to 30000 mg kg-1) and Mn (~100 to 300 mg kg-1) were the main elements, and trace elements (Pb, As, Sr, Zn, Cu, Ni and Co) with concentrations in the slurry ranging from < 0.46 mg kg-1 to ~6.5 mg kg-1. During its flow through the river the mud was mixed with the bottom material (sediment), which contains high quantities of trace elements (Table 2), forming a mud layer. At collection points S11a to S13a, the tailings layer had a thickness of ~4 cm, however the thickness of the mud layer may vary according to water flow along the entire length of the river. Thus, the mud layer covering the entire length of the river bed had, due to sediment incorporation, presented increased concentration of trace elements, as shown in Table 2.
Fractionation
Figure 3 shows the results obtained for the fractionation of trace elements in the sediment samples collected from the Tripuí Creek (S1) and the Carmo River (S2 to S13). The relative proportions of As in the acid soluble fraction (F1) were generally low (< 10%). Concentrations of Cd (S1, S5, S6, S8-S13), Cu (S8), Pb (S9) and Zn (S1, S4) were > 10% in the F1 fraction. Extraction of trace elements in the F1 fraction (exchangeable and bound to carbonates) can be mainly attributed to its association with carbonates present in the sediments, due to the extensive alteration in carbonates in the ore deposits of this region.10 Metals present in the F1 fraction are considered to be more weakly bound to the sediments, being able to equilibrate with the aqueous phase and therefore become more readily available.36,40-43
In relation to the reducible fraction (F2), it can be observed that Ni, Co and Pb have a strong affinity with this fraction, which
is also potentially available. On average, 37.2% of Ni, 36.1% of Co and 30.5% of Pb were found in this fraction, ranges of 9.5-88%, 14.1-54.4% and 15.1-51.5%, respectively, between sampling points (S1 to S13). Secondary minerals in the silt fraction containing Fe and Al hydroxides (Figure 2) present large surface adsorption areas, increasing the retention of trace elements in this fraction.19,43 These adsorbed metals (linked to Fe-Mn oxides) have the potential to be transferred to the aquatic environment, by means of changes in the redox potential or pH of the medium.11,13,44,45
In the oxidizable fraction (F3), relatively high values are observed for Cr and Cu. On average, 29.5% of Cr and 25.0% of Cu were found in this fraction, ranging from 11.7-60.1% for Cr and 8.2-42.6% for Cu among the sampling points (S1 to S13). The metals (Cu and Cr) are strongly complexed by organic matter (humic substances) in the sediments, being released after degradation of organic matter or oxidation of sulphides to sulphates.17,19,45 Furthermore, Cu is commonly found to be strongly bound to organic matter, due to the high stability constant of organic copper compounds.28 The largest quantities of As found in the oxidizable fraction (F3) of the sediments at sampling sites S6 and S7 (Figure 3) may be related to contribution of the oxidative dissolution of arsenic-rich sulfide minerals from the Passagem Mine (municipality of Mariana ), the oldest and most important gold mine in the region located upstream of S6 and S7.10,11
The residual fraction (R) corresponds to As and metals occluded in non-silicated minerals extracted during the final step of the BCR method by means of digestion with aqua regia. The R fraction presented the highest levels of trace elements, except for Cd. In the residual fraction the following concentration intervals were obtained for As (70.5-97.2%), Zn (17.7-95%), Pb (37.2-93.1%), Cu (25.3-85.9%), Co (34.6-81.9%), Cr (28.6-78.0%) and Ni (17.6-77.5%) between sampling points (S1 to S13). The large quantity of these elements in this fraction shows that they are linked to the crystalline network of the secondary minerals and are not easily remobilized to the aquatic environment.13,19,28,45-47
Figure 3 also shows that there was a modification in the fractionation profile of trace elements (S11 to S13) after the Mariana environmental accident with deposition of the mud layer (S11a to S13a). Modification in the fractionation profile can be better observed in Table 3, where the average values between sampling points are presented for
Table 1. Characterization of the sediments collected along the Tripuí Creek and Carmo River
Sampling
Sites Coordinates (S/W)
Organic Matter (mg g-1)
pH
∆pH CECTotal a
Effective CECa
Granulometry (%) H2O KCl
Coarse sand
Fine
the concentration of each element in the different sediment fractions. Before the Mariana environmental accident, the average percentage of extracted metals in the available fractions (F1 + F2 + F3) of the sediments, for the last 3 sampling points (S11 to S13), presented a decreasing order of availability: Cd (65%) > Cu (54%) > Ni (53%) > Co (49%) > Cr (44%) > Pb (38%) > Zn (13%) > As (5%).
After the Mariana environmental accident, the average percentage of extracted metals in the available fractions followed the same decreasing order of availability, but there was an increase in the quantity of elements in these fractions: Cd (78%) > Cu (65%) > Ni (57%) > Co
(54%) > Cr (53%) > Pb (45%) > Zn (32%) > As (25%). The results show that deposition of the mud layer on the sediment caused a change in the availability of trace elements, making them more available. The sequential extraction procedure applied to the mud layer (Table 4) also showed large quantities of trace elements in available fractions, which justifies the increased availability of these elements in the aquatic environment after deposition of the mud layer on the sediment samples.
Pseudototal digestion of the sediment samples (Table 2) and the mud layer (Table 4) with aqua regia is used as a tool for internal evaluation of the recoverability of the method. The relationship between the sum of the quantities obtained from the sequential extraction (including the residual fraction) and the pseudototal content allowed for calculation of the recovery. The results showed acceptable recovery percentages for the BCR method, ranging from 84% to 106% for the sediment samples and from 83% to 97% for the mud layer. Application of this method to the SRM 2704 NIST reference material also showed satisfactory recoveries in relation to the certified values: As (95%), Cd (86%), Co (87%), Cr (83%), Cu (102%), Ni (108%), Pb (107%) and Zn (95%). Very good agreement was also achieved, with no significant differences between values at the 95% confidence level. Recoveries higher than 97% and less than 105% were obtained in the addition-recovery experiments carried out in the sample S11 using the three concentration levels (10 µg kg-1, 25 µg kg-1 and 50 µg kg-1). These values reflect the efficiency of the method, as well as the precision of the results, and are considered satisfactory given the complex nature of the sediment matrix.19,35,36
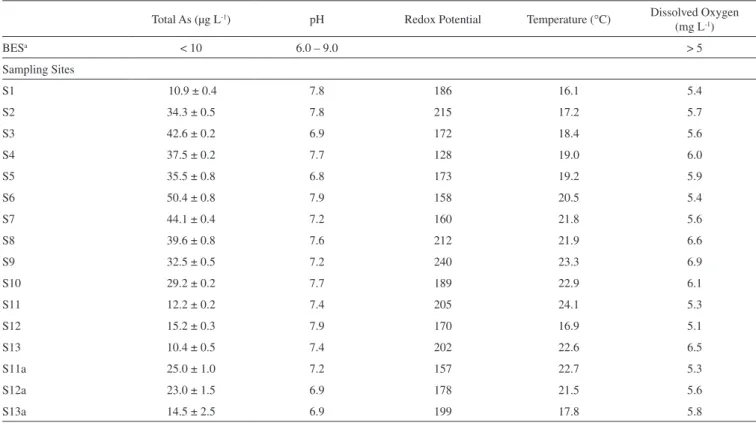
Water analysis
Table 5 shows the total As concentration and physical-chemical parameters of the water samples collected in the Tripuí Creek (S1) and the Carmo River before (S2-S13) and after (S11a-S13a) deposition of mud on the sediment. The accuracy of the results of the trace elements analysis in water samples were determined in a spiked of standard multielement solution. Spike recoveries ranged from 88 to 104%.
The in situ pH values obtained for the sampling points S1 to S13 and S11a to S13a ranged from 6.8 to 7.8. These results are within normal limits, i.e., do not violate the limits established in legislation (range 6 to 9), which are adequate values for the maintenance of aquatic life.48 It can also be observed that even after deposition of the mud layer (S11a to S13a), the pH values remained within a normal range. In relation to dissolved oxygen, all results were in compliance with the limit established by Brazilian environmental legislation (values greater than 5 mg L-1 O
2).48
All samples presented concentrations of As > 10 µg L-1, the maximum limit established by Brazilian environmental legislation48 for water destined for human consumption . The values of total As are in agreement with the range observed in other regions of the IQ10,11 and with those verified by previous studies on As concentrations in surface water samples of the Carmo River.11 The SEMAD-IGAM49 and the Company of Research on Mineral Resources50 performed a water analysis in November and December of 2015, shortly after the environmental accident, at a sampling point at the confluence of the Gualaxo do Norte River with the Carmo River, approximately corresponding to sampling point S11. We verified that the results of the present work are consistent with respect to trace elements, except for the difference found for As, which in our case was slightly greater than 10 µg L-1.
The difference found in the results for As may be due to the physico-chemical changes that occurred in water samples on the day of collection. However, after deposition of the mud layer on the Carmo River sediment, there was an increase in the total As concentration in water samples (S11a-S13a). As can be verified in the results from Figure 2. X-ray diffraction spectra from silt fraction of the sediments samples.
Figure 3. Fractionation of As, Cd, Co, Cr, Cu, Ni, Pb e Zn in sediments from the Tripuí Creek and Carmo River
Table 2. Trace elements in sediment sample from the Tripuí Creek and Carmo River (mean ± standard deviation, n=3)
Sampling Sites Concentration of trace elements in mg kg-1
As Cd Co Cr Cu Ni Pb Zn
CONAMA 454/2012a 17 3.5 --- 90 197 35.9 91.3 315
fractionation of trace elements (Figure 3), their quantities increased in the fractions available after deposition of the mud layer on the sediment samples. Thus, the trace elements present in the available fractions are more sensitive to variations in environmental conditions, and can be more easily remobilized into the aquatic environment. Moreover, the increase in acidity of the water causes dissolution
of carbonaceous structures present in the river beds, making the trace elements available to the water.10 The trace elements Cd, Co, Cr, Cu, Ni, Pb and Zn in some water samples (Table 6) collected after deposition of the mud layer also presented higher values than previously found (first collection), however they were lower than the limit established by Brazilian environmental legislation.48
Table 3. Results obtained for average concentrations of As, Cd, Co, Cr, Cu, Ni, Pb and Zn in each fraction, ∑ F1 + F2 + F3 + R and ∑ F1 + F2 + F3 for surface
sediments from the Tripuí Creek and Carmo River (mean ± standard deviation, n = 3) Step
∑ [F1 + F2 + F3 + R] (mg kg-1)
∑ [F1 + F2 + F3] (%) F1
(mg kg-1)
F2 (mg kg-1)
F3 (mg kg-1)
Residual (mg kg-1)
Asa 0.25 ± 0.34 3.7 ± 1.2 13.2 ± 9.7 124.2 ± 57.1 141.4 ± 57.9 12 ± 2 Asb 0.02 ± 0.01 3.8 ± 0.7 2.1 ± 1.0 148.9 ± 65.7 154.9 ± 55.1 5 ± 2 Asc 0.19 ± 0.02 7.1 ± 1.6 14.3 ± 3.2 131.2 ± 45.2 152.8 ± 35.8 14 ± 4 Cda 0.02 ± 0.02 0.04 ± 0.02 0.01 ± 0.01 0.03 ± 0.02 0.10 ± 0.04 70 ± 7 Cdb 0.02 ± 0.01 0.05 ± 0.01 0.03 ± 0.01 0.05 ± 0.01 0.15 ± 0.01 65 ± 9 Cdc 0.03 ± 0.01 0.03 ± 0.01 0.06 ± 0.03 0.04 ± 0.01 0.16 ± 0.03 72 ± 8 Coa 0.30 ± 0.26 6.9 ± 1.4 1.7 ± 0.9 12.6 ± 6.4 21.5 ± 6.6 41 ± 3 Cob 0.09 ± 0.26 7.7 ± 2.5 0.77 ± 0.07 12.1 ± 8.6 28.8 ± 4.8 47 ± 9
Coc 3.8 ± 2.7 7.7 ± 3.9 1.7 ± 0.8 11.8 ± 4.7 25.0 ± 3.9 51 ± 9
Cra 0.85 ± 0.21 19.7 ± 1.5 26.5 ± 13.1 53.1 ± 24.5 100.2 ± 27.8 47 ± 12 Crb 0.51 ± 0.34 21.8 ± 12.1 20.7 ± 4.7 60.3 ± 29.0 103.2 ± 17.2 46 ± 16 Crc 6.8 ± 4.7 5.5 ± 2.5 39.0 ± 4.6 59.0 ± 24.4 110.3 ± 7.7 48 ± 8 Cua 0.96 ± 0.36 4.1 ± 2.7 5.7 ± 2.4 19.6 ± 4.5 30.3 ± 5.8 35 ± 6 Cub 0.73 ± 0.12 4.3 ± 2.0 7.1 ± 0.7 11.9 ± 5.6 24.0 ± 4.5 54 ± 13
Cuc 3.8 ± 2.0 6.3 ± 3.2 8.9 ± 1.3 9.5 ± 4.2 28.5 ± 2.1 69 ± 11
Nia 0.38 ± 0.20 12.4 ± 7.7 4.1 ± 2.2 17.1 ± 9.3 34.0 ± 12.2 50 ± 8 Nib 0.21 ± 0.01 6.6 ± 4.9 5.1 ± 3.2 13.9 ± 6.6 25.8 ± 3.8 51 ± 14 Nic 2.2 ± 1.1 6.8 ± 2.8 5.9 ± 2.7 14.6 ± 10.4 29.6 ± 3.2 55 ± 11 Pba 0.47 ± 0.28 4.1 ± 1.8 0.58 ± 0.24 6.7 ± 4.1 11.8 ± 4.5 44 ± 5 Pbb 0.12 ± 0.07 1.3 ± 0.3 0.33 ± 0.04 4.1 ± 3.3 5.8 ± 1.3 38 ± 13 Pbc 0.60 ± 0.05 1.6 ± 0.8 1.1 ± 0.3 4.8 ± 3.2 8.1 ± 1.4 45 ± 10 Zna 1.4 ± 0.7 3.0 ± 1.7 2.2 ± 0.7 28.0 ± 19.1 34.6 ± 19.2 19 ± 3 Znb 0.59 ± 0.10 1.9 ± 0.9 1.5 ± 0.1 33.5 ± 18.4 37.5 ± 12.1 13 ± 6 Znc 3.9 ± 0.8 3.7 ± 1.0 6.3 ± 3.4 34.1 ± 11.3 48.1 ± 16.1 29 ± 7
aMean of the 13 points (S1 to S13); bAverage of the last 3 points (S11 to S13); cAverage of the last 3 points after the Mariana environmental accident (S11a to S13a).
Table 4. As, Cd, Co, Cr, Cu, Ni, Pb and Zn in each fraction, ∑ F1 + F2 + F3 + R and ∑ F1 + F2 + F3 for the Mud Layer (mean ± standard deviation, n = 3)
Mud Layer Steps
∑ [F1 + F2 + F3 + R] (mg kg-1)
∑ [F1 + F2 + F3] (%) F1
(mg kg-1)
F2 (mg kg-1)
F3 (mg kg-1)
Residual (mg kg-1)
As 0.05 ± 0.01 5.5 ± 0.2 9.2 ± 0.3 19.1 ± 0.6 33.9 ± 1.3 44 ± 7
Cd 0.03 ± 0.01 0.03 ± 0.02 0.05 ± 0.01 0.10 ± 0.03 0.21 ± 0.04 53 ± 10
Co 0.7 ± 0.2 5.2 ± 0.9 0.24 ± 0.05 1.8 ± 0.1 8.0 ± 0.8 77 ± 10
Cr 1.2 ± 0.2 2.3 ± 0.8 3.4 ± 0.1 15.4 ± 0.3 22.3 ± 1.3 31 ± 12
Cu 1.8 ± 0.1 1.4 ± 0.2 1.4 ± 0.1 3.3 ± 0.2 7.9 ± 0.4 58 ± 6
Ni 0.46 ± 0.08 0.30 ± 0.03 1.1 ± 0.3 4.0 ± 0.4 5.9 ± 0.8 32 ± 9
Pb 2.0 ± 0.4 1.5 ± 0.1 2.2 ± 0.4 8.3 ± 0.3 14.1 ± 0.9 41 ± 7
Although the quantity of As in the water samples from the first collection was already above the maximum limit recommended by the local regulatory agency, after deposition of the mud layer there was an increase in its concentration, increasing the risk to the local
population. Among the possible water contaminants, arsenic is one of the most problematic, being considered by the World Health Organization (WHO) as one of the most important with regards to global public health.51 Consumption of water containing arsenic can
Table 5. Total As level and physical–chemical parameters related to water quality
Total As (µg L-1) pH Redox Potential Temperature (°C) Dissolved Oxygen (mg L-1)
BESa < 10 6.0 – 9.0 > 5
Sampling Sites
S1 10.9 ± 0.4 7.8 186 16.1 5.4
S2 34.3 ± 0.5 7.8 215 17.2 5.7
S3 42.6 ± 0.2 6.9 172 18.4 5.6
S4 37.5 ± 0.2 7.7 128 19.0 6.0
S5 35.5 ± 0.8 6.8 173 19.2 5.9
S6 50.4 ± 0.8 7.9 158 20.5 5.4
S7 44.1 ± 0.4 7.2 160 21.8 5.6
S8 39.6 ± 0.8 7.6 212 21.9 6.6
S9 32.5 ± 0.5 7.2 240 23.3 6.9
S10 29.2 ± 0.2 7.7 189 22.9 6.1
S11 12.2 ± 0.2 7.4 205 24.1 5.3
S12 15.2 ± 0.3 7.9 170 16.9 5.1
S13 10.4 ± 0.5 7.4 202 22.6 6.5
S11a 25.0 ± 1.0 7.2 157 22.7 5.3
S12a 23.0 ± 1.5 6.9 178 21.5 5.6
S13a 14.5 ± 2.5 6.9 199 17.8 5.8
a Values established by Brazilian environmental standards (BES) for water destined for human consumption (CONAMA 2005).
Table 6. Total metals level in samples of water
Concentration in µg L-1
Cd Co Cr Cub Ni Pb Zn
BESa 1 --- 50 9 25 30 180
Sampling sites
cause dermatitis, skin cancer, neurological disorders, hepatomegaly, cardiac problems, internal cancers and poisoning.52,53
CONCLUSIONS
The present study evaluated the total contents of trace elements in the water and their partitions in the sediment of samples collected in the Tripuí Creek and the Carmo River, in the Iron Quadrangle of southeast Brazil. The ~22 km stretch of the Carmo River was contaminated with tailings mud from the rupture of the Fundão dam. In the present study we collected samples in this stretch of the Carmo River six months before the environmental accident. Thus, for the purpose of comparison a new collection was performed six months after the mud deposition, which allowed for verifying changes in the total amount of trace elements in the water and their partitions in the sediment.
The results showed that the total As concentration in the water ranged from 10.4 to 50.4 µg L-1 for the Carmo River, exceeding the maximum limit (> 10 µg L-1) defined by Brazilian environmental regulations. Based on the water analysis, the Cd, Cr, Ni, Pb and Zn concentrations studied were below the maximum limits defined by Brazilian standards.
The ~22 km stretch of the Carmo River which received the tailings mud corresponded to the last three sampling points, where the total As concentrations in the water were 12.2, 15.2 and 10.4 µg L-1 and 25.0, 23.0 and 14.5 µg L-1 in the absence and presence of the tailings mud, respectively. Thus it was verified that the mud can potentiate the mobilization of trace elements from the sediment to the water.
Sediment analyses showed that the highest portion of trace elements extracted was associated with the residual fraction. However, considerable quantities were extracted as easily remobilized fractions, indicating potential for remobilization of these elements from the sediment to the aquatic environment. The mobility was in the order Cd > Cu > Ni > Co > Cr > Pb > Zn > As, with the elements Cd, Cu and Ni being preferentially associated with the most labile fractions. After deposition of the tailing mud layer on the sediments, the average percentage of extracted metals in the available fractions followed the same decreasing order of availability, but there was an increase in the amount of As (20%), Cd (13%), Co (5%), Cr (9%), Cu (11%), Ni (4%), Pb (7%) and Zn (19%) in the easily remobilized fractions. Therefore, the increase in the amount of trace elements in the easily remobilized fractions, which is a potential human health risk, should not be ignored because the waterways of this region are destined for human consumption.
SUPPLEMENTARY INFORMATION
Supplementary data (Table 1S, Table 2S and Table 3S) are available free of charge at http://quimicanova.sbq.org.br as PDF file.
ACKNOWLEDGEMENT
The authors acknowledge the financial support of the Fundação de Amparo à Pesquisa do Estado de Minas Gerais (FAPEMIG, Universal Demand, process No. APQ-00445-14) and the Conselho Nacional de Desenvolvimento Científico e Tecnológico (CNPq) and CAPES.
REFERENCES
1. Marta-Almeida, M.; Mendes, R.; Amorim, F. N.; Cirano, M.; Dias, J. M.; Mar. Pollut. Bull.2016, 112, 359.
2. Segura, F. R.; Nunes, E. A.; Paniz, F. P.; Paulelli, A. C. C.; Rodrigues, G. B.; Braga, G. Ú. L.; dos Reis Pedreira Filho, W.; Barbosa, F.; Cerchiaro, G.; Silva, F. F.; Batista, B. L.; Environ. Pollut.2016, 218, 813.
3. Carmo, F. F. do; Kamino, L. H. Y.; Junior, R. T.; Campos, I. C. de; Carmo, F. F. do; Silvino, G.; Castro, K. J. da S. X. de; Mauro, M. L.; Rodrigues, N. U. A.; Miranda, M. P. de S.; Pinto, C. E. F.; Perspect. Ecol. Conserv.2017.
4. IBAMA - Instituto Brasileiro do Meio Ambiente e dos Recursos Naturais Renovaveis, Ministerio do Meio Ambiente. Diretoria de Protecao Ambiental - DIPRO e Coordenacao Geral de Emergencias Ambientais - CGEMA. Laudo Técnico Preliminar: Impactos ambientais decorrentes do desastre envolvendo o rompimento da barragem de Fundão, em Mariana, Minas Gerais, Novembro de 2015, p. 38. Available in http://www.ibama.gov.br/phocadownload/noticias_ ambientais/laudo_tecnico_preliminar.pdf., 2015.
5. Garcia, L. C.; Ribeiro, D. B.; De Oliveira Roque, F.; Ochoa-Quintero, J. M.; Laurance, W. F.; Ecol. Appl.2017, 27, 5.
6. Borba, R. P.; Figueiredo, B. R.; Rawlins, B.; Matschullat, J.; Rev. Bras. Geociências2000, 30, 558.
7. Mello, J. W. V; Roy, W. R. *.; Talbott, J. L.; Stucki, J. W.; J. Soils Sediments2006, 6, 9.
8. Borba, R. P.; Figueiredo, B. R.; Rev. Bras. Geocienc.2004, 34, 489. 9. Matschullat, J.; Perobelli Borba, R.; Deschamps, E.; Figueiredo, B. R.;
Gabrio, T.; Schwenk, M.; Appl. Geochem.2000, 15, 181.
10. Borba, R. P.; Figueiredo, B. R.; Matschullat, J.; Environ. Geol.2003, 44, 39.
11. Varejão, E. V. V; Bellato, C. R.; Fontes, M. P. F.; Mello, J. W. V.; Environ. Monit. Assess.2011, 172, 631.
12. Devesa-rey, R.; Díaz-fierros, F.; Barral, M. T.; J. Environ. Manage.2010, 91, 2471.
13. Alonso Castillo, M. L.; Vereda Alonso, E.; Siles Cordero, M. T.; Cano Pavón, J. M.; García de Torres, A.; Microchem. J.2011, 98, 234. 14. Ianni, C.; Magi, E.; Soggia, F.; Rivaro, P.; Frache, R.; Microchem. J.
2010, 96, 203.
15. Sundaray, S. K.; Nayak, B. B.; Lin, S.; Bhatta, D.; J. Hazard. Mater.
2011, 186, 1837.
16. Mihajlovic, J.; Stärk, H.-J.; Rinklebe, J.; Geoderma2014, 228-229, 160. 17. Nemati, K.; Bakar, N. K. A.; Abas, M. R.; Sobhanzadeh, E.; J. Hazard.
Mater.2011, 192, 402.
18. Yıldırım, G.; Tokalıoğlu, S.; Ecotoxicol. Environ. Saf.2016, 124, 369. 19. Passos, E. de A.; Alves, J. C.; dos Santos, I. S.; Alves, J. do P. H.; Garcia,
C. A. B.; Spinola Costa, A. C.; Microchem. J.2010, 96, 50.
20. Sungur, A.; Soylak, M.; Ozcan, H.; Chem. Speciation Bioavailability
2014, 26, 219.
21. Ahumada, I.; Marican, A.; Retamal, M.; Pedraza, C.; Ascar, L.; Carrasco, A.; Richter, P.; J. Braz. Chem. Soc.2010, 21, 721.
22. Nemati, K.; Kartini, N.; Bakar, A.; Sobhanzadeh, E.; Abas, M. R.; Microchem. J.2009, 92, 165.
23. Abollino, O.; Malandrino, M.; Giacomino, A.; Mentasti, E.; Anal. Chim. Acta2011, 688, 104.
24. Sungur, A.; Soylak, M.; Yilmaz, S.; Özcan, H.; Environ. Earth Sci.2014, 72, 3293.
25. Tessier, A.; Campbell, P. G. C.; Bisson, M.; Anal. Chem.1979, 51, 844.
26. Rauret, G.; López-Sánchez, J. F.; Sahuquillo, A.; Rubio, R.; Davidson, C.; Ure, A.; Quevauviller, P.; J. Environ. Monit.1999, 1, 57.
27. Ure, A. M.; Quevauviller, P.; Muntau, H.; Griepink, B.; Int. J. Environ. Anal. Chem.1993, 51, 135.
28. Ma, X.; Zuo, H.; Tian, M.; Zhang, L.; Meng, J.; Zhou, X.; Chemosphere
2016, 144, 264.
29. Prohic, E.; Kniewald, G.; Mar. Chem.1987, 22, 279.
30. Zemberyová, M.; Barteková, J.; Hagarová, I.; Talanta2006, 70, 973. 31. Donagema, G. K.; Campos, D. V. B. de; Calderano, S. B.; Teixeira, W.
G.; Viana, J. H. M.; Manual de Métodos de Análise de Solo, 2nd ed., Embrapa Solos: Rio de Janeiro, 2011.
33. Yeomans, J. C.; Bremner, J. M.; Commun. Soil Sci. Plant Anal. 1988, 19, 1467.
34. Ruiz, H. A.; Rev. Bras. Cienc. Solo 2005, 29, 297.
35. Junior, R. a M.; Mimura, A. M. S.; Divino, A. C.; Silva, R. F.; Silva, J. C. J.; Ciminelli, V. S. T.; Soil Sediment Contam.2014, 23, 257. 36. Passos, E. D. A.; Alves, J. D. P. H.; Garcia, C. A. B.; Costa, A. C. S.; J.
Braz. Chem. Soc.2011, 22, 828.
37. Rieuwerts, J. S.; Ashmore, M. R.; Farago, M. E.; Thornton, I.; Sci. Total Environ. 2006, 366, 864.
38. Fernandez, R. O.; Giraldez Cervera, J. V.; Vanderlinden, K.; Carbonell Bojollo, R.; Gonzalez Fernandez, P.; Water. Air. Soil Pollut. 2007, 178, 229.
39. CONAMA – Conselho Nacional do Meio Ambiente. Resolução No. 454. Brasil: Ministerio do Desenvolvimento Urbano e Meio Ambiente, Brasilia, 2012.
40. Guillén, M. T.; Delgado, J.; Albanese, S.; Nieto, J. M.; Lima, A.; De Vivo, B.; J. Geochem. Explor.2012, 119–120, 32.
41. Yang, Y.; Chen, F.; Zhang, L.; Liu, J.; Wu, S.; Kang, M.; Mar. Pollut. Bull.2012, 64, 1947.
42. Kartal, Ş.; Aydin, Z.; Tokalioǧlu, Ş.; J. Hazard. Mater.2006, 132, 80. 43. Zhuang, W.; Liu, Y.; Chen, Q.; Wang, Q.; Zhou, F.; Ecol. Indic.2016,
69, 252.
44. Wali, A.; Colinet, G.; Ksibi, M.; Environ. Res. Eng. Manag.2015, 70, 14.
45. Botsou, F.; Sungur, A.; Kelepertzis, E.; Soylak, M.; Ecotoxicol. Environ. Saf.2016, 132, 101.
46. Li, Y.; Cai, X.; Guo, J.; Zhou, S.; Na, P.; Appl. Surf. Sci.2015, 324, 179. 47. Liu, H.; Li, L.; Yin, C.; Shan, B.; J. Environ. Sci. (China)2008, 20, 390. 48. CONAMA – Conselho Nacional do Meio Ambiente. Resolução No.
357. Brasil: Ministério do Desenvolvimento Urbano e Meio Ambiente, Brasília., 2005.
49. SEMAD-IGAM – Sistema Estadual de Meio Ambiente - Instituto Mineiro de Gestão das Águas Governo do Estado de Minas
Gerais. MONITORAMENTO DA QUALIDADE DAS AGUAS
SUPERFICIAIS DO RIO DOCE NO ESTADO DE MINAS GERAIS, RELATORIO TECNICO Acompanhamento da Qualidade das Aguas do Rio Doce Apos o Rompimento da Barragem da Samarco no distrito de Bento Rodrigues - Mariana/MG. 01 DE FEVEREIRO DE 2016, p. 75. Available in http://www.igam.mg.gov.br/component/content/ article/16/1632-monitoramento-da-qualidade-das-aguas-superficiais-do-rio-doce-no-estadode minas-gerais, 2015.
50. CPRM. Servico Geologico do Brasil, 2015. MONITORAMENTO ESPECIAL DO RIO DOCE: RELATORIO 02 Geoquimica. Segunda Campanha de Campo 12 a 23 de novembro de 2015. Belo Horizonte - MG, Brasil. http://www.cprm.gov.br/ publique/media/RT_02_2015_ MONIT_ESP_BACIA_RIO_DOCE_v4_5.pdf, 2015.
51. Guidelines for drinking-water quality, 3rd ed., World Health Organization: Geneva,2004.
52. Marques Neto, J. O.; Bellato, C. R.; Milagres, J. L.; Pessoa, K. D.; De Alvarenga, E. S.; J. Braz. Chem. Soc.2013, 24, 121.
53. Shevade, S.; Ford, R. G.; Water Res. 2004, 38, 3197.

![Table 4. As, Cd, Co, Cr, Cu, Ni, Pb and Zn in each fraction, ∑ F1 + F2 + F3 + R and ∑ F1 + F2 + F3 for the Mud Layer (mean ± standard deviation, n = 3) Mud Layer Steps ∑ [F1 + F2 + F3 + R] (mg kg -1 ) ∑ [F1 + F2 + F3] F1 (%) (mg kg -1 ) F2 (mg kg -1 ) F3](https://thumb-eu.123doks.com/thumbv2/123dok_br/16166487.707373/7.892.91.840.760.1011/table-fraction-mud-layer-standard-deviation-layer-steps.webp)