Submitted9 February 2016
Accepted 2 May 2016
Published2 June 2016
Corresponding author
Adilson Marques, amarques@fmh.ulisboa.pt, adncmpt@gmail.com
Academic editor
Nora Nock
Additional Information and Declarations can be found on page 11
DOI10.7717/peerj.2066
Copyright
2016 Marques et al.
Distributed under
Creative Commons CC-BY 4.0
OPEN ACCESS
European adults’ physical activity
socio-demographic correlates: a cross-sectional
study from the European Social Survey
Adilson Marques1,2, João Martins3,4, Miguel Peralta5, Ricardo Catunda6andLuís Saboga Nunes2
1Centro Interdisciplinar de Estudo da Performance Humana, Faculdade de Motricidade Humana,
Universidade de Lisboa, Lisboa, Portugal
2Centro de Investigação em Saúde Pública, Escola Nacional de Saúde Pública, Universidade Nova de Lisboa,
Lisboa, Portugal
3Laboratório de Pedagogia, Faculdade de Motricidade Humana, Universidade de Lisboa, Cruz Quebrada,
Portugal
4UIDEF, Instituto de Educação, Universidade de Lisboa, Lisboa, Portugal
5Faculdade de Motricidade Humana, Universidade de Lisboa, Cruz Quebrada, Portugal 6Centro de Ciências da Saúde, Universidade Estadual do Ceará, Fortaleza, Brazil
ABSTRACT
Background.From a public health perspective, the study of socio-demographic factors
related to physical activity is important in order to identify subgroups for intervention programs.
Objective.This study aimed to identify the prevalence of, and the socio-demographic
correlates related to, the achievement of recommended physical activity levels.
Methods.Using data from the European Social Survey round 6, physical activity and
socio-demographic characteristics were collected, in 2012, from 39,278 European adults (18,272 men, 21,006 women), aged 18–65 years, from 28 countries. The question of meeting physical activity guidelines was assessed using World Health Organization criteria.
Results. A total of 64.50% (63.36% men, 66.49% women) attained physical activity
recommended levels. The likelihood of attaining physical activity recommendations was higher in the 55–64 years age group (men: OR=1.22, p<0.05; women: OR=
1.66,p<0.001), among those who had secondary education (men: OR=1.28,p<0.01;
women: OR=1.26,p<0.05), among those who lived in rural areas (men: OR=1.20,
p<0.001; women: OR=1.10,p<0.05), and among those who had three or more
people living at home (men: OR=1.40,p<0.001; women: OR=1.43,p<0.001). On
the other hand, attaining physical activity recommendations was negatively associated with being unemployed (men: OR=0.70, p<0.001; women: OR=0.87,p<0.05),
being a student (OR=0.56,p<0.001; women: OR=0.64,p<0.01), being a retired
person (men: OR=0.86,p<0.05) and with having a higher household income (OR =0.80,p<0.001; women: OR=0.81,p<0.01).
Conclusions.This research helped clarify that, as the promotion of physical activity is critical to sustain health and prevent disease, socio-demographic factors are important to consider when planning the increase of physical activity.
SubjectsEpidemiology, Public Health
INTRODUCTION
The health benefits of physical activity (PA) are well established (Hardman & Stensel, 2009). Nonetheless, approximately one third of adults worldwide do not exercise enough to benefit their health (European Commission,2014;Hallal et al.,2012). Studies based on self-reported PA in Australia (Rosenberg et al.,2010), Canada (Bryan & Katzmarzyk,2009), the United States of America (Tucker, Welk & Beyler,2011), and in Europe (Gerovasili et al.,2015;Marques et al.,2015) have shown that about 40% of the adults are considered not physically active.
Due to the evidence of PA health benefits, and the high prevalence of inactivity, national and international agencies have produced consensus statements on the central role of promoting PA in the adult population as part of an effort to reduce premature mortality and morbidity associated with chronic diseases (European Union,2008;USDHHS,2008; WHO,2010). The European Union, the United States Department of Health and Human Services, and the Word Health Organization are among the many agencies which have recommended that all healthy adults should participate in at least 30 min of moderate-intensity aerobic activity, at least five days per week, to promote health (European Union, 2008;USDHHS,2008;WHO,2010). These recommendations emphasize the benefits of moderate intensity, and provide an innovative aspect related to the accumulation of PA throughout the day.
For effective public health surveillance and interventions, it is important to determine not only the proportion of people who participate in PA, but also to understand the factors related to the practice of PA of those who meet the PA recommended level. A better understanding of the contributing factors related to PA participation is critical to designing policies and effective interventions because it allows researchers to pay attention to modifying factors. To help identify subgroups for intervention programs, one must study the prevalence of, and socio-demographic factors related to, PA as it pertains to: sex, age, education level, living location, partnership status, the presence or absence of children in the home, household number, citizenship, and household income (Bauman et al.,2012; Belanger, Townsend & Foster,2011;Kamphuis et al.,2009;Marques et al.,2014). Exploring the socio-demographic correlates of PA could help to understand the participation factors. Knowing the factors associated with PA would enable to identify disadvantaged groups and tailor interventions that would target populations with the identified characteristics. Therefore, this study aimed to identify the socio-demographic correlates related with PA recommended levels.
METHODS
Study design and participants
The European Social Survey is an academically driven cross-national survey that has been conducted every two years across Europe since 2001. The survey measures the attitudes, beliefs and behaviour of European people.
Probability sampling from all residents aged 15 years and older was applied in all countries, comprising 54,673 participants. Sample were representative of all persons aged 15 and over resident within private households in each country. Individuals were selected by strict random probability methods. In all countries there was a minimum effective achieved sample size of 1,500 or 800 in countries with populations of less than 2 million. For the present study, only adults were selected since the PA recommendations for youth and older people are different from adults. Thus, participants younger than 18 years of age (n=2,000) and older than 65 years of age (n=10,779) were excluded from the sample. Since Israel is not a European country, its citizens were excluded (n=2,508). Finally, those who did not report at least four socio-demographic characteristics were also excluded (n=108).
These restrictions resulted in a final sample size of 39,278 participants (18,272 men, 21,006 women) with mean age 41.85±13.62 (men, 41.58±13.49; women, 42.09±13.25).
Measures
Physical activity
Information on PA was assessed with a single item asking, ‘‘On how many of the last seven days did you walk quickly, do sports, or other PA for 30 min or longer?’’ Although PA was assessed with a single item, there is evidence that in studies where PA is not the primary focus, and more detailed measures are not feasible, a single question is an acceptable alternative (Wanner et al.,2014). Using the World Health Organization (WHO, 2010) criteria, participants were classified as having attained the recommended level of PA (≥30 min of at least moderate PA on five or more occasions per week), or not having
attained the PA recommended levels (<30 min of at least moderate PA on five or more occasions per week).
Socio-demographic characteristics
a new category: urban areas. Those who indicated that they lived in a country village, or in a home in the countryside, were grouped into a category called, ‘‘rural areas.’’ Respondents were asked to describe whether they live with or without a husband/wife/partner, and the legal situation. Response options were dichotomized into live with or without a partner. Participants answered if they lived with or without children at home, and then the number of people living regularly as a member of the household. In each country, participants were asked whether they were national citizens or immigrants. Household income was determined based on decile calculated in each country separately. Using this data, 1st to 3rd decile, 4th to 7th decile, and 8th to 10th were organized to create three groups.
Procedures
The European Social Survey is an open database for free access. We obtained access through the following link:http://www.europeansocialsurvey.org/data/download.html?r=6.
The European Social Survey uses a multi-stage probability cluster sampling design to provide national representative samples. According to national options, participants were sampled by means of postal code address files, population registers, social security register data, or telephone books. In the sampling procedure, statistical precision was kept the same for all countries, notwithstanding the difference in method used for a specific country. In each country, information was collected using a questionnaire (European Social Survey, 2012) completed through an hour-long face-to-face interview that included questions on the use of medicine, immigration, citizenship, socio-demographic and socioeconomic issues, health perception, and PA. Appropriate ethical consent, from ethical committees were gained in each participating country.
Statistical analysis
Descriptive statistics were calculated for all variables (means, standard deviation, and percentages). Mann–Whitney test and Chi-square test were used to compare men and women according to socio-demographic characteristics and PA. ANOVA, followed by Tukey’s HSD test; Studentt-test were performed to assess socio-demographic variables for the number of times participants engaged in PA in the last 7 days. Bivariate relationships between PA (not attaining the PA recommended level vs. attaining the PA recommended level) and socio-demographic variables were tested by Chi-square test and Fisher’s exact test. To analyse the effects that socio-demographic variables had on attaining PA recommended levels, a binary logistic regression analysis was conducted. The binary logistic regression was adjusted for country and age. All analyses were stratified by sex, and statistical analysis was performed using IBM SPSS Statistics 22. The significance level was set atp<0.05.
RESULTS
The general samples’ characteristics are presented in Table 1. On average, men had participated 4.92 times per week in PA in the last seven days, while women had participated 5.06 per week (t(39,276)= −6.036, p<0.001). Significantly less men (63.36%) than
women (65.49%) attained the PA recommended levels (χ2(1)=19.379,p<0.001).
Table 1 Participants’ socio-demographic characteristics.
Total (n=39,278) Men (n=18,272) Women (n=21,006) p
n(%) n(%) n(%)
Agea 0.011
18–24 5,445 (13.86) 2,667 (14.60) 2,778 (13.22)
25–34 7,293 (18.57) 3,415 (18.69) 3,879 (18.46)
35–44 8,631 (21.97) 3,934 (21.53) 4,697 (22.36)
45–54 9,321 (23.73) 4,306 (23.57) 5,015 (23.87)
55–64 8,588 (21.86) 3,950 (21.62) 4,638 (22.08)
Education levelb <0.001
Primary 2,193 (5.61) 940 (5.17) 1,253 (5.99)
Secondary 27,467 (70.28) 13,279 (73.10) 14,188 (67.83)
Tertiary 9,425 (24.11) 3,948 (21.73) 5,477 (26.18)
Occupationb <0.001
Employed 24,253 (69.55) 12,371 (81.32) 11,882 (67.81)
Unemployed 4,233 (12.11) 2,074 (11.96) 2,159 (12.32)
Students 3,552 (10.19) 1,702 (9.81) 1,852 (10.57)
Retired 2,829 (8.11) 1,199 (6.91) 1,631 (9.31)
Living placeb 0.007
Urban area 12,967 (33.09) 5,969 (32.74) 6,999 (33.40)
Town or small city 11,885 (30.33) 5,447 (29.87) 6,439 (30.73)
Rural areas 14,331 (36.57) 6,817 (37.39) 7,515 (35.87)
Partnership statusb 0.340
Live without partner 13,754 (35.15) 6,357 (34.91) 7,397 (35.37)
Live with partner 25,372 (64.85) 11,855 (65.09) 13,518 (64.63)
Children living at homeb <0.001
No 19,643 (49.99) 10,094 (55.25) 9,549 (45.46)
Yes 19,633 (51.01) 8,177 (44.75) 11,456 (54.54)
Members of householdb <0.001
1 person 4,135 (10.53) 2,135 (11.68) 2,000 (9.52)
2 people 10,205 (25.98) 4,607 (25.22) 5,598 (26.65)
3–4 people 18,661 (47.51) 8,791 (48.11) 9,870 (46.99)
≥5 people 6,277 (15.98) 2,739 (14.99) 3,538 (16.84)
Citizenship statusb 0.090
National 37,482 (95.49) 17,399 (95.30) 20,082 (95.66)
Immigrant 1,770 (4.51) 858 (4.70) 912 (4.34)
Household incomeb <0.001
1st to 3rd decile 8,613 (27.19) 3,757 (25.24) 4,855 (28.92)
4th to 7th decile 13,215 (41.72) 6,139 (41.23) 7,077 (42.16)
8th to 10th decile 9,847 (31.09) 4,993 (33.53) 4,854 (28.92)
PA in the last 7 days (≥30 min/day)a <0.001
None 2,586 (6.58) 1,152 (6.31) 1,434 (6.83)
1 day 1,674 (4.26) 865 (4.74) 809 (3.85)
Table 1(continued)
Total (n=39,278) Men (n=18,272) Women (n=21,006) p
n(%) n(%) n(%)
2 days 2,867 (7.30) 1,402 (7.67) 1,464 (6.97)
3 days 3,686 (9.38) 1,777 (9.72) 1,906 (9.07)
4 days 3,134 (7.98) 1,497 (8.19) 1,636 (7.79)
5 days 4,512 (11.48) 2,298 (12.58) 2,211 (10.53)
6 days 3,089 (7.86) 1,530 (8.37) 1,559 (7.42)
7 days 17,743 (45.16) 7,750 (42.42) 9,988 (47.55)
PA recommendationsb <0.001
Not attaining PA recommended level 13,942 (35.50) 6,694 (36.64) 7,248 (34.51)
Attaining PA recommended level 25,336 (64.50) 11,578 (63.36) 13,758 (65.49)
Notes.
PA, physical activity.
Attaining physical activity recommended level means≥30 min of at least moderate physical activity, five or more times per week. Not attaining physical activity recommended levels means <30 min of at least moderate physical activity, five or more times per week.
aTested by Mann–Whitney test. bTested by Chi-square.
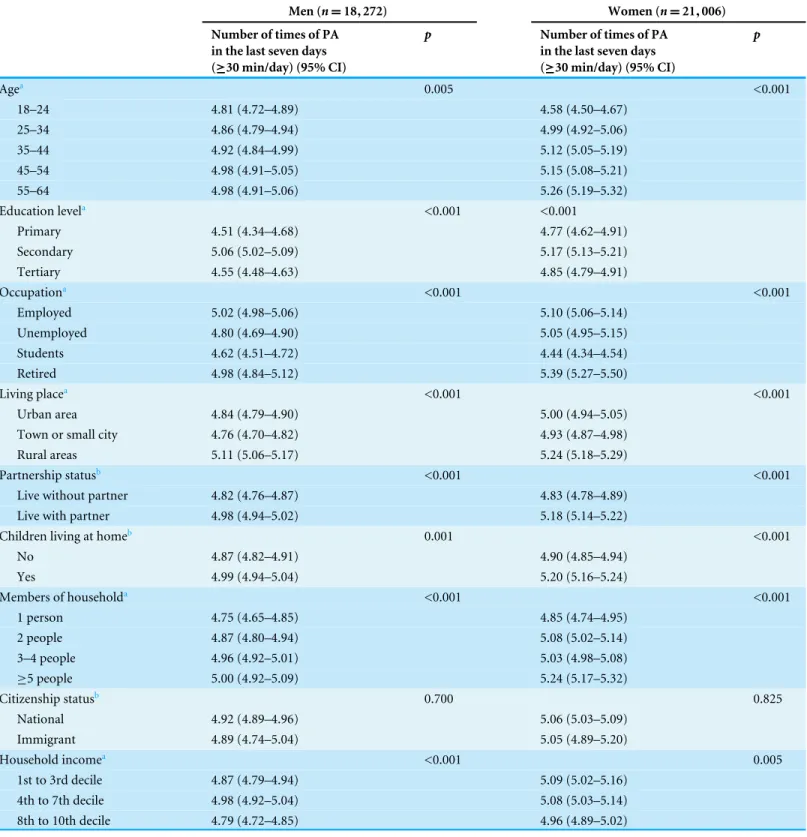
age (Table 2). Those with secondary education engaged more frequently in PA than those with primary and tertiary education (men: F(2,18,163)=934.613,p<0.001; women:
(F(2,20,915)=506.854,p<0.001). Employed men (F(3,17,344)=19.696,p<0.001)
and retired women (F(3,17,522)=58.473,p<0.001) practiced PA more often than others
with a different occupation. Men and women from rural areas were more physically active (men: F(2,18,228)=433.770, p<0.001; women:F(2,20,948)=376.616, p<0.001).
Similarly, those who lived with a partner (men:t(18,210)=4.510, p<0.001; women:
t(20,913)=10.410,p<0.001), had children (men:t(18,269)=3.452,p=0.001; women:
t(21,004)=9.387,p<0.001), and lived with more people at home (men:F(3,18,267) =108.164, p<0.001; women:F(3,21,002)=221.176,p<0.001), engaged significantly
more times in PA than individuals who lived without any partner, had no children and had less members in the household. Men with an income between decile 4th and 7th (F(2,14,886)=104.335,p<0.001), and women with 1st to 3rd and 4th to 7th decile
(F(2,16,783)=55.731,p=0.005), were more active than those from other income levels.
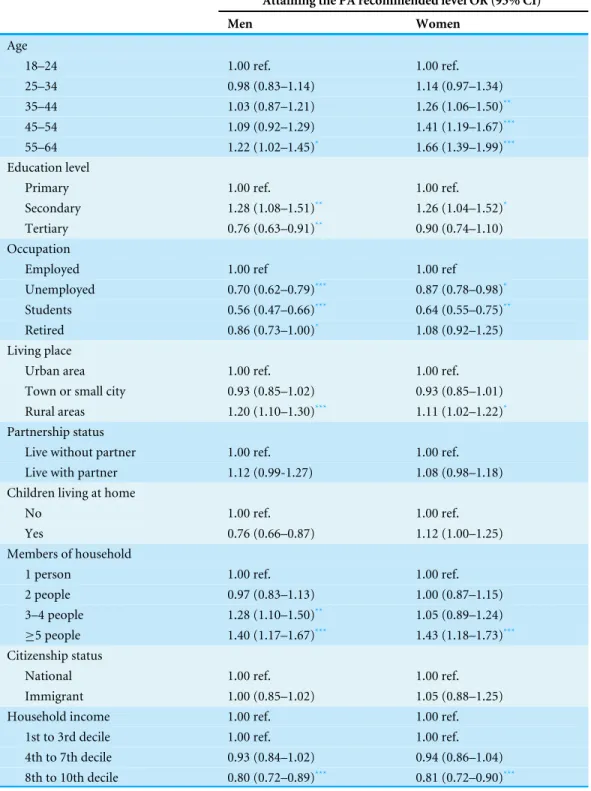
Table 3presents the results of the multivariate binary logistic regression. For men, being in the age group of 55–64 years was positively related to attaining PA recommended levels (OR =1.22, 95% CI [1.02–1.45],p<0.05), compared to the younger age group.
Attaining PA recommendations was also positively associated with: secondary education (OR =1.28, 95% CI [1.08–1.51],p<0.01), living in rural areas (OR=1.20, 95% CI
[1.10–1.30],p<0.001), and having three or more people living at home (OR=1.28, 95%
CI [1.10–1.50],p<0.01; and OR=1.40, 95% CI [1.17–1.67],p<0.001). On the other
hand, attaining the recommended levels of PA was negatively associated with: tertiary education (OR=0.76, 95% CI [0.63–0.91],p<0.01), being unemployed (OR=0.70, 95%
CI [0.62–0.79],p<0.001), being a student (OR=0.56, 95% CI [0.47–0.66],p<0.001),
and being a retired person (OR=0.86, 95% CI [0.73–1.00],p<0.05), when compared
Table 2 Estimated prevalence of European people’s physical activity in the last seven days by socio-demographic characteristics.
Men (n=18,272) Women (n=21,006)
Number of times of PA in the last seven days (≥30 min/day) (95% CI)
p Number of times of PA
in the last seven days (≥30 min/day) (95% CI)
p
Agea 0.005 <0.001
18–24 4.81 (4.72–4.89) 4.58 (4.50–4.67)
25–34 4.86 (4.79–4.94) 4.99 (4.92–5.06)
35–44 4.92 (4.84–4.99) 5.12 (5.05–5.19)
45–54 4.98 (4.91–5.05) 5.15 (5.08–5.21)
55–64 4.98 (4.91–5.06) 5.26 (5.19–5.32)
Education levela <0.001 <0.001
Primary 4.51 (4.34–4.68) 4.77 (4.62–4.91)
Secondary 5.06 (5.02–5.09) 5.17 (5.13–5.21)
Tertiary 4.55 (4.48–4.63) 4.85 (4.79–4.91)
Occupationa <0.001 <0.001
Employed 5.02 (4.98–5.06) 5.10 (5.06–5.14)
Unemployed 4.80 (4.69–4.90) 5.05 (4.95–5.15)
Students 4.62 (4.51–4.72) 4.44 (4.34–4.54)
Retired 4.98 (4.84–5.12) 5.39 (5.27–5.50)
Living placea <0.001 <0.001
Urban area 4.84 (4.79–4.90) 5.00 (4.94–5.05)
Town or small city 4.76 (4.70–4.82) 4.93 (4.87–4.98)
Rural areas 5.11 (5.06–5.17) 5.24 (5.18–5.29)
Partnership statusb <0.001 <0.001
Live without partner 4.82 (4.76–4.87) 4.83 (4.78–4.89)
Live with partner 4.98 (4.94–5.02) 5.18 (5.14–5.22)
Children living at homeb 0.001 <0.001
No 4.87 (4.82–4.91) 4.90 (4.85–4.94)
Yes 4.99 (4.94–5.04) 5.20 (5.16–5.24)
Members of householda <0.001 <0.001
1 person 4.75 (4.65–4.85) 4.85 (4.74–4.95)
2 people 4.87 (4.80–4.94) 5.08 (5.02–5.14)
3–4 people 4.96 (4.92–5.01) 5.03 (4.98–5.08)
≥5 people 5.00 (4.92–5.09) 5.24 (5.17–5.32)
Citizenship statusb 0.700 0.825
National 4.92 (4.89–4.96) 5.06 (5.03–5.09)
Immigrant 4.89 (4.74–5.04) 5.05 (4.89–5.20)
Household incomea <0.001 0.005
1st to 3rd decile 4.87 (4.79–4.94) 5.09 (5.02–5.16)
4th to 7th decile 4.98 (4.92–5.04) 5.08 (5.03–5.14)
8th to 10th decile 4.79 (4.72–4.85) 4.96 (4.89–5.02)
Notes.
PA, physical activity.
Table 3 Binary logistic regression predicting the attainment of the physical activity recommended level by European people.
Attaining the PA recommended level OR (95% CI)
Men Women
Age
18–24 1.00 ref. 1.00 ref.
25–34 0.98 (0.83–1.14) 1.14 (0.97–1.34)
35–44 1.03 (0.87–1.21) 1.26 (1.06–1.50)**
45–54 1.09 (0.92–1.29) 1.41 (1.19–1.67)***
55–64 1.22 (1.02–1.45)* 1.66 (1.39–1.99)***
Education level
Primary 1.00 ref. 1.00 ref.
Secondary 1.28 (1.08–1.51)** 1.26 (1.04–1.52)*
Tertiary 0.76 (0.63–0.91)** 0.90 (0.74–1.10)
Occupation
Employed 1.00 ref 1.00 ref
Unemployed 0.70 (0.62–0.79)*** 0.87 (0.78–0.98)*
Students 0.56 (0.47–0.66)*** 0.64 (0.55–0.75)**
Retired 0.86 (0.73–1.00)* 1.08 (0.92–1.25)
Living place
Urban area 1.00 ref. 1.00 ref.
Town or small city 0.93 (0.85–1.02) 0.93 (0.85–1.01)
Rural areas 1.20 (1.10–1.30)*** 1.11 (1.02–1.22)*
Partnership status
Live without partner 1.00 ref. 1.00 ref.
Live with partner 1.12 (0.99-1.27) 1.08 (0.98–1.18)
Children living at home
No 1.00 ref. 1.00 ref.
Yes 0.76 (0.66–0.87) 1.12 (1.00–1.25)
Members of household
1 person 1.00 ref. 1.00 ref.
2 people 0.97 (0.83–1.13) 1.00 (0.87–1.15)
3–4 people 1.28 (1.10–1.50)** 1.05 (0.89–1.24)
≥5 people 1.40 (1.17–1.67)*** 1.43 (1.18–1.73)***
Citizenship status
National 1.00 ref. 1.00 ref.
Immigrant 1.00 (0.85–1.02) 1.05 (0.88–1.25)
Household income 1.00 ref. 1.00 ref.
1st to 3rd decile 1.00 ref. 1.00 ref.
4th to 7th decile 0.93 (0.84–1.02) 0.94 (0.86–1.04)
8th to 10th decile 0.80 (0.72–0.89)*** 0.81 (0.72–0.90)***
Notes.
PA, physical activity; OR, odds ratio; CI, confidence interval.
Attaining the physical activity recommended level means≥30 min of at least moderate physical activity, five or more times per week. Analyses were adjusted for country and age.
For women, older ages were more likely to attain the recommended levels of PA, and the age group of 55–64 years represented the strongest association (OR=1.66, 95% CI [1.39–1.99],p<0.001). Furthermore, attaining the PA recommendation was more likely
among those with secondary education (OR=1.26, 95% CI [1.04–1.52],p<0.05), who
lived in rural areas (OR=1.10, 95% CI [1.02–1.20],p<0.05), and who had five or more
people living at home (OR=1.43, 95% CI [1.18–1.73],p<0.001). Conversely, women
who were unemployed (OR=0.87, 95% CI [0.78–0.98],p<0.05), students (OR=0.64,
95% CI [0.55–0.75],p<0.01), and had the highest household income (OR=0.81, 95%
CI [0.72–0.90],p<0.01) had a lower likelihood of attaining PA recommended levels.
DISCUSSION
The present study examined the associations of socio-demographic factors with engagement in the recommended PA level among European adults. The results showed that 64.5% attained the PA recommended levels. Age, education level, occupation, living place, number of household members, and household income are factors related to PA participation, and are related to attaining the PA recommended levels among European adults.
European women were significantly more active than men, and were also more likely to meet the PA guidelines. This finding is different from other studies, which showed that men were more likely to engage in PA that met the guidelines (Hallal et al.,2012;Murtagh et al.,2015a.;Tucker, Welk & Beyler,2011). Although these results are not in line with most studies, it cannot be said that the outcome is entirely different from the literature. Studies among adults from Portugal, The Netherlands, Luxembourg, Lorraine (France) and Wallonia (Belgium) showed that women slightly surpassed men in time spent in PA during leisure time (Alkerwi et al.,2015;Marques et al.,2014;Mesters, Wahl & Keulen, 2014). The increased activity among women could be due to extra available time caused by a variable workload at home, and caring for children. Another reason could be that men achieve their PA levels by playing sports, but with increasing age these activities become harder to continue.
Those with secondary education were more likely to be physically active. Previous investigations showed that participants who achieved a higher educational level showed a lower prevalence of a sedentary lifestyle (Bauman et al.,2012). However, there are also studies that do not observe a relationship between these variables (Marques et al.,2014; Shibata et al., 2009). The correlation between education level and PA is not entirely understood beyond the fact that it is reported as a correlate of activity, but not determinant (Bauman et al.,2012). In this particular study, the results should be interpreted carefully because of the wide cultural variance among countries. Nonetheless, for European people in general, one can speculate that people with a higher education level generally have high control, high daily demands, and long work hours. These realities might reduce their available time for PA.
Employed and retired individuals were more active than students and the unemployed. The PA levels of the employed could be due to active commuting or, in some cases, the demands of the workplace. It is plausible that most students were young adults and were studying at university. Regular PA during this stage of transition into adulthood serves as an important foundation for adult life patterns (Telama et al.,2014). Further, this group may be important since those who attend university may play an important role in establishing social and cultural norms as they move into roles as decision-makers and opinion leaders within the population (Leslie et al.,1999). For unemployed people, results confirmed what was observed among adults from the United States of America (Van Domelen et al.,2011). The unemployed do not accumulate any occupational PA, or any activity associated with daily commuting. As a result, leisure time is the primary opportunity for PA. Unfortunately, unemployment is associated with depression (Khlat, Sermet & Le Pape,2004), which is related with less PA during leisure time (Song et al.,2012). Furthermore, many times unemployed have limited financial resources to join sport and fitness clubs, which could difficult participation in PA. This is a group at risk, and strategies to minimize the effect of unemployment on PA participation have to be developed.
People from rural areas were more active than those from other areas. This could be due to the fact that in rural areas more people, mainly men, work in the primary and secondary sectors of the economy, thereby increasing PA both in the workplace and in the household (Fan, Wen & Kowaleski-Jones,2014). This is particularly important because the urban population in 2014 accounted for 54% of the total global population, and it is estimated that, by 2017, a majority of people will be living in urban areas. This data suggests that the prevalence of PA may decrease as a result of growing urbanization.
women without partners were particularly disadvantaged in terms of their living standards, which may have an impact on access to PA participation.
Higher household income was negatively associated with attaining the PA recommended levels. This study’s findings do not support the idea that people from higher income or socioeconomic status are more physically active (Dias da Costa et al.,2005;Wilson et al., 2004). So far there is no consensual evidence that socioeconomic status explains people’s PA behaviours. Nevertheless, neighbourhood aesthetics, street connectivity, safety from crime, and proximity to parks are all associated with recreational walking and PA (Kamphuis et al., 2009;Sugiyama et al.,2014). Environmental factors may explain the variance in PA among socioeconomic status categories, observed in some studies, since access to attractive, safe, green space and resources for structured PA may be limited in deprived areas. In cases where people from a lower household income are less physically active than those from a higher household income, interventions to reduce differences in the availability of recreational PA among adults would be effective if they focused on neighbourhood perceptions as well as individual cognition (Kamphuis et al.,2009).
The current investigation had some strengths and limitations that have to be addressed. A major strength of the study is that the European Social Survey database includes a large and representative sample size of various European countries, as well as several socio-demographic characteristics to characterize the study sample. PA was self-reported rather than objectively measured, which could be subject to bias. People’s self-reported PA may be overestimated because of social desirability (Sallis & Saelens,2000). However, there is evidence that social desirability accounts for only a small variance in PA (Motl, McAuley & Distefano, 2005), and self-reported is a reliable method for epidemiologic studies (Craig et al., 2003), even when using a single item (Wanner et al.,2014). The analysis was cross-sectional, thereby making it impossible to determine cause and effect. Furthermore, there was no information about the participants’ weight status. This would be of importance since weight status is related with PA (Carlson et al.,2010).
ACKNOWLEDGEMENTS
We thank Professor Bruce Jones for help with the revision of the manuscript.
ADDITIONAL INFORMATION AND DECLARATIONS
Funding
The authors received no funding for this work.
Competing Interests
The authors declare there are no competing interests.
Author Contributions
• Adilson Marques analyzed the data, wrote the paper, prepared figures and/or tables.
• João Martins wrote the paper, reviewed drafts of the paper.
• Miguel Peralta wrote the paper, prepared figures and/or tables.
Human Ethics
The following information was supplied relating to ethical approvals (i.e., approving body and any reference numbers):
Data is publicly available so no IRB approval was needed.
Data Availability
The following information was supplied regarding data availability:
The data used in this research is publicly available from The European Social Survey:
http://www.europeansocialsurvey.org/data/download.html?r=6.
REFERENCES
Alkerwi A, Schuh B, Sauvageot N, Zannad F, Olivier A, Guillaume M, Albert A, Larsson
CA. 2015.Adherence to physical activity recommendations and its associated factors:
an interregional population-based study.Journal of Public Health Research4:35–42
DOI 10.4081/jphr.2015.406.
Bauman AE, Reis RS, Sallis JF, Wells JC, Loos RJ, Martin BW. 2012.Correlates of
physical activity: why are some people physically active and others not?Lancet
380:258–271DOI 10.1016/S0140-6736(12)60735-1.
Belanger M, Townsend N, Foster C. 2011.Age-related differences in physical activity
profiles of English adults.Preventive Medicine52:247–249
DOI 10.1016/j.ypmed.2011.02.008.
Bryan SN, Katzmarzyk PT. 2009.Are Canadians meeting the guidelines for moderate
and vigorous leisure-time physical activity?Applied Physiology, Nutrition, and Metabolism34:707–715DOI 10.1139/H09-060.
Bull FC, Schipper EC, Jamrozik K, Blanksby BA. 1997.How can and do Australian
doctors promote physical activity?Preventive Medicine26:866–873
DOI 10.1006/pmed.1997.0226.
Carlson SA, Fulton JE, Schoenborn CA, Loustalot F. 2010.Trend and prevalence
estimates based on the 2008 physical activity guidelines for americans.American Journal of Preventive Medicine 39:305–313DOI 10.1016/j.amepre.2010.06.006.
Craig C, Marshall A, Sjostrom M, Bauman A, Booth M, Ainsworth B, Pratt M, Ekelund U, Yngve A, Sallis J, Oja P. 2003.International physical activity questionnaire: 12-country reliability and validity.Medicine and Science in Sports and Exercise
35:1381–1395DOI 10.1249/01.MSS.0000078924.61453.FB.
Dias da Costa JS, Hallal PC, Wells JC, Daltoe T, Fuchs SC, Menezes AM, Olinto MT.
2005.Epidemiology of leisure-time physical activity: a population-based study in
southern brazil.Cadernos de Saude Publica21:275–282
DOI 10.1590/S0102-311X2005000100030.
European Commission. 2014.Special Eurobarometer 412. Sport and physical activity.
European Social Survey. 2012.ESS Round 6 source questionnaire. London: Centre for Comparative Social Surveys, City University London.
European Union. 2008.EU physical activity guidelines recommended policy actions in
support of health-enhancing physical activity. Brussels: European Union.
Fan JX, Wen M, Kowaleski-Jones L. 2014.Rural–urban differences in objective and
subjective measures of physical activity: findings from the National Health and Nutrition Examination Survey (NHANES) 2003–2006.Preventing Chronic Disease
11:140189DOI 10.5888/pcd11.140189.
Gerovasili V, Agaku IT, Vardavas CI, Filippidis FT. 2015.Levels of physical activity
among adults 18–64 years old in 28 european countries.Preventive Medicine
81:87–91DOI 10.1016/j.ypmed.2015.08.005.
Hallal PC, Andersen LB, Bull FC, Guthold R, Haskell W, Ekelund U. 2012.Global
phys-ical activity levels: surveillance progress, pitfalls, and prospects.Lancet380:247–257
DOI 10.1016/S0140-6736(12)60646-1.
Hardman A, Stensel D. 2009.Physical activity and health. The evidence explained. Oxon:
Routledge.
Kamphuis CB, Van Lenthe FJ, Giskes K, Huisman M, Brug J, Mackenbach JP. 2009.
Socioeconomic differences in lack of recreational walking among older adults: the role of neighbourhood and individual factors.International Journal of Behavioral Nutrition and Physical Activity6:Article 1 DOI 10.1186/1479-5868-6-1.
Khlat M, Sermet C, Le Pape A. 2004.Increased prevalence of depression, smoking,
heavy drinking and use of psycho-active drugs among unemployed men in France.
European Journal of Epidemiology19:445–451.
Leslie E, Owen N, Salmon J, Bauman A, Sallis JF, Lo SK. 1999.Insufficiently active
Australian college students: perceived personal, social, and environmental influences.
Preventive Medicine28:20–27DOI 10.1006/pmed.1998.0375.
Marques A, Martins J, Diniz J, Ramos M, Yazigi F, Onofre M, Carreiro da Costa
F. 2014.The correlates of meeting physical activity recommendations: a
population-based cross-sectional study.European Journal of Sport Science14(Suppl 1):S462–S470DOI 10.1080/17461391.2012.713008.
Marques A, Sarmento H, Martins J, Nunes LS. 2015.Prevalence of physical activity in
European adults - compliance with the World Health Organization’s physical activity guidelines.Preventive Medicine81:333–338DOI 10.1016/j.ypmed.2015.09.018.
McNeill LH, Kreuter MW, Subramanian SV. 2006.Social environment and physical
ac-tivity: a review of concepts and evidence.Social Science and Medicine63:1011–1022
DOI 10.1016/j.socscimed.2006.03.012.
Mesters I, Wahl S, Van Keulen HM. 2014.Socio-demographic, medical and
social-cognitive correlates of physical activity behavior among older adults (45–70 years): a cross-sectional study.BMC Public Health14:647 DOI 10.1186/1471-2458-14-647.
Motl RW, McAuley E, Distefano C. 2005.Is social desirability associated with
self-reported physical activity?Preventive Medicine40:735–739
Murtagh EM, Murphy MH, Murphy NM, Woods C, Nevill AM, Lane A. 2015a.
Prevalence and correlates of physical inactivity in community-dwelling older adults in Ireland.PLoS ONE10:e0118293DOI 10.1371/journal.pone.0118293.
Murtagh EM, Nichols L, Mohammed MA, Holder R, Nevill AM, Murphy MH. 2015b.
The effect of walking on risk factors for cardiovascular disease: an updated systematic review meta-analysis of randomised control trials.Preventive Medicine72:34–43
DOI 10.1016/j.ypmed.2014.12.041.
Rosenberg M, Mills C, McCormack G, Martin K, Grove B, Pratt S, Braham R. 2010.
Physical activity levels of Western Australian adults 2009: findings from the physical activity taskforce adult physical activity survey. Perth: Health Promotion Evaluation Unit, University of Western Australia.
Sallis JF, Saelens BE. 2000.Assessment of physical activity by self-report: status, limita-tions, and future directions.Research Quarterly for Exercise and Sport 71:S1–S14.
Shibata A, Oka K, Nakamura Y, Muraoka I. 2009.Prevalence and demographic
correlates of meeting the physical activity recommendation among Japanese adults.
Journal of Physical Activity & Health6:24–32.
Silva IC, Azevedo MR, Goncalves H. 2013.Leisure-time physical activity and social
support among Brazilian adults.Journal of Physical Activity & Health10:871–879.
Song MR, Lee YS, Baek JD, Miller M. 2012.Physical activity status in adults with
depression in the National Health and Nutrition Examination Survey, 2005-2006.
Public Health Nursing 29:208–217DOI 10.1111/j.1525-1446.2011.00986.x.
Sugiyama T, Cerin E, Owen N, Oyeyemi AL, Conway TL, Van Dyck D, Schipperijn J, Macfarlane DJ, Salvo D, Reis RS, Mitas J, Sarmiento OL, Davey R, Schofield G,
Orzanco-Garralda R, Sallis JF. 2014.Perceived neighbourhood environmental
attributes associated with adults recreational walking: IPEN adult study in 12 countries.Health Place28:22–30DOI 10.1016/j.healthplace.2014.03.003.
Suija K, Pechter U, Maaroos J, Kalda R, Ratsep A, Oona M, Maaroos HI. 2010.Physical
activity of Estonian family doctors and their counselling for a healthy lifestyle: a cross-sectional study.BMC Family Practice11:48DOI 10.1186/1471-2296-11-48.
Telama R, Yang X, Leskinen E, Kankaanpaa A, Hirvensalo M, Tammelin T, Viikari
JS, Raitakari OT. 2014.Tracking of physical activity from early childhood through
youth into adulthood.Medicine and Science in Sports and Exercise46:955–962
DOI 10.1249/MSS.0000000000000181.
Tucker JM, Welk GJ, Beyler NK. 2011.Physical activity in US adults compliance with the
Physical Activity Guidelines for Americans.American Journal of Preventive Medicine
40:454–461DOI 10.1016/j.amepre.2010.12.016.
USDHHS. 2008.2008 physical activity guidelines for Americans. Be active, healthy, and happy! Washington, D.C.: USDHHS.
Van Domelen DR, Koster A, Caserotti P, Brychta RJ, Chen KY, McClain JJ, Troiano RP,
Berrigan D, Harris TB. 2011.Employment and physical activity in the US.American
Wanner M, Probst-Hensch N, Kriemler S, Meier F, Bauman A, Martin BW. 2014.What physical activity surveillance needs: validity of a single-item questionnaire.British Journal of Sports Medicine48:1570–1576DOI 10.1136/bjsports-2012-092122.
WHO. 2010.Global recommendations on physical activity for health. Geneva: World
Health Organization.
Wilson DK, Kirtland KA, Ainsworth BE, Addy CL. 2004.Socioeconomic status and
perceptions of access and safety for physical activity.Annals of Behavioral Medicine
28:20–28DOI 10.1207/s15324796abm2801_4.
Woodcock J, Franco OH, Orsini N, Roberts I. 2011.Non-vigorous physical activity
and all-cause mortality: systematic review and meta-analysis of cohort studies.