Repositório ISCTE-IUL
Deposited in Repositório ISCTE-IUL:
2018-12-07Deposited version:
Post-printPeer-review status of attached file:
Peer-reviewedCitation for published item:
Pedro, T. S., Silva, J. L. & Pereira, R. (2018). Predicting the confusion level of text excerpts with syntactic, lexical and n-gram features. In Luis Gómez Chova; Agustín López Martínez; Ignacio Candel Torres (Ed.), 10th International Conference on Education and New Learning Technologies. (pp. 8417-8426). Palma: IATED.
Further information on publisher's website:
10.21125/edulearn.2018.1959Publisher's copyright statement:
This is the peer reviewed version of the following article: Pedro, T. S., Silva, J. L. & Pereira, R. (2018). Predicting the confusion level of text excerpts with syntactic, lexical and n-gram features. In Luis Gómez Chova; Agustín López Martínez; Ignacio Candel Torres (Ed.), 10th International
Conference on Education and New Learning Technologies. (pp. 8417-8426). Palma: IATED., which has been published in final form at https://dx.doi.org/10.21125/edulearn.2018.1959. This article may be used for non-commercial purposes in accordance with the Publisher's Terms and Conditions for self-archiving.
Use policy
Creative Commons CC BY 4.0
The full-text may be used and/or reproduced, and given to third parties in any format or medium, without prior permission or charge, for personal research or study, educational, or not-for-profit purposes provided that:
• a full bibliographic reference is made to the original source • a link is made to the metadata record in the Repository • the full-text is not changed in any way
The full-text must not be sold in any format or medium without the formal permission of the copyright holders.
Serviços de Informação e Documentação, Instituto Universitário de Lisboa (ISCTE-IUL) Av. das Forças Armadas, Edifício II, 1649-026 Lisboa Portugal
Phone: +(351) 217 903 024 | e-mail: [email protected] https://repositorio.iscte-iul.pt
PREDICTING THE CONFUSION LEVEL OF TEXT EXCERPTS WITH
SYNTACTIC, LEXICAL AND N-GRAM FEATURES
T. Silva Pedro
1, J. L. Silva
1,2,
R. Pereira
11
Instituto Universitário de Lisboa (ISCTE-IUL), ISTAR-IUL (PORTUGAL)
2Madeira-ITI (PORTUGAL)
Abstract
Distance learning, offline presentations (presentations that are not being carried in a live fashion but were instead pre-recorded) and such activities whose main goal is to convey information are getting increasingly relevant with digital media such as Virtual Reality (VR) and Massive Online Open Courses (MOOCs). While MOOCs are a well-established reality in the learning environment, VR is also being used to promote learning in virtual rooms, be it in the academia or in the industry. Oftentimes these methods are based on written scripts that take the learner through the content, making them critical components to these tools. With such an important role, it is important to ensure the efficiency of these scripts.
Confusion is a non-basic emotion associated with learning. This process often leads to a cognitive disequilibrium either caused by the content itself or due to the way it is conveyed when it comes to its syntactic and lexical features. We hereby propose a supervised model that can predict the likelihood of confusion an input text excerpt can cause on the learner. To achieve this, we performed syntactic and lexical analyses over 300 text excerpts and collected 5 confusion level classifications (0 – 6) per excerpt from 51 annotators to use their respective means as labels. These examples that compose the dataset were collected from random presentations transcripts across various fields of knowledge. The learning model was trained with this data with the results being included in the body of the paper.
This model allows the design of clearer scripts of offline presentations and similar approaches and we expect that it improves the efficiency of these speeches. While this model is applied to this specific case, we hope to pave the way to generalize this approach to other contexts where clearness of text is critical, such as the scripts of MOOCs or academic abstracts.
Keywords: Confusion, supervised learning, text, presentation.
1
INTRODUCTION
Distance-learning is a growing market, especially the so-called MOOCs (Massive Open Online Course) [1]. Most of these are based on video scripts where excerpts (either on the academia or the industry) teach the enrolled students about the matter of the course. However, Intelligent Tutoring Systems (ITS) are showing promising results when compared to human tutoring [2]. These systems often take place in VEs and have Animated Pedagogical Agents (APA) (see [3]–[5]) that provide visual support and enhance the learner’s engagement with the course. Apart from distance-based scenarios, any pre-written script can be subject to analysis and improvement to better convey its content. This is usually done resorting to human sensibility, experience and knowledge of how to write a clear text. They can be supported by tools that detect long sentences or passive voice, but that is addressing only the tip of the problem.
In these scenarios the set of emotions is comprised of the cognitive states of engagement, confusion, frustration and boredom. Detecting when the user is in any of these states is valuable for taking action accordingly. Confusion is particularly interesting as it is in that state that the subject is triggered by stimuli that leads to a cognitive disequilibrium [6] and this confusion state and its resolution can increment the learning gain [7].
As confusion is the central subject of this work, an explanation of cognitive disequilibrium is due. Citing D’Mello and Graesser: “Cognitive disequilibrium is a state of uncertainty that occurs when an individual is confronted with obstacles to goals, interruptions of organized action sequences, impasses, contradictions, anomalous events, dissonance, incongruities, unexpected feedback, uncertainty, deviations from norms, and novelty.”. This means that this is the event that results from a stimulus applied to a learner when he/she is engaged on a learning process. Triggering this event is especially
important because there is evidence that suggests that inducing confusion to lead the learner into a deep learning state produces higher learning gains [7].
The goal of this work is to yield a tool that classifies text of how likely it will bring confusion to its consumer. Predicting the confusion likelihood of a text excerpt may help building better scripts when they are being designed, thus improving the acceptance and efficiency of the scenario.
There are two separate perspectives on produced text that can induce confusion: how it is written (syntax and lexicon) and what its content is (semantics). We believe that syntactic and lexical complexities are key factors in inducing confusion and hypothesize that it is possible to predict a sentence’s likelihood of generating confusion based on its syntactic and lexical roles. To address this problem, we set out to create a corpus of text excerpts collected from publicly available presentation transcripts. We then asked annotators to label these excerpts as to how confusing they found them. Lexical and syntactic features for each text excerpt were collected to characterise this corpus and used to feed a machine learning pipeline whose objective is to identify the best set of features and algorithm that fits the data.
In the next section we discuss the literature of confusion prediction and its current application on ITS. Next, we describe the methodology for the creation of the dataset, the sample of annotators and the application used to produce the labels we later used to train the model. After the methodology, the set of features is described, followed by a description of the machine learning pipeline. Finally, results are presented and discussed. We close this contribution with a short conclusion and guidelines for future work.
2
LITERATURE REVIEW
Much research has been conducted in affective detection on distance-learning scenarios, either to assess which affective states are most observed and relevant to this context, and how to automatically detect them. In opposition to the basic emotional states that typically occur in emotion-driven situations, in learning contexts there is a set of more complex, non-basic emotional states. Sidney D’Mello, Arthur Graesser and colleagues have been conducting extensive research on identifying and detecting learning-centred affective states and adapting their ITS, AutoTutor [8], to these states. When analysing at a fine-grained level, it is suggested that the set of emotions experienced during learning is mainly comprised of boredom, confusion, engagement/flow, frustration, delight, neutral, surprise [9]–[13]. Some studies have been trying to perform Automatic Emotion Recognition (AER) to detect some of these states through Action Unit (AU) [14] detection [8], [15], [16], physiological signals [13], learner behaviour [17], conversational cues [18] and gross body language [19]. However, there is strong evidence that a subset of emotions comprised of engagement/flow, confusion, frustration and boredom occur at a higher frequency than basic emotions [20], [21].
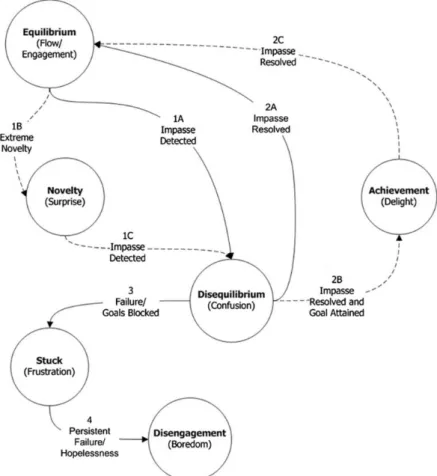
D’Mello and Graesser have conducted a very interesting experiment [21] that yielded a model (Fig. 1) that initially hypothesized affect transitions between engagement/flow → confusion, confusion → engagement/flow, confusion → frustration and frustration → boredom. In addition, surprise and delight were occurring in the engagement/flow → confusion and confusion → engagement/flow transitions, respectively. Results confirmed most of these transitions with exception to frustration → boredom transition, which was only partially confirmed. The experiment was devised to validate the proposed model based on four hypotheses, from which the first 3 ones are the ones relevant for this paper:
1. The disequilibrium hypothesis states that certain stimuli lead the learner into a cognitive disequilibrium that highly relates to the engagement/flow → confusion transition;
2. The productive confusion hypothesis theorizes that the confusion → engagement/flow transition yields good learning gains as the learner can resolve the stimulus that drove him/her into the cognitive disequilibrium;
3. In opposition to the previous hypothesis, the hopeless confusion aims at explaining the confusion → frustration transition stating that in the same state of confusion the learner may not be able to resolve the stimulus that caused the disequilibrium;
4. The disengagement hypothesis states that if the learner stays in a frustration state for long, it will lead to a boredom state.
Fig. 1. Model of learning-centred affective states as proposed by D'Mello and Graesser. Solid lines represent main transitions between affective states while dashed lines are middle transitions that are
not guaranteed to occur. Nodes represent affective states and the floating text the type of transition. The nodes in Fig. 1 have the learning-centred affective states represented in parentheses and the associated events in bold. Solid lines represent the affect transitions that were hypothesized while the middle transitions are expressed through dashed lines and can happen or not, but that will ultimately lead to the original affective states that are connected through solid lines. This model assumes that the modelling starts when the learner is on one of the two leaf nodes (engagement/flow or boredom) and that he is actively focused on the content that is being delivered. The learner is usually in an engaged state with the content he/she is trying to master until a stimulus triggers a cognitive disequilibrium, leading him/her to a confusion state. But, on the one hand, if the stimulus is too disruptive, the middle state of surprise can be experienced before arriving at the disequilibrium. On the other hand, if the subject is already in a state of confusion and can resolve the impasse, this can generate a middle state of delight before engaging in the task again.
The reported instances of boredom, engagement/flow, confusion frustration and neutral states were significantly higher than delight or surprise for both studies, which is aligned with the findings of the described model, where delight and surprise are not essential nodes. Results show that hypotheses 1, 2 and 3 were confirmed and hypothesis 4 was only partially supported. All of the first three were gravitating around confusion, which stresses out the important role of this affective state during information acquisition. There was also evidence of additional patterns of boredom → frustration and frustration → confusion, however, this falls out of the scope of this analysis due to its lack of robustness. With the central role and benefits of confusion for learning, some studies were carried to induce confusion in the subject, try to manage its level and keeping it at the level of productive confusion but avoiding the evolution to frustration (hopeless confusion) [22]–[24]. This regulation of confusion has been considered as the “zone of optimal confusion” [6].
3
METHODOLOGY
To our knowledge there are no publicly available datasets that serve the purpose of this study so we set out to build one according to the goal of this work. Our objective was to have a dataset composed of
training examples labelled with a confusion level and a set of features that could syntactically and lexically describe these examples. To achieve this goal, 3 tasks were required: collect and process the corpus of the dataset, extract features for each training example and label them.
The collection was carried by means of manual web scraping where 39 presentation transcripts from various fields of knowledge were collected. These transcripts contain full presentations whereas we wanted our classifier to have a granularity of excerpts with at least 50 words but the closest possible to this number. With the NLTK package for Python (https://www.nltk.org/) we split these transcripts on text excerpts with at least 50 words while keeping the full sentences (that is, splitting in the next ending punctuation after the first 50 words, resulting in text excerpts with varying lengths but as close to 50 words as possible). The splitting of these 39 transcripts resulted in a pool of 600 text excerpts from which we pulled 300.
The next task consisted in extracting features from these text excerpts. We resorted on the Lexical Complexity Analyzer (LCA) [25] and L2 Syntactical Complexity Analyzer (L2SCA) [26] available on (http://aihaiyang.com/software/) at the date this paper was written. These are web-based software that require only text strings as inputs and provides several lexical and syntactic measures. We opted to use this software because it provided the wanted features without having to produce any code or have to delve into other toolkits. The output of these strings is .csv files with the selected features for each string.
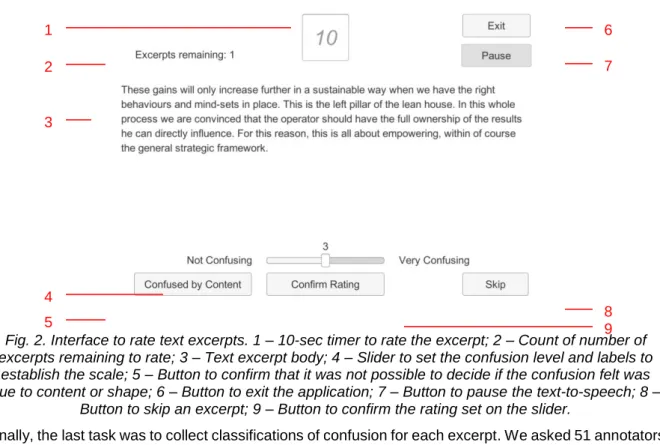
Fig. 2. Interface to rate text excerpts. 1 – 10-sec timer to rate the excerpt; 2 – Count of number of excerpts remaining to rate; 3 – Text excerpt body; 4 – Slider to set the confusion level and labels to
establish the scale; 5 – Button to confirm that it was not possible to decide if the confusion felt was due to content or shape; 6 – Button to exit the application; 7 – Button to pause the text-to-speech; 8 –
Button to skip an excerpt; 9 – Button to confirm the rating set on the slider.
Finally, the last task was to collect classifications of confusion for each excerpt. We asked 51 annotators to classify 30 excerpts each, which gave a total of 1500 valid annotations (the annotators could skip some text excerpts if they wanted to). This sample was composed of 41 (80.39%) male and 10 (19.61%) female annotators. An application was provided for each annotator to classify these excerpts. A first slide introducing the context and goal of the task was presented to the annotator, stating the task was anonymous and only his/her answers would be recorded. Next, a more detailed description of the task was presented, stressing the task was not about the annotators reading or comprehension skills, but rather about the complexity of the test itself. One challenge with which we were faced was to clarify that the confusion evaluation was only about the syntactic and lexical shape of the text, and not about the content of the text itself. In this description slide it was also stressed that some of the content may not be familiar to the annotator, but to try to rate anyway, disregarding the content and focusing on how well he could read and understand the text in terms of the complexity of its sentences and words.
Next, a slide provided the annotator with a set of instructions for the task. He/she had a slider ranging from 0 (not confusing) to 6 (very confusing) to rate the excerpt, a button to confirm it, another to press in case it was not possible to detach the confusion state from the underlying content of the excerpt and
1 2 3 4 5 6 7 9 8
a skip button to skip any excerpt. A voice was reading every excerpt and the button mentioned above are unlocked after it finishes reading. The annotator could exit the task any time he wanted to or pause it while the voice was reading the excerpt, in that case the reading stopped and the excerpt was hidden. After the instructions were given, a screenshot was shown so the annotator could get himself accustomed with the interface, shown on Fig. 2.
Before the task started, the annotators were asked if they understood the separation between syntactic and lexical text complexity and the content. From the whole sample, 46 (90.20%) stated they understood, while 5 (9.80%) said they somewhat understood and none reported they did not understand. The ones who reported they only somewhat understood were clarified until comfortable with this definition. It is noteworthy to say that all the annotators had a technological background. This detail allowed them to be easily accustomed with the application due to the intrinsic contact with digital applications, or due to the typical English language skill that is required to work in this field. However, this characteristic can introduce bias in the sample. During the task, a synthesized voice (either male or female) was reading the excerpt. When it finished the reading, the 10-sec timer was unlocked and the annotator could classify.
After performing the task, the annotator reported if he/she found it boring. The majority of the annotators, 39 (76.47%) of them reported they did not find the task boring, while 10 (19.61%) found it more or less boring and only 2 (3.92%) said it was boring. This can assure us that there was no significant bias on classifications due to the repetitiveness of the task. The confusion levels ranged from 0 to 6, where 0 corresponded to no confusion reported, and 6 to maximum confusion. Besides these levels, there was also the “Confused by content” button where, in case of confusion, the annotator could not decide if the source of confusion was the content or the lexical and syntactical complexity.
4
DATASET DESCRIPTION
4.1 Sample description
The task described in the previous section resulted in a dataset composed of 300 English text excerpts classified over 8 different categories: from 0 to 6 confusion or “confused by content” (CC). The ratio of skipped excerpts is around 1.9%, which is a good sign that annotators engaged well with the task and confirms their feedback about the boredness of the task. Also the vast majority of them are triggered by exceeding the time to answer (only one skipped excerpt was purposely skipped), which may be due to indecision or the learning curve of the application mechanics.
Due to the subjectivity of what a level of confusion is and the size of the dataset, we decided to condense the answers into four categories:
• “Low confusion” is considered when there is a majority (three or more annotations) of 0 or 1 ratings,
• "Medium confusion" is considered when there is a majority of 2 or 3 ratings, • "High confusion" is considered when there is a majority of 4 to 6 ratings, • "Confused by content" is considered when there is a majority of 'CC' ratings.
Furthermore, when there was no agreement between at least three annotators, the excerpt was classified as having no agreement. In fact, there is agreement for only 67.7% of the dataset. Our ideal goal is to achieve near-human accuracy when classifying text excerpts. For such a subjective task we would not have the means to assess if the model was performing well, motivating us to exclude the excerpts that did not meet this criterion of having agreement. In addition, for now we cannot hope that a model would be able to surpass the human skill in this particular case.
As can be stated from the bullet points above, we decided to give a higher weight to “High confusion”, and the motivation for this is two-fold. First, due to the imbalance of the dataset where, even with this weighting, the classes described above are represented in the dataset approximately by the percentages presented on Fig. 3, after dropping the excerpts that did not meet the agreement criterion. Secondly, because we consider it is more important to solve highly confusing excerpts than oversimplifying them.
From an optimistic perspective these values can tell us that the annotators understood well what the task was about. However, we cannot discard the possibility of its misinterpretation and giving high values of confusion due to content and not text complexity. Due to the negligibility of the “Confused by content” presence, we decided to remove those excerpts from the dataset, for their presence would only increase
the complexity of the problem. The Fleiss’ kappa coefficient [27] obtained from this sample ranks in the “Slight agreement” segment with only 0.16 [28]. This is not necessarily bad, but rather translates to a hard problem since even among excerpts that collected a majority (3 or more) of same categorical annotations there is only shy inter-annotator agreement.
Fig. 3. Chart representing the class distribution of the dataset. With 62.05% the “Low confusion” class is the most represented and unbalances the dataset. “Medium confusion” and “High confusion” are
equally balanced. “Confused by content” classifications are negligible.
Due to its size, 80% of the dataset was taken for purposes of training with 10-fold cross-validation and the remnant made the test set. The two sets were similarly balanced class-wise according to the distribution given in Fig. 3. Feature scaling was performed to place the values between 0 and 1 and not biasing the learning towards features with higher scales.
4.2 Text complexity features
The LCA and L2SCA provided us with syntactic and lexical features. Coh-Metrix [29] is a similar syntactic complexity analyser that was developed for English native speakers. We have chosen L2SCA over Coh-Metrix because in our final use case, the producers of written text are not English native speakers and L2SCA was developed towards this audience. In addition to these, we vectorised each excerpt into unigrams, bigrams and trigrams, and kept those that occurred more than certain lower and upper thresholds in the entire corpus. We tested our model with unigrams up to trigrams because higher dimensional n-grams are known to become so sparse that it renders themselves unusable [30], even more in a small dataset as ours.
Table 1. Features selected by the recursive feature elimination algorithm. For further explanation of these features refer to [25], [26].
Feature Description Alias
Mean Length of T-unit # of words / # of T-units MLT
Verb phrases per T-unit # of verb phrases / # of T-units VP/T Dependent Clauses ratio # of dependent clauses / # of T-units DC/T Sentence coordination ratio # of T-units / # of sentences T/S Lexical Sophistication I # of sophisticated lexical words / # of
lexical words
LS1
Verb Sophistication I # of different types of sophisticated verbs / # of verbs
VS1
Number of Different Words (expected random 50)
Mean T of 10 random 50-word samples
NDWERZ
Noun Variation # of different nouns / # of lexical words
VV2
Adjective Variation # of different adjectives / # of lexical words
From a total of 56 features from we considered 40. The ones we left out are simpler features that compose other more complex ones (i.e. two of the left out features are the number of words (W) and the number of sentences(S), and a more complex feature that we included is the mean number of words per sentence, which stands for “Mean Length Sentence”, MLS) which would render them redundant. We performed automatic recursive feature elimination (RFE) with cross-validation using the scikit-learn machine learning toolkit for Python which left us with the set of features that is described on Table 1. In addition to these features, several bigrams were also considered by the RFE algorithm. The choice of using bigrams rather than uni- or trigrams was made by performing RFE with the lexical and syntactic features plus each set of n-grams separately with bigrams yielding the best results. These results will be presented in the next section, as well as the final results from model selection and final test scores.
5
EVALUATION AND DISCUSSION
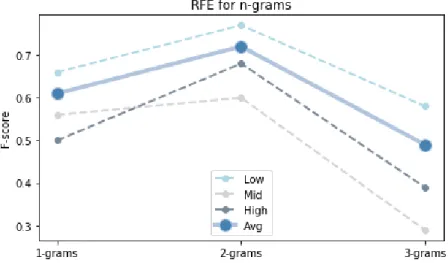
Recursive feature elimination (RFE) is a technique in which a selected estimator is tested recursively against various subsets of a feature set, eliminating features in each recursion until reaching a subset that optimizes the selected error metric (i.e. maximizing accuracy or f-score on classification, or minimizing mean squared error on regression). We chose f-score [31] as the error metric for the same two reasons we have given higher relevance to the “High confusion” class: the imbalance of the dataset and valuing the detection of highly confusing excerpts over the less confusing.
Fig. 4 presents f-score values for RFE with cross-validation for each feature space (lexical and syntactic features with unigrams, bigrams or trigrams). Bigrams hold the highest average f-score across all classes when compared with the other n-grams. It also holds the highest individual f-score for the “High confusion” class based on the same comparison. These two facts led us to include bigrams in the feature space rather than uni- or trigrams. Even so, class imbalance takes its toll on the f-score as this score is higher for “Low confusion” than for any other class across all n-grams, even with weights favoring both “High” and “Medium confusion” classes. As we would want f-score values to be as close as possible for each n-gram, trigrams’ are clearly more spread which means the weights did not work as well in this case. Trigrams are widely used but it did not fit as well in our dataset, probably due to its size. With small samples, trigrams tend to be sparser and not perform well. However, we can hypothesize that its performance may increase if more data is available since it can capture more syntax. The algorithm we used to perform the RFE was a linear support vector classifier (SVC) with balanced class weights due to the dataset imbalance, regularization term of 1.0, gamma inverse to the number of features used to fit the algorithm, tolerance for the stopping criterion of 0.001 with a ‘one-vs-all’ decision function.
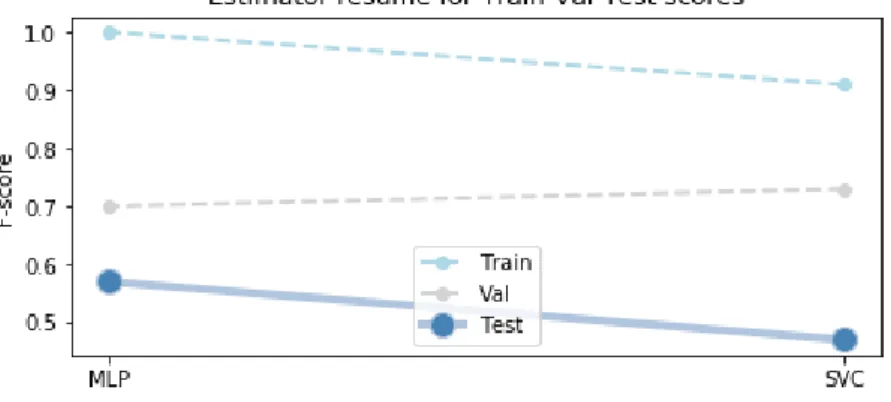
Fig. 4. Each n-gram is represented on the x-axis with values for each class of confusion, as well as their average. The average is higher for bigrams (2-grams) and the individual f-score for “High confusion” is also significantly higher for bigrams, in this case surpassing even “Medium confusion”. Fig. 5 shows the results of grid search with cross-validation over several algorithms. Multilayer Perceptron (MLP) and other instance of SVC (different from the one used to perform RFE) yielded the best results. Both algorithms seem to be overfitting, especially the MLP with its training f-score of 1.0 and significant difference between training and validation f-scores reinforcing that. However, when ran over the test set, it performed better as this f-score was closer to the validation f-score than those with
SVC. SVC seemed less overfitted as it only has about 0.90 f-score for the training set and 0.72 on the validation set but it performs worse in the test set.
The MLP was trained with an identity activation function, alpha equal to 0.001, 4 hidden layers with 20 nodes, constant learning rate initialized as 0.01 and 500 max iterations until convergence. The linear SVC was trained with a regularization term of 0.1, ‘one-vs-one’ decision function shape, and gamma of 10.0.
Fig. 5. Chart with train, validation and test f-scores for each estimator. The test f-score of MLP was higher than SVC, however, one could expect the opposite as the train and validation f-scores of the
SVC seemed more robust and less overfitted.
A finer look to the test results shows that “High” and “Medium confusion” also have higher individual values of f-score, thus aligning with our objective of maximizing these values. With an average f-score of 0.47, SVC resulted in 0.57, 0.38 and 0.17 f-scores for the “Low”, “Medium” and “High confusion” classes, respectively. On the other hand, MLP yielded an average f-score of 0.57 with individual f-scores of 0.70, 0.38 and 0.33 for “Low”, “Medium” and “High confusion” classes, respectively. When compared to SVC, MLP yields significantly higher f-score for the “High confusion” class which aligns with our goal. Still, “Low confusion” f-score is significantly separated from the rest.
This work represented a first effort on trying to predict confusion from transcripts produced from spoken text with lexical, syntactic and n-gram features. The results are not near the performance of other text-related problems however, the calculated Fleiss’ kappa coefficient reminds us that we are not facing an easy problem. With this in mind, we consider these as promising results that we hope will improve with more data. There is obvious room for improvement over the size of the dataset, but also over the design of the data collection itself. The content of the text excerpts was varied and, even if the annotators could detach from it, there is possible bias coming from their personal preferences which may make them more committed to rate some excerpts than others. One possible solution for this may be collecting excerpts over a single mainstream theme.
6
CONCLUSIONS
In this paper the authors propose a model that classifies text excerpts over 3 confusion levels. We started out by collecting a dataset composed of 300 text excerpts and asking 51 annotators to classify them. This is a rather short dataset but this paper represents a first effort. Future work requires an automated system for web scraping and data labelling to easily escalate the data acquisition.
We then extracted lexical, syntactic and n-gram features to complete the dataset and build a learning model. From a pool of 40 lexical and syntactic features, 9 were chosen resorting to recursive feature elimination, plus high-performing bigrams.
The results yielded satisfactory results for a first effort with no comparison basis and for such a hard problem given the computed Fleiss’ kappa coefficient. The multilayer perceptron neural network was the best performing algorithm followed by the support vector classifier with f-score results on the test set of 0.57 and 0.47, respectively. We hope this study paves the way for more research on confusion prediction from text as we believe that as higher performance is achieved, it can prove invaluable to several applications, such as improving student retention on MOOCs, create more engaging speeches from offline scripts on virtual presentations or even escalating for other scenarios.
ACKNOWLEDGEMENTS
This work was supported by ISTAR-IUL (UID/MULTI/0446/2013). José Luís Silva acknowledges support from Fundação para a Ciência e a Tecnologia (FCT, Portugal) through project UID/EEA/50009/2013.
REFERENCES
[1] J. Bersin, “Use Of MOOCs And Online Education Is Exploding: Here’s Why,” 2016. [Online]. Available: www.forbes.com/sites/joshbersin/2016/01/05/use-of-moocs-and-online-education-is-exploding-heres-why. [Accessed: 22-Jan-2018].
[2] A. C. Graesser, “Conversations with AutoTutor Help Students Learn,” Int. J. Artif. Intell. Educ., vol. 26, no. 1, pp. 124–132, Mar. 2016.
[3] W. L. Johnson and J. C. Lester, “Face-to-Face Interaction with Pedagogical Agents, Twenty Years Later,” Int. J. Artif. Intell. Educ., vol. 26, no. 1, pp. 25–36, Mar. 2016.
[4] N. L. Schroeder, O. O. Adesope, and R. B. Gilbert, “How Effective are Pedagogical Agents for Learning? A Meta-Analytic Review,” J. Educ. Comput. Res., vol. 49, no. 1, pp. 1–39, Jul. 2013. [5] M. Soliman and C. Guetl, “Intelligent Pedagogical Agents in immersive virtual learning
environments: A review,” in The 33rd International Convention MIPRO, 2010, pp. 827–832. [6] A. Arguel, L. Lockyer, O. V. Lipp, J. M. Lodge, and G. Kennedy, “Inside Out,” J. Educ. Comput.
Res., vol. 55, no. 4, pp. 526–551, 2017.
[7] S. K. D’Mello, B. Lehman, R. Pekrun, and A. Graesser, “Confusion can be beneficial for learning,” Learn. Instr., vol. 29, pp. 153–170, Feb. 2014.
[8] S. K. D’Mello and A. Graesser, “AutoTutor and affective autotutor,” ACM Trans. Interact. Intell. Syst., vol. 2, no. 4, pp. 1–39, 2012.
[9] S. D. Craig, A. C. Graesser, J. Sullins, and B. Gholson, “Affect and learning: An exploratory look into the role of affect in learning,” J. Educ. Media, vol. 29, pp. 241–250, 2004.
[10] S. K. D’Mello, S. D. Craig, J. Sullins, and A. C. Graesser, “Predicting Affective States expressed through an Emote-Aloud Procedure from AutoTutor’s Mixed-Initiative Dialogue,” Int. J. Artif. Intell. Educ., vol. 16, no. 1, pp. 3–28, 2006.
[11] S. K. D’Mello, B. Lehman, and N. Person, “Monitoring affect states during effortful problem solving activities,” Int. J. Artif. Intell. Educ., vol. 20, no. 4, pp. 361–389, 2010.
[12] S. K. D’Mello and A. Graesser, “Affect Detection from Human-Computer Dialogue with an Intelligent Tutoring System,” 2006, pp. 54–67.
[13] M. S. Hussain, O. AlZoubi, R. A. Calvo, and S. K. D’Mello, “Affect Detection from Multichannel Physiology during Learning Sessions with AutoTutor,” in Lecture Notes in Computer Science, G. Biswas, S. Bull, J. Kay, and A. Mitrovic, Eds. Springer, Berlin, Heidelberg, 2011, pp. 131–138. [14] P. Ekman and W. V. Friesen, Manual for the Facial Action Code System. Palo Alto: Consulting
Psychologists Press, 1977.
[15] J. F. Grafsgaard, J. B. Wiggins, K. E. Boyer, E. N. Wiebe, and J. C. Lester, “Automatically Recognizing Facial Indicators of Frustration: A Learning-centric Analysis,” in 2013 Humaine Association Conference on Affective Computing and Intelligent Interaction, 2013, pp. 159–165. [16] J. F. Grafsgaard, J. B. Wiggins, A. K. Vail, K. E. Boyer, E. N. Wiebe, and J. C. Lester, “The
Additive Value of Multimodal Features for Predicting Engagement, Frustration, and Learning during Tutoring,” in Proceedings of the 16th International Conference on Multimodal Interaction - ICMI ’14, 2014, pp. 42–49.
[17] R. Bixler and S. K. D’Mello, “Detecting boredom and engagement during writing with keystroke analysis, task appraisals, and stable traits,” in Proceedings of the 2013 international conference on Intelligent user interfaces - IUI ’13, 2013, p. 225.
[18] S. K. D’Mello, S. D. Craig, A. Witherspoon, B. McDaniel, and A. Graesser, “Automatic detection of learner’s affect from conversational cues,” User Model. User-adapt. Interact., vol. 18, no. 1–2, pp. 45–80, Feb. 2008.
[19] S. K. D’Mello and A. Graesser, “Automatic Detection of Learner’s Affect From Gross Body Language,” Appl. Artif. Intell., vol. 23, no. 2, pp. 123–150, Feb. 2009.
[20] S. K. D’Mello and R. A. Calvo, “Beyond the basic emotions,” in CHI ’13 Extended Abstracts on Human Factors in Computing Systems on - CHI EA ’13, 2013, p. 2287.
[21] S. K. D’Mello and A. Graesser, “Dynamics of affective states during complex learning,” Learn. Instr., vol. 22, no. 2, pp. 145–157, 2012.
[22] B. Lehman et al., “Inducing and Tracking Confusion with Contradictions during Critical Thinking and Scientific Reasoning,” 2011, pp. 171–178.
[23] B. Lehman et al., “Inducing and Tracking Confusion with Contradictions during Complex Learning,” Int. J. Artif. Intell. Educ., vol. 22, no. 1–2, pp. 85–105, 2013.
[24] B. Lehman, S. D’Mello, and A. Graesser, “Interventions to Regulate Confusion during Learning,” 7315th ed., S. A. Cerri, W. J. Clancey, G. Papadourakis, and K. Panourgia, Eds. Springer, Berlin, Heidelberg, 2012, pp. 576–578.
[25] X. Lu, “The Relationship of Lexical Richness to the Quality of ESL Learners’ Oral Narratives,” Mod. Lang. J., vol. 96, no. 2, pp. 190–208, 2012.
[26] X. Lu, “Automatic analysis of syntactic complexity in second language writing,” Int. J. Corpus Linguist., vol. 15, no. 4, pp. 474–496, 2010.
[27] J. L. Fleiss, “Measuring nominal scale agreement among many raters.,” Psychol. Bull., vol. 76, no. 5, pp. 378–382, 1971.
[28] J. R. Landis and G. G. Koch, “The measurement of observer agreement for categorical data.,” Biometrics, vol. 33, no. 1, pp. 159–74, Mar. 1977.
[29] A. C. Graesser, D. S. McNamara, M. M. Louwerse, and Z. Cai, “Coh-Metrix: Analysis of text on cohesion and language,” Behav. Res. Methods, Instruments, Comput., vol. 36, no. 2, pp. 193– 202, May 2004.
[30] B. Allison, D. Guthrie, and L. Guthrie, “Another look at the data sparsity problem,” Text, Speech and Dialogue, pp. 327–334, 2006.
[31] N. Chinchor, “The statistical significance of the MUC-4 results,” in Proceedings of the 4th conference on Message understanding - MUC4 ’92, 1992, p. 30.
![Table 1. Features selected by the recursive feature elimination algorithm. For further explanation of these features refer to [25], [26]](https://thumb-eu.123doks.com/thumbv2/123dok_br/19205330.955704/7.892.164.729.792.1153/features-selected-recursive-feature-elimination-algorithm-explanation-features.webp)