The Building Blocks of Skill Development
∗
Vladimir Ponczek
†Cristine Pinto
‡Sao Paulo School of Economics - FGV
Abstract
The recent literature on human capital formation has emphasized the dynamic process of skills formation throughout the lifecycle. In particular, the importance of developing these skills early in life has been widely observed. According to Cunha and Heckman (2010), deficiencies in building these skills early in life make it difficult to catch up in later years. In this article, we evaluate the impact of a building block program on the development of cognitive and socio-emotional skills. Building block programs have been advertised as an investment that boosts intelligence. Using a randomized control trial in Brazil, we find a positive impact of the building block program on cognitive skills in the short run on younger students (seven to eight years old). We did not find any robust effect of the program on older kids(ten to twelve years old). In addition, we find complementaries between socio-emotional skills and the development of cognitives skills. Children that had higher socio-emotional skills beforehand have higher benefits from the investment (building blocks program). This result suggests that the development of socio-emotional skills can increase the window of opportunity in which the program can affect cognitive skills.
Keywords: Cognitive Skills, Socio-emotional skills, Investments, Complementarity JEL Codes: I20, I26
∗We would like to thank jonathan rockoff and the participants of Sao Paulo School of Economics, Seminar for comments
and suggestions. We also thank Marcela Melo for excellent research assistance.
1
Introduction
In this article, we estimate the impact of an educational program based on building blocks on the formation of cognitive and non-cognitive skills. In addition, we check for the presence of dynamic complementarity on the skill formation technological function1. In words, we test how previous developed skills affect the return
of the of the program on the development of cognitive skills.
This paper connects to a large body of the literature that studies skill formation during childhood. This recent literature on human capital formation has also emphasized the dynamic process of skill formation throughout the lifecycle. In particular, the importance of developing these skills early in life has been widely observed. According to ?, deficiencies in building these skills early in life make it difficult to catch up in later years. Furthermore, the literature has shown that both cognitive and socio-emotional skills are equally important to individuals socioeconomic development (?). More specifically, several studies have documented the importance of skills beyond cognitive abilityin determining success in a variety of outcomes2. This should
come as no surprise: ideas matter, but they may go to waste if not conveyed properly; leaders are often expected to inspire and coordinate, rather than carrying out the work themselves; diligence and hard work are expected to precede success and achievement. As a matter of fact, some findings suggest that these socio-emotional skills might be just as important - if not more - as cognitive skills in predicting successful outcomes in life (?, ?).
In addition, the literature has been emphasizing the importance of dynamic complementarities in the technology of skill formation. The idea is that the individuals with higher level of skills have higher benefits from investment in life (”skill begets skill”). Recently, the presence of dynamic complementarities has been tested in different set-ups. ? estimates the impact of an exogenous variation of access to better schools and of the family environment and the interaction between these two shocks on high-stakes-school-leaving-exams. They find that each one of the exogenous shocks has a positive impact on education, however the interaction is not significant. The authors suggest that the lack of dynamic complementarity is due to the fact that parents and students have endogenous responses to these shocks, attenuating the complementarities. Adhvaryu et al. (2015) test the impact of a cash incentive program for school enrollment (Progresa) in Mexico and shocks on parental resources (local rainfall) and of the interaction between them on educational attainment. They find evidence that exposure to Progresa remediates the effects of adverse early-life shocks. ? estimates the
1As defined by ?.
2? provides evidence for self-control predicting crime, health and wealth; personality, as measured by the Big Five Traits,
are related to health (?), scholastic achievement (?) and job performance (Barrick et al., 1998); for the Locus of Control, see below.
effect of the interaction between two early-life investments in Denmark on educational attainment. Using the variation in time in the implementation of the program among municipalities, they find that a negative interaction effect between the interventions, suggesting that the programs are substitutes.
There is evidence that the critical periods of cognitive skill development are the early periods of life, until 10 years of age. Cognitive skills seem to be stable at adulthood and decline at older ages. However, evidence shows that the socio-emotional skills are more malleable than the cognitive skills. These skills can have cumulative changes over the life cycle, presenting the greatest change after childhood and at adulthood. 3.If we find that individuals with higher socio-emotional skills have the higher impacts of the
intervention on cognitive skills, we can infer that improving the non-cognitive skill can increase the window of opportunity in which an intervention can affect the cognitive skills. Different from the literature about dynamic complementarities, we do not look the interaction effects between two types of investment or between family environment and the investment, we investigate the complementarities between abilities developed early in life and the investments.
The intervention consists in a program that combines activities using LEGO blocks with the core school curriculum. It was implemented in Recife (Pernambuco, Brazil) to 3rd and 5th grade students. During these activities, the students are divided in groups, and they need to assume specific roles in this group. For example, one student needs to lead the discussion, another one takes notes, etc. The idea is that the activities involve curriculum content (like math concepts, history,etc.) but also help students develop cognitive skills (like reasoning and problem solving) and socio-emotional skills (like leadership, extroversion, etc.). The schools that participate in program receive LEGO kits with manual instructions for teachers and students. In addition, the teachers receive specific training to implement these activities. In each classroom, the students did the LEGO activities (one-hour session) twice a week during the normal school hours. It was not an extra-curricular activity.
This article is also connected to the literature in Psychology and Education that estimates the impact of playing with building blocks at kindergarten with the development of cognitive abilities. ? and Jirout et at (2015) find a relationship between children’s play with building blocks and the development of spatial skills. ? finds a positive correlation between playing with LEGO at ages 3 to 4 and later school (elementary, middle and high school) achievement in Math. In addition, using a selection on observables approach and focus groups, ? finds a positive impact of the Lego Educational program in Peru on math test scores and school culture (measured by the change on teachers’ perceptions regarding pedagogy).
We conducted a randomized control trial with
Using an pairwise randomized experimented, we estimate the impact of the program on the cognitive and non-cognitive skills, and we investigate the 3xistence of dynamic complementarities between the exogenous intervention and previous acquired skills. The randomized experiment is used as an exogenous variation to estimate the impact of investments in cognitive development, and the skills at the baseline are used at ”proxies” to previous developed abilities. To the best of our knowledge, this is the first study that uses an RCT to investigate the impact of a building block program on cognitive and non-cognitive skills.
We collected two rounds of data in 2014 of third and fifth graders enrolled in 30 elementary public schools (15 participants and 15 control-group schools). In both baseline (prior to the program) and follow-up (by the end school year) rounds, we collected data on the students’ socio-emotional components (Big Five and Locus of Control) and five cognitive abilities: verbal-logical reasoning, abstract reasoning, spatial reasoning, numerical reasoning and logical reasoning. We also gathered administrative data from the SAEPE proficiency exam. The SAEPE exam is conducted by the Department of Education of the State of Pernambuco. We received the students test scores of the two proficiency tests: math and language. The baseline fieldwork was conducted in July; the follow-up and the SAEPE exams were conducted in December of the same year. The program was implemented in August on the participant schools. It is important to notice that we estimate the impact of the program in the short run, only six months after the implementation of the program.
The article presents four sections, besides this introduction. In the next section, we describe the back-ground of the intervention and our primary data collected in our field works and the secondary dataset. In sections 3 and 4, we present the main models used to estimate the impact of the program and to investigate the dynamic complementarity between previous skills and the investment, and also the main results of the estimation of these models. The last section presents our main conclusions.
2
Background, Evaluation Design and Data Description
2.1
The Lego Education Program
The Lego company was created in 1934. In 2012, its market share was 8.6% in the toys market which cor-responded to 84 billions U.S. dollars. Nowadays, LEGO has more than 75% of market share in the building blocks market. LEGO’s educational branch was created in 1981. The program targets preschool, elemen-tary, middle and high schools. According to the program, the teachers need to use the LEGO educational activities in their weekly classroom activities. LEGO’a team provides lessons exercises and planning that
are curriculum based. The LEGO material includes workbook for the students and for the teachers, and the building blocks. In addition, LEGO’s team provides teachers training and support for the schools. In the U.S., close do 20,000 schools teach different subjects using the LEGO Educational material. In Brazil, the program started in 2002 and has reached more than 8,000 schools. In Brazil, schools that participate in the LEGO program receive boxes with the LEGO blocks and handbooks with instructions for the teachers and the students. Teachers receive a 8 hours of initial training and continuous support along the calendar year. In each classroom, the students did the LEGO activities twice a week during the normal school hours. During the activities, the students are split in small groups of 2 to 4 students each.
The LEGO-ZOOM Program was implemented in Recife (Pernambuco, Brazil) to 3rd and 5th grade students in the second semester of 2014. Recife is a large city in the Northeast of Brazil, the capital of Pernambuco state. In the beginning of 2014, 30 municipal schools in Recife were randomly selected to participate in the evaluation4. Tables A.2 and A.3 in the appendix compares the characteristics of the 30 schools in the sample with all municipal elementary schools in Recife. The results show that this sample represents the universe of the municipal schools in Recife, since the characteristics of the sample are not statistically different from the characteristics of all the municipal schools in Recife. They have similar infrastructure, size, teacher’s characteristics and students’ proficiency. However, it is important to point out that Recife represents a vulnerable region in Brazil, with a Basic Education Development Index (IDEB) below the average index of the country. In 2015, the average IDEB of the municipal school in Recife was 4,6, while the average IDEB of all the municipal schools in Brazil was 5,3. Using the data of the National Exam for the 5th grades in Brazil (”Prova Brasil”) in 2013, only 18% of the students in the municipal schools in Recife were proficient in Math, and 22% of them were proficient in language. This numbers are higher for all the municipal schools in Brazil, 26% of the students at the Brazilian municipal schools were proficient in language, while 23% were proficient in Math.
2.2
Evaluation Design and Data
Since Recife is a large city with very heterogeneous regions in terms of socio-economic background, we stratified schools by geographic location, creating pairs of schools that were the closest in distance. Then, in each pair, we randomly allocated one school to participate in the program, and another one to be in the control group 5.On July of 2014 (before the implementation of the program), we conducted our baseline
4Appendix A.1 contains the list of schools that were randomly chosen to be in our sample
5Table A2 in the Appendix presents the 30 schools by treated and control group, and Figure A2 shows the location of the
survey. In this survey, we apply two different assessment to capture the cognitive and non-cognitive abilities. These tests took almost two hours. In the first hour, students took the cognitive tests, then they had a break of about 15 minutes, and in the second half, they answered the socio-emotional questionnaire. For the cognitive tests, we apply a battery of questions developed by ?. This battery includes the five tests described a the introduction: logical-verbal, abstract, spatial, numerical and logical. Each test has nine questions that need to be answered in 9 minutes. We evaluate the impact of the program in each of the five cognitive test and also on the average score of all tests. In order to measure the socio-emotional skills, we use the SENNA (Social and Emotional or Non-cognitive Nationwide Assessment) instrument developed by Instituto Ayrton Senna6. Based on the adaptation and translation of 10 instruments that could be applied in large scale to
measure the the BIG five non-cognitive abilities and locus of control, ? construct the items of the SENNA that present situations to the students, and the students need to say if that situation is similar to his/her behavior. The appendix includes examples of each battery of the cognitive test and of the socioemotional test. In addition, at the baseline, the school’s principal and the teachers filled socioeconomic background questionnaire. At the end of the school calendar year (December, 2014), we did another round of fieldwork. At the follow-up survey, we applied the same cognitive and socio-emotional instruments for the students. The municipal department of education at Recife reported that in the beginning of 2014, 3,505 students were enrolled at the 3rd and 5th graders of the 30 municipal schools in our sample. This total includes students that were enrolled but never attended classes in the enrolled school, students that were transferred to other schools in the middle of the school year or dropouts. So this number can be a upper bound of the universe of students in the schools of our sample. 2,427 students completed the cognitive tests in the baseline and 1,472 students answered the socio-emotional test. This difference is due to the fact that many students did not return after the break to continue the tests. At the follow-up, 2,698 students answered the cognitive tests and 1,927 completed the SENNA. At the end, we have information of the cognitive scores for 1,877 students in both fields (baseline and follow-up), and the socio-emotional scores for 1,008 students that participated in both fields.
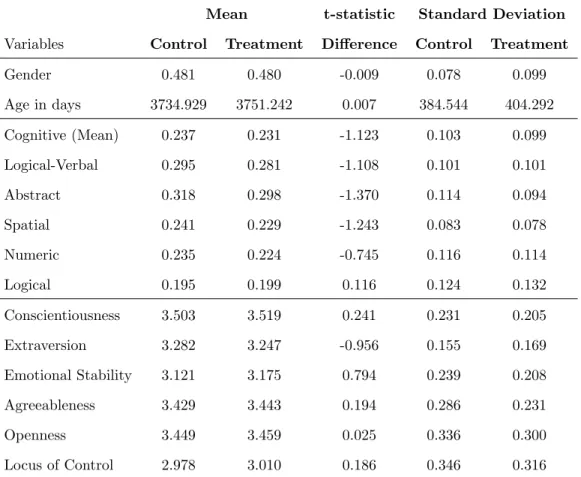
Using the Educational Census in Brazil in 2013, we compare the characteristics of schools in the treatment and control groups. Table 1 shows that the infrastructure of the schools in the control group is very similar to infrastructure of the schools at the treatment group. In addition, we compare the characteristics of the students in the control and treatment groups at the baseline. Table 2 shows that the two groups are very similar in age, gender and in all cognitive and non-cognitive measures. These results shows that the
randomization provides balanced between treatment and control groups, and that we can expect that the differences between the outcomes of these groups are due to the program. It is important to emphasize that the specific cognitive measures are the percentage of correct items in the specific exam, and the aggregate cognitive measure is the total of correct items among all the cognitive tests (including the five exams). The socio-emotional scores are measures by factors that are constructed based on a weighted average of the questions in the instruments SENNA. The weights were validated by ? in a large dataset in Brazil. All the factors are constructed in a monotonic way such that high values of the factors mean more of that specific ability. We measure internal locus of control, so the higher the factor, more internal is the student.
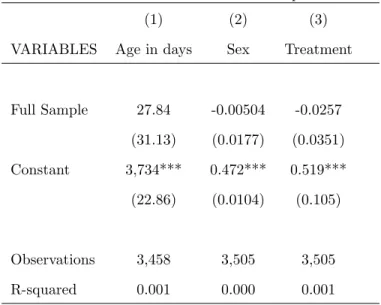
In this article, we use the sample of students that answered the cognitive tests in both fields (called full sample), baseline and follow-up. This corresponds to 54% of the students that were supposedly enrolled in 3rd and 5th grades of these 30 schools in the beginning of 2014. In addition, we have attrition between the two field works. Nevertheless, table 3 shows evidence that students in the full sample do not differ from the other students that were supposedly enrolled in 3rd and 5th grades in age, gender and treatment status. The results in this table are obtained by the regression of each variable (age, sex and treatment status) and a dummy variable that equals one if the student is in the full sample, and zero otherwise. In this table, we consider the whole sample of students that were supposedly enrolled in the beginning of the year. We only consider these three variables, because there are the only information that we have for the whole sample.
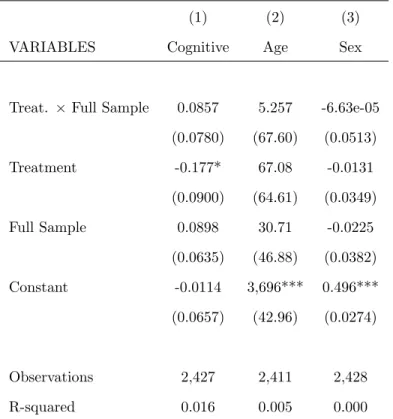
Now, we restrict the sample to the 2,428 students that completed the cognitive tests at the baseline. Table 4 shows the results of a regression of the three variables (age, sex and the aggregate cognitive score at the baseline) on a dummy variable that equals one if the student answered the cognitive test in both fields, and zero otherwise, a binary variable that indicates treatment and the interaction between these two dummy variables. If attrition creates unbalanced between treatment and group, we expect that this interaction would be significant. The results show that the attrition does not cause any unbalanced between the treatment and the control groups. Table 5 presents the results of a similar analysis, but now we look at the socio-emotional sample by using a dummy variable that equals 1 if the student answered any question of the SENNA at the baseline and follow-up, and interact this dummy with treatment status. The results show that there is balance between the treatment and control groups even in the presence of attrition. So, the results of tables 3-5 suggest that attrition is not causing any selection in the sample that can bias our results.
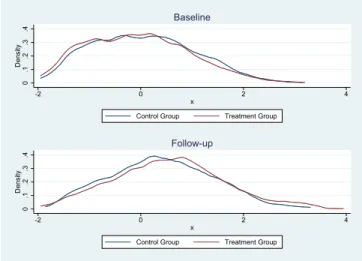
Before presenting our methodology and main results, we just plot the density of the average cognitive measure for controls and treatment groups at the baseline and at the follow-up. At the baseline, we find no evidence that the density curve for the control group is different from the density of the treated group. The
Komogorov-Smirnov test for the null hypothesis that the difference of the quantiles is equal to zero has a p-value of 0.57. At the follow-up, we find evidence that the differences between the densities of the control and treatment are significant. The p-value of the Komogorov-Smirnov test is 0.00. So this figure indicates that the program may have affected the cognitive scores of the treated group, increasing the mean score of the treated group in relation to the control group.
We combine our primary data-set with a secondary data-set called SAEPE (”Sistema da Avaliao Bsica de Pernambuco”). SAEPE is annual evaluation realized by the state government of Pernambuco, in which students at 3rd, 5th and 9th grades of elementary school, and at the senior year of high school at the municipal and state schools take standardized Math and language exams. The language and math test are constructed based on Item Response Theory. In 2014, SAEPE was applied by the end of the school year, two weeks prior to our last field collection. We match our primary data with the SAEPE proficiency results using the students’ name, school and classes. The students’ names in SAEPE are not well written. We could find many names with misspell letters. Given this limitation of the SAEPE data, we use the Levenshtein distance to match the names of our data set with SAEPE data-set7. At the end, we find 1,853 students that
answered both cognitive tests and have the language test scores, and 1,391 students that completed both cognitive tests, and have Math test scores.
7Levenshtein distance measure the minimum number of single-character edits necessary to change one string into the other.
We define the Levenshtein ratio as the distance between the names divided by the name in or base to match the students. Therefore, a student in SAEP in the same school, class and Levenshtein ratio below 20% of a student in our database as a match.
Table 1: Balanced Tests- Educational Census 2013
Variables
Mean Std. Dev.
Means Diff Control Treatment Control Treatment
Infrastructure Principal’s Office 0,93 0,8 0,26 0,41 -0,13 Teachers’ Room 0,53 0,33 0,52 0,49 -0,2 Computer Lab 0,93 0,8 0,26 0,41 -0,13 Library 0,4 0,6 0,51 0,51 0,2 Number of Classrooms 8,53 8,13 2,33 2,56 -0,4 Number of Computers 16,2 15 8,69 7,5 -1,2 Internet 1 1 0 0 0
Students and Classes
Third Grade Classes 3,2 3,2 1,21 1,47 0
Fifth Grade Classes 2,27 2,27 1,16 0,8 0
Third Grade Class Size 21,96 21,63 5,42 4,74 -0,33
Fifth Grade Class Size 22,17 22,98 4,75 5,37 0,81
Teachers’ Characteristics
% Tertiary education 0,94 0,97 0,14 0,07 0,03
% of teachers with 3 or more tenure years 0,96 0,96 0,14 0,14 0
% of teachers with 3 or more tenure years at this school 0,64 0,63 0,41 0,39 -0,01 Note: The data source used to construct the table is Censo Escolar (2013). Standard errors clustered in school level - in parentheses.*** means p-value <0.01, **p-value <0.05 and * p-value <0.1.
Table 2: Summary Statistics - Baseline
Mean t-statistic Standard Deviation
Variables Control Treatment Difference Control Treatment
Gender 0.481 0.480 -0.009 0.078 0.099 Age in days 3734.929 3751.242 0.007 384.544 404.292 Cognitive (Mean) 0.237 0.231 -1.123 0.103 0.099 Logical-Verbal 0.295 0.281 -1.108 0.101 0.101 Abstract 0.318 0.298 -1.370 0.114 0.094 Spatial 0.241 0.229 -1.243 0.083 0.078 Numeric 0.235 0.224 -0.745 0.116 0.114 Logical 0.195 0.199 0.116 0.124 0.132 Conscientiousness 3.503 3.519 0.241 0.231 0.205 Extraversion 3.282 3.247 -0.956 0.155 0.169 Emotional Stability 3.121 3.175 0.794 0.239 0.208 Agreeableness 3.429 3.443 0.194 0.286 0.231 Openness 3.449 3.459 0.025 0.336 0.300 Locus of Control 2.978 3.010 0.186 0.346 0.316
Note: This table was constructed with baseline data-set. Standard errors clustered in school level - in parentheses.*** means p-value <0.01, **p-value <0.05 and * p-value <0.1.
Table 3: Attrition Test - Full sample
(1) (2) (3)
VARIABLES Age in days Sex Treatment
Full Sample 27.84 -0.00504 -0.0257 (31.13) (0.0177) (0.0351) Constant 3,734*** 0.472*** 0.519*** (22.86) (0.0104) (0.105) Observations 3,458 3,505 3,505 R-squared 0.001 0.000 0.001 *** p<0.01, ** p<0.05, * p<0.1
Note: This table was constructed with baseline data-set. Standard errors clustered in school level - in parentheses.*** means p-value <0.01, **p-value <0.05 and * p-value <0.1.
Table 4: Atrition Test - Cognitive Sample*Treatment - Baseline
(1) (2) (3)
VARIABLES Cognitive Age Sex
Treat. × Full Sample 0.0857 5.257 -6.63e-05 (0.0780) (67.60) (0.0513) Treatment -0.177* 67.08 -0.0131 (0.0900) (64.61) (0.0349) Full Sample 0.0898 30.71 -0.0225 (0.0635) (46.88) (0.0382) Constant -0.0114 3,696*** 0.496*** (0.0657) (42.96) (0.0274) Observations 2,427 2,411 2,428 R-squared 0.016 0.005 0.000
Note: This table was constructed with baseline data-set. Standard er-rors clustered in school level - in parentheses.*** means p-value <0.01, **p-value <0.05 and * p-value <0.1.
Table 5: Atrition Test - Socio-Cognitive Sample*Treatment - Baseline
(1) (2) (3)
VARIABLES Cognitive Age Sex
Treat. × Socio Sample 0.0972 -66.21 -0.0144 (0.0719) (65.83) (0.0400) Treatment -0.170** 88.24* -0.00713 (0.0719) (46.44) (0.0208) Socio Sample 0.237*** 239.8*** 0.0367 (0.0495) (51.36) (0.0293) Constant -0.0319 3,626*** 0.463*** (0.0556) (35.40) (0.0168) Observations 2,427 2,411 2,428 R-squared 0.053 0.045 0.001
Note: This table was constructed with baseline data-set. Standard errors clustered in school level - in parentheses.*** means p-value <0.01, **p-value <0.05 and * p-**p-value <0.1.
0 .1 .2 .3 .4 Density -2 0 2 4 x
Control Group Treatment Group
Baseline 0 .1 .2 .3 .4 Density -2 0 2 4 x
Control Group Treatment Group
Follow-up
3
Impact of the Program
Since the schools were randomly assigned to the treatment or control group, we could estimate the impact of the program by simple regression model that relates the outcome of interest (skills’ measures) with a dummy that indicates the treatment status and another set of dummy variables that indicate the randomization pair. However, in order to increase precision, we include a vector of students characteristics (age, gender and the previous ability measure), a binary variable that indicates the grade of the student (3rd or 5th), and the school-pair fixed effects. This grade dummy variable is necessary to control for the fact that abilities change over the life cycle, and students at the 5th have a different ability level than students at the 3rd grade. We start by estimating the following model:
yist= α + β · Ts+ γ · yit−1+ θ · Xist+ η · pars+ εist (1)
where yit represents the outcome of interest for student i at school s at time t, Ts is the treatment dummy
at school level, Xitis the vector of controls that includes age, gender and a dummy variable that equals one
for the third grade, pars is a set of binary variable that indicates the randomization pair for school s and
εit is the idiosyncratic error. Since treatment is pairwise randomly assigned, εit is uncorrelated with the
treatment status and the other covariates in the regression. We estimate the standard errors by cluster at the school level.
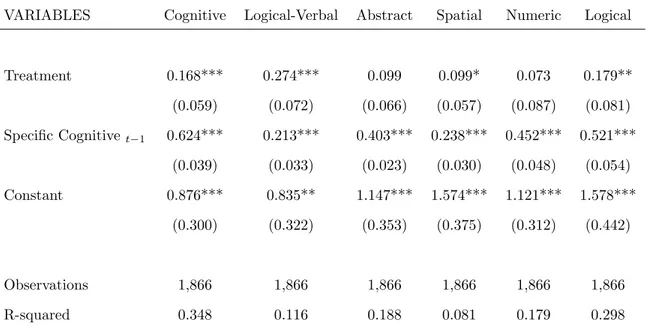
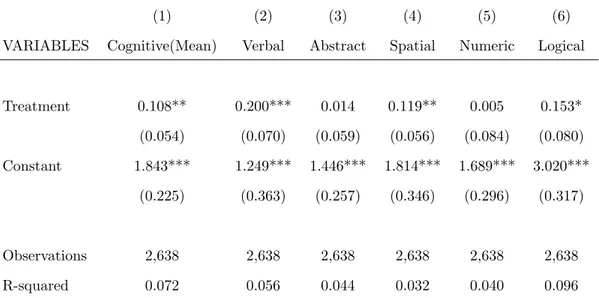
Table 6 presents the results of this main model considering the cognitive skills as the outcome of interest. This tables shows that the treatment has a positive and significant effect on the average cognitive measure, and in three specific cognitive abilities: Logical-Verbal, Spatial and Logical. This results confirm the previous results in the psychological and education literature that playing with blocks is related to the development of spatial and logical skills. In addition, the previous specific cognitive ability has a significant and positive correlation with future ability. Since schools were randomly assigned to treatment, we expect that the impact of program does not change when we exclude from the regression the past ability. Table 7 shows that the sign and significance of the coefficients do not change, but the magnitudes change. This change is explained by the fact that in these new results the sample included all the students that completed the cognitive tests at the follow-up, and not only the students in the balanced panel (students that completed the cognitive tests at the baseline and follow-up).
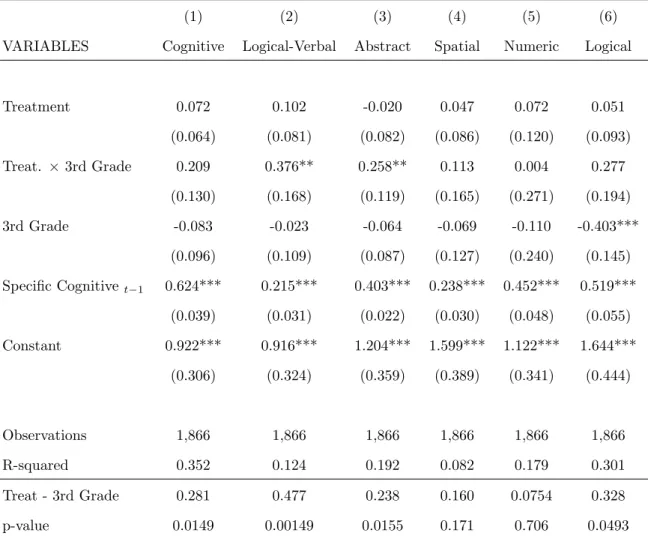
As discussed in the previous sections, there is evidence that skills change over the life cycle. Given that, we investigate if there are heterogeneous effects by grade. In order to do that, we include in the equation 1 a
interaction between dummy indicator of 3rd grade and the treatment indicator. Table 8 shows the treatment effects are always higher for the 3rd graders. The last two lines of the table shows the coefficient for the 3rd graders, and the respectively p-value. There is evidence that the intervention has a positive and significant effect on the average cognitive measure, and on other specific cognitive measures (logical-verbal, logical, abstract). This finding that the effects of the intervention for the 3rd graders is higher than for the fifth graders corroborates the theory that the cognitive skills are more malleable at younger ages.
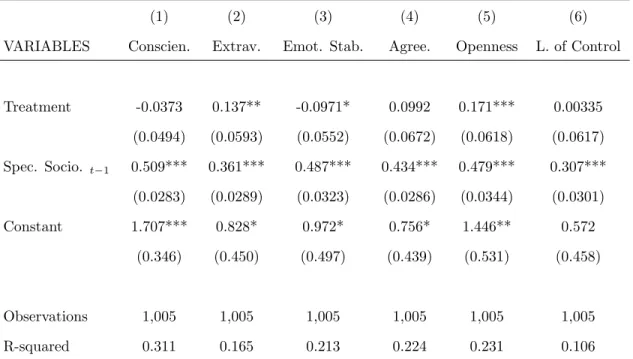
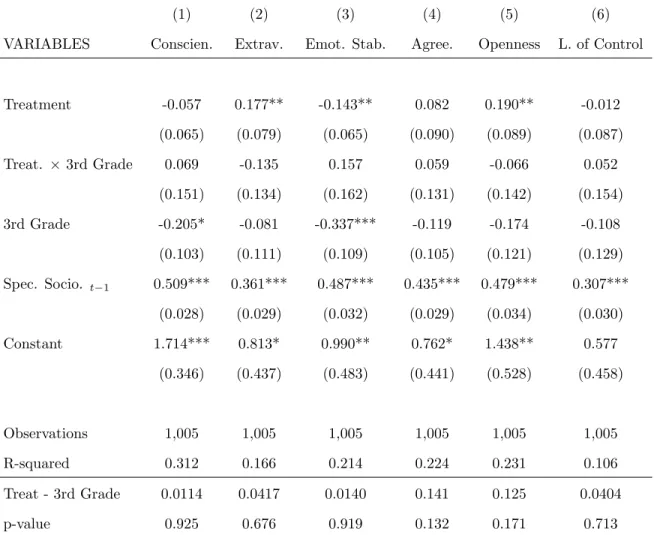
Now, we look at the impact of intervention in each of the socio-emotional skills. In Table 9 , the results show evidence of significant and positive effects on extroversion and openness, and a negative and significant effect on emotional stability. The effect on consciousness is also negative, but non-significant. There is not a robust pattern for the effect of the LEGO intervention on the socio-emotional skills. In addition, we look how the results vary by grade. Table 10 shows evidence that in contrast to the results on cognitive skills, the effects on socio-emotional skills seem to be more important for the 5th graders. The last two rows of the table show that the effects of the intervention on all non-cognitive skills are non-significant for the 3rd graders, but all the signs are positive. These results are in line with the evidence that the non-cognitive skills are more malleable throughout the life cycle.
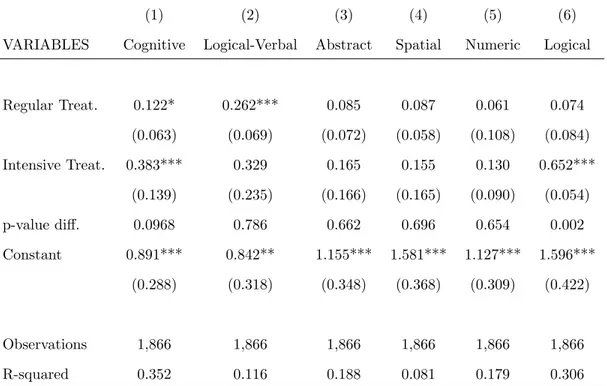
During the experiment, we randomly selected three treated schools out of the 15 to receive a more intensive treatment. Instead of two one-hour activities per week, these schools implemented two two-hour activities per week. At total, they had four hours of the LEGO program per week. The idea is to use these schools to test the intensive margin of the program. We changed in refeq1 by including two treatment indicator variables. The first dummy variable is equal to one if the school receive regular treatment, and zero, otherwise; and the second indicator variable equals one if the school received the intensive treatment, and zero, otherwise. At the bottom of this table, we present a test for the difference between these coefficients. Table 11 contains the coefficients for the cognitive outcomes. This table shows that the coefficients related to intensive treatment are always higher than the coefficient for the regular treatment, however due to the small sample size the test does not have power to reject the null that the coefficients are equal. Table 12 presents the results for the non-cognitive outcomes. In this case, the sign of the impact of intensive treatment on consciousness is statistically different from the sign of the impact of the regular treatment. In the case, of the intensive treatment has a positive effect on consciousness, and locus of control. In addition, the magnitudes of the coefficients of the impact of the intensive treatment on the other non-cognitive abilities are higher than the coefficients of the impact of the regular treatment.
SAEPE dataset. Table 13 contains the main results of this model. The first two columns of this table show the treatment effect without controlling for the cognitive and socio-emotional skills. The effect of the LEGO program is positive and significant on language test scores. The impact of the program on Math test scores is also positive, although non-significant. Columns (3) and (4) show the impact of cognitive aggregate measure and the socio-emotional skills on proficiency. These columns show positive and significant effects of the cognitive ability, conscientiousness and agreeableness on Math and language test scores. These results confirm some of the findings of the literature that conscientiousness has an important correlation with education achievement (Almlund et al., 2011). In addition, the results show a negative and significant impact of internal locus of control on language test scores. At columns (5) and (6), we estimate a model that includes the treatment indicator, the cognitive measure and the socio-emotional skills. The results indicate that the impacts of the LEGO intervention on the Math and language happen in a indirect way, throughout the development of the cognitive and non-cognitive skills. One possibility is that the treatment has an impact on the skills at the current moment (period t), but what matters for the Math and language scores are the abilities developed one period before (t-1). Table 14 contains the impact of the treatment on proficiencies, including the past abilities as controls in the place of current abilties. The results indicate a positive and significant impact of the intervention on language test scores, and confirms the evidence that previous cognitive skills have a positive and significant impact on test scores. The effects of the socio-emotional abilities on proficiency almost disappear. There is evidence of the negative and significant impact of previous locus of control on language test scores, and of a positive and significant impact of previous conscientiousness on Math test scores. Since we have evidence that the effects of the program on the abilities vary by grade, we would like estimate the models in Table 15 for the third and fifth grades, separately. For the third grades, table 15 shows a positive and significant effect of the program on language test scores without controlling for the cognitive and socio-emotional abilities, however this effect disappears when we control for the skills. The results confirm that for the 3rd graders, the impact of the program happen indirectly throughout the cognitive and non-cognitive skills. In addition, the results show evidence that the cognitive measure, conscientiousness and agreeableness have positive and significant effects on Math and language test scores. For the fifth grades, all the students that have a Math test scores in SAEPE are in the treatment group. So, for this case, we only estimate the impact of the program on language. In this case, the LEGO intervention has a positive effect on language proficiency even when we control for the cognitive and socio-emotional abilities. In all the specifications, there is a positive and significant impact of the cognitive measure on Math and language test scores. There is a very marginal effect of the non-cognitive abilities
on proficiency. There is a significant and negative impact of locus of control on language test scores, and a positive and significant effect of emotional stability on Math test scores.
At the end, the results show a positive and significant effect of LEGO intervention on the cognitive skills, specially on logical-verbal, logical and abstract abilities. The effects of the program on the socio-emotional abilities are not robust, showing non-significant effects on the majority of skills. In addition, the effect of the program on proficiency seems to happen indirectly throughout the development of skills, specially the cognitive skills. In the next section, we estimate the dynamic complementarity between the investment (LEGO program) and previous abilities.
Table 6: Impact of Treatment on Cognitive Skills
VARIABLES Cognitive Logical-Verbal Abstract Spatial Numeric Logical
Treatment 0.168*** 0.274*** 0.099 0.099* 0.073 0.179** (0.059) (0.072) (0.066) (0.057) (0.087) (0.081) Specific Cognitivet−1 0.624*** 0.213*** 0.403*** 0.238*** 0.452*** 0.521*** (0.039) (0.033) (0.023) (0.030) (0.048) (0.054) Constant 0.876*** 0.835** 1.147*** 1.574*** 1.121*** 1.578*** (0.300) (0.322) (0.353) (0.375) (0.312) (0.442) Observations 1,866 1,866 1,866 1,866 1,866 1,866 R-squared 0.348 0.116 0.188 0.081 0.179 0.298
Note: This table presents the OLS results of equation 1. This model also includes a gender dummy variable, age in month, a dummy variable for 3rd grade and the set of pair dummies as explanatory variables. The coefficients of these variables are omitted and available upon on request.Standard errors clustered in school level - in parentheses.*** means p-value <0.01, **p-value <0.05 and * p-value <0.1.
Table 7: Impact of Treatment on Cognitive Skills - No Lag
(1) (2) (3) (4) (5) (6)
VARIABLES Cognitive(Mean) Verbal Abstract Spatial Numeric Logical
Treatment 0.108** 0.200*** 0.014 0.119** 0.005 0.153* (0.054) (0.070) (0.059) (0.056) (0.084) (0.080) Constant 1.843*** 1.249*** 1.446*** 1.814*** 1.689*** 3.020*** (0.225) (0.363) (0.257) (0.346) (0.296) (0.317) Observations 2,638 2,638 2,638 2,638 2,638 2,638 R-squared 0.072 0.056 0.044 0.032 0.040 0.096
Note: This table presents the OLS results of equation 1. This model also includes a gender dummy variable, age in month, a dummy variable for 3rd grade and the set of pair dummies as explanatory variables. The coefficients of these variables are omitted and available upon on request.Standard errors clustered in school level - in parentheses.*** means p-value <0.01, **p-value <0.05 and * p-value <0.1.
Table 8: Impact of Treatment on Cognitive Skills - by Grade
(1) (2) (3) (4) (5) (6)
VARIABLES Cognitive Logical-Verbal Abstract Spatial Numeric Logical
Treatment 0.072 0.102 -0.020 0.047 0.072 0.051 (0.064) (0.081) (0.082) (0.086) (0.120) (0.093) Treat. × 3rd Grade 0.209 0.376** 0.258** 0.113 0.004 0.277 (0.130) (0.168) (0.119) (0.165) (0.271) (0.194) 3rd Grade -0.083 -0.023 -0.064 -0.069 -0.110 -0.403*** (0.096) (0.109) (0.087) (0.127) (0.240) (0.145) Specific Cognitivet−1 0.624*** 0.215*** 0.403*** 0.238*** 0.452*** 0.519*** (0.039) (0.031) (0.022) (0.030) (0.048) (0.055) Constant 0.922*** 0.916*** 1.204*** 1.599*** 1.122*** 1.644*** (0.306) (0.324) (0.359) (0.389) (0.341) (0.444) Observations 1,866 1,866 1,866 1,866 1,866 1,866 R-squared 0.352 0.124 0.192 0.082 0.179 0.301 Treat - 3rd Grade 0.281 0.477 0.238 0.160 0.0754 0.328 p-value 0.0149 0.00149 0.0155 0.171 0.706 0.0493
Note: This table presents the OLS results of equation 1. This model also includes a gender dummy variable, age in month, a dummy variable for 3rd grade and the set of pair dummies as explanatory variables. The coefficients of these variables are omitted and available upon on request.Standard errors clustered in school level - in parentheses.*** means p-value <0.01, **p-value <0.05 and * p-value <0.1.
Table 9: Impact of Treatment on Socio-emotional Skills
(1) (2) (3) (4) (5) (6)
VARIABLES Conscien. Extrav. Emot. Stab. Agree. Openness L. of Control
Treatment -0.0373 0.137** -0.0971* 0.0992 0.171*** 0.00335 (0.0494) (0.0593) (0.0552) (0.0672) (0.0618) (0.0617) Spec. Socio. t−1 0.509*** 0.361*** 0.487*** 0.434*** 0.479*** 0.307*** (0.0283) (0.0289) (0.0323) (0.0286) (0.0344) (0.0301) Constant 1.707*** 0.828* 0.972* 0.756* 1.446** 0.572 (0.346) (0.450) (0.497) (0.439) (0.531) (0.458) Observations 1,005 1,005 1,005 1,005 1,005 1,005 R-squared 0.311 0.165 0.213 0.224 0.231 0.106
Note: This table presents the OLS results of equation 1. This model also includes a gender dummy variable, age in month, a dummy variable for 3rd grade and the set of pair dummies as explanatory variables. The coef-ficients of these variables are omitted and available upon on request.Standard errors clustered in school level - in parentheses.*** means p-value <0.01, **p-value <0.05 and * p-value <0.1.
Table 10: Impact of Treatment on Socio-emotional Skills - by Grade
(1) (2) (3) (4) (5) (6)
VARIABLES Conscien. Extrav. Emot. Stab. Agree. Openness L. of Control
Treatment -0.057 0.177** -0.143** 0.082 0.190** -0.012 (0.065) (0.079) (0.065) (0.090) (0.089) (0.087) Treat. × 3rd Grade 0.069 -0.135 0.157 0.059 -0.066 0.052 (0.151) (0.134) (0.162) (0.131) (0.142) (0.154) 3rd Grade -0.205* -0.081 -0.337*** -0.119 -0.174 -0.108 (0.103) (0.111) (0.109) (0.105) (0.121) (0.129) Spec. Socio. t−1 0.509*** 0.361*** 0.487*** 0.435*** 0.479*** 0.307*** (0.028) (0.029) (0.032) (0.029) (0.034) (0.030) Constant 1.714*** 0.813* 0.990** 0.762* 1.438** 0.577 (0.346) (0.437) (0.483) (0.441) (0.528) (0.458) Observations 1,005 1,005 1,005 1,005 1,005 1,005 R-squared 0.312 0.166 0.214 0.224 0.231 0.106 Treat - 3rd Grade 0.0114 0.0417 0.0140 0.141 0.125 0.0404 p-value 0.925 0.676 0.919 0.132 0.171 0.713
Note: This table presents the OLS results of equation 1. This model also includes a gender dummy variable, age in month, a dummy variable for 3rd grade and the set of pair dummies as explanatory variables. The coefficients of these variables are omitted and available upon on request.Standard errors clustered in school level - in parentheses.*** means p-value <0.01, **p-value <0.05 and * p-value <0.1.
Table 11: Impact of Treatment on Cognitive Skills - Intensive Treatment
(1) (2) (3) (4) (5) (6)
VARIABLES Cognitive Logical-Verbal Abstract Spatial Numeric Logical
Regular Treat. 0.122* 0.262*** 0.085 0.087 0.061 0.074 (0.063) (0.069) (0.072) (0.058) (0.108) (0.084) Intensive Treat. 0.383*** 0.329 0.165 0.155 0.130 0.652*** (0.139) (0.235) (0.166) (0.165) (0.090) (0.054) p-value diff. 0.0968 0.786 0.662 0.696 0.654 0.002 Constant 0.891*** 0.842** 1.155*** 1.581*** 1.127*** 1.596*** (0.288) (0.318) (0.348) (0.368) (0.309) (0.422) Observations 1,866 1,866 1,866 1,866 1,866 1,866 R-squared 0.352 0.116 0.188 0.081 0.179 0.306
Note: This table presents the OLS results for the model that includes two indicators of treatment: a dummy variable for regular treatment, and another one for intensive treatment. This model also includes a gender dummy variable, age in month, a dummy variable for 3rd grade and the set of pair dummies as explanatory variables. The coefficients of these variables are omitted and available upon on request.Standard errors clustered in school level - in parentheses.*** means p-value <0.01, **p-value <0.05 and * p-value <0.1.
Table 12: Impact of Treatment on Socio-emotional Skills - Intensive Treatment
(1) (2) (3) (4) (5) (6)
VARIABLES Conscien. Extrav. Emot. Stab. Agree. Openness L. of Control
Regular Treat. -0.084 0.112 -0.080 0.053 0.147** -0.009 (0.053) (0.073) (0.069) (0.067) (0.062) (0.050) Intensive Treat. 0.133 0.229*** -0.158*** 0.270 0.261 0.048 (0.084) (0.061) (0.018) (0.159) (0.172) (0.222) p-value diff. 0.0339 0.227 0.283 0.214 0.536 0.804 Constant 1.742*** 0.848* 0.959* 0.792* 1.464** 0.581 (0.350) (0.458) (0.501) (0.448) (0.539) (0.464) Observations 1,005 1,005 1,005 1,005 1,005 1,005 R-squared 0.313 0.166 0.213 0.226 0.231 0.106
Note: This table presents the OLS results for the model that includes two indicators of treatment: a dummy variable for regular treatment, and another one for intensive treatment. This model also includes a gender dummy variable, age in month, a dummy variable for 3rd grade and the set of pair dummies as explanatory variables. The coefficients of these variables are omitted and available upon on request.Standard errors clustered in school level - in parentheses.*** means p-value <0.01, **p-value <0.05 and * p-value <0.1.
Table 13: Impact of Treatment on Math and Language Test Scores
(1) (2) (3) (4) (5) (6)
VARIABLES Language Math Language Math Language Math
Treatment 0.127*** 0.084 0.072 -0.024 (0.046) (0.062) (0.051) (0.075) Cognitive 0.598*** 0.602*** 0.598*** 0.603*** (0.044) (0.046) (0.044) (0.046) Conscientiousness 0.057** 0.085** 0.058** 0.085** (0.028) (0.034) (0.027) (0.034) Extraversion 0.049 0.030 0.048 0.031 (0.029) (0.022) (0.029) (0.022) Emotional Stab. 0.025 0.053** 0.026 0.053** (0.025) (0.026) (0.025) (0.026) Agreeableness 0.120*** 0.115*** 0.118*** 0.115*** (0.040) (0.037) (0.041) (0.036) Openness -0.012 -0.080 -0.015 -0.080 (0.034) (0.052) (0.034) (0.052) Locus of Control -0.106*** -0.026 -0.102*** -0.026 (0.028) (0.032) (0.028) (0.032) Constant 2.393*** 0.973* 0.928*** -0.176 0.881*** -0.151 (0.345) (0.509) (0.267) (0.404) (0.280) (0.433) Observations 1,853 1,391 1,342 952 1,342 952 R-squared 0.088 0.054 0.390 0.348 0.391 0.348
Note: This table presents the OLS results for the model uses Math and language test scores from the SAEPE data-set as the outcomes. This model also includes a gender dummy variable, age in month, a dummy variable for 3rd grade and the set of pair dummies as explanatory variables. The coefficients of these variables are omitted and available upon on request.Standard errors clustered in school level - in parentheses.*** means p-value <0.01, **p-value <0.05 and * p-value <0.1.
Table 14: Impact of Treatment on Math and Language Test Scores - Lag Abilities
(1) (2)
VARIABLES Language Math
Treatment 0.192*** 0.134 (0.045) (0.121) Cognitivet−1 0.562*** 0.538*** (0.052) (0.074) Conscientiousnesst−1 0.023 0.121** (0.036) (0.044) Extraversiont−1 0.048 0.031 (0.035) (0.057) Emotional Stab. t−1 0.052 0.041 (0.038) (0.041) Agreeablenesst−1 0.062 -0.014 (0.038) (0.064) Opennesst−1 0.055 0.070 (0.040) (0.067) Locus of Controlt−1 -0.078** 0.007 (0.032) (0.043) Constant 1.496*** -0.154 (0.370) (0.674) Observations 837 567 R-squared 0.321 0.251
Note: This table presents the OLS results for the model uses Math and language test scores from the SAEPE data-set as the outcomes. This model also includes a gender dummy variable, age in month, a dummy variable for 3rd grade and the set of pair dummies as explanatory variables. The coefficients of these variables are omitted and available upon on request.Standard errors clustered in school level - in parentheses.*** means p-value <0.01,
Table 15: Impact of Treatment on Math and Language Test Scores - 3rd Grade
(1) (2) (3) (4) (5) (6)
VARIABLES Language Math Language Math Language Math
Treatment 0.133** 0.083 0.056 -0.010 (0.060) (0.060) (0.075) (0.063) Cognitive 0.521*** 0.600*** 0.517*** 0.601*** (0.061) (0.051) (0.062) (0.051) Conscientiousness 0.168*** 0.163*** 0.169*** 0.163*** (0.052) (0.050) (0.053) (0.050) Extraversion 0.007 0.069 0.004 0.070 (0.046) (0.045) (0.046) (0.045) Emotional Stab. 0.009 0.011 0.009 0.011 (0.043) (0.035) (0.044) (0.035) Agreeableness 0.177*** 0.107** 0.176*** 0.108** (0.055) (0.041) (0.055) (0.042) Openness -0.154** -0.084 -0.156** -0.084 (0.060) (0.071) (0.061) (0.071) Locus of Control 0.014 -0.048 0.016 -0.048 (0.074) (0.069) (0.074) (0.069) Constant 2.007*** 0.855 1.113*** -0.127 1.079*** -0.122 (0.444) (0.560) (0.237) (0.371) (0.247) (0.377) Observations 905 909 535 533 535 533 R-squared 0.074 0.052 0.368 0.394 0.369 0.394
Note: This table presents the OLS results for the model uses Math and language test scores from the SAEPE data-set as the outcomes. This model also includes a gender dummy variable, age in month, a dummy variable for 3rd grade and the set of pair dummies as explanatory variables. The coefficients of these variables are omitted and available upon on request.Standard errors clustered in school level - in parentheses.*** means p-value <0.01, **p-value <0.05 and * p-value <0.1.
Table 16: Impact of Treatment on Math and Language Test Scores - 5th Grade
(1) (2) (3) (4) (5) (6)
VARIABLES Language Math Language Math Language Math
Treatment 0.153** 0.164*** (0.059) (0.053) Cognitive 0.680*** 0.691*** 0.689*** 0.691*** (0.045) (0.044) (0.044) (0.044) Conscientiousness 0.012 -0.024 0.018 -0.024 (0.040) (0.041) (0.041) (0.041) Extraversion 0.052 -0.016 0.055 -0.016 (0.036) (0.027) (0.036) (0.027) Emotional Stab. 0.041 0.129** 0.045 0.129** (0.032) (0.046) (0.032) (0.046) Agreeableness 0.077 0.108 0.067 0.108 (0.047) (0.068) (0.048) (0.068) Openness 0.042 -0.075 0.032 -0.075 (0.047) (0.082) (0.047) (0.082) Locus of Control -0.131*** -0.001 -0.120*** -0.001 (0.034) (0.027) (0.034) (0.027) Constant 2.333*** 0.862 0.495 -0.516 0.365 -0.516 (0.425) (0.591) (0.364) (0.586) (0.390) (0.586) Observations 948 482 807 419 807 419 R-squared 0.118 0.098 0.440 0.374 0.446 0.374
Note: This table presents the OLS results for the model uses Math and language test scores from the SAEPE data-set as the outcomes. This model also includes a gender dummy variable, age in month, a dummy variable for 3rd grade and the set of pair dummies as explanatory variables. The coefficients of these variables are omitted and available upon on request.Standard errors clustered in school level - in parentheses.*** means p-value <0.01, **p-value <0.05 and * p-value <0.1.
4
Dynamic Complementarities
In this section, we investigate the existence of dynamic complementarities between an exogenous investment in elementary education (The LEGO program) and the previous acquired skills. In order to investigate the existence of complementarities between the LEGO intervention and students’ previous skills, we estimate the following model:
yist= α + β · Ts+ δ · Sit−1× Ts+ γ · yit−1+ ρ · Sit−1+ θ · Xist+ η · pars+ εist
where yistis the cognitive outcome of student i at school s at time t, and Sit−1Sit−1is a skill measure in t − 1
(maybe different from yit). If δ is positive and significant, we have evidence of dynamic complementarity
between the exogenous intervention and the skill measured at the baseline.
Table 17 contains the results using the cognitive measures as outcomes, and estimating the heterogeneous effects by previous cognitive abilities. The interactions between previous cognitive abilities and treatment are not significant in most models, so we do not have evidence of complementarities between previous cognitive skills and the LEGO intervention. To investigate if these interaction effects vary grade, we estimate the model separately for 3rd and 5th graders. Tables 18 and 19 shows that the treatment effects on cognitive skills are stronger at the 3rd grade than at the 5th grade, and for both grades, we do not have evidence of complementarities between previous cognitive abilities and the investment.
Tables 20, 21 and 22 show the heterogeneous effects on cognitive measures by previous socio-emotional skills. Table 20 shows that the effects are higher for students with a higher level of socio-emotional skills, specially for more extroverted students and students with more agreeableness. We have evidence of dynamic complementarities between the exogenous investment and previous socio-emotional skills. We also estimate the same model for the 3rd and 5th grades separately, the results are in table 21 and 22 respectively. The results in these tables show evidence of dynamic complementarity between previous non-cognitive skills and investment in both grades, and the interaction effects are significant for extroversion in both grades, and for agreeableness in the 5th grade.
Figures 2, 3 and 4 show how these complementary effects (interaction effects) vary by the deciles of the socio-emotional skills. The first graph show that for the whole sample, the interaction effects are higher and significant for higher quantiles of previous socio-emotional abilities, except for emotional stability. The evidence shows that students with higher level of previous socio-emotional skills (Agreeableness,Extroversion, Openness to Experience and Consciousness) benefit more of the investment. For the 3rd graders, the figures
are more accentuated than for the 5th graders as we can see in graphs 3 and 4. Students at the 3rd graders with high socio-emotional skills (including emotional stability) benefit more from the LEGO program than students at the 5th graders.
So, we have evidence of strong dynamic complementarities between previous non-cognitive skills and the exogenous investment. The literature points out that non-cognitive skills are more malleable over the life cycle than the cognitive skills, and in this paper we have evidence that improving the socio-emotional skills of the individuals may increase the opportunity window that an investment can affect the cognitive development. Investing in socio-emotional is not only important for behavior and labor market outcomes, but also because these previous socio-emotional skills can help the development of the cognitive skills and increase the return of exogenous investments.
Table 17: Heterogeneous Impact on Cognitive by Previous Skills - Cognitive Abilities
(1) (2) (3) (4) (5) (6)
VARIABLES Cognitive Logical-Verbal Abstract Spatial Numeric Logical
Treatment 0.169*** 0.274*** 0.097 0.103* 0.073 0.181** (0.059) (0.071) (0.066) (0.054) (0.087) (0.081) Treat. × Cognit. t−1 -0.027 0.027 0.081* -0.136** 0.045 -0.058 (0.072) (0.066) (0.041) (0.055) (0.108) (0.099) Spec. Cognit. t−1 0.637*** 0.200*** 0.363*** 0.305*** 0.432*** 0.553*** (0.059) (0.033) (0.027) (0.041) (0.055) (0.077) Constant 0.881*** 0.833** 1.139*** 1.555*** 1.096*** 1.598*** (0.300) (0.322) (0.347) (0.376) (0.337) (0.434) Observations 1,866 1,866 1,866 1,866 1,866 1,866 R-squared 0.348 0.116 0.189 0.085 0.180 0.298
Note: This table presents the OLS results for the model in 4 using the cognitive measures as the outcomes and estimating the heterogeneous effects by previous cognitive measures. This model also includes a gender dummy variable, age in month, a dummy variable for 3rd grade and the set of pair dummies as explanatory variables. The coefficients of these variables are omitted and available upon on request.Standard errors clustered in school level - in parentheses.*** means p-value <0.01, **p-value <0.05 and * p-value <0.1.
Table 18: Heterogeneous Impact on Cognitive by Previous Skills - Cognitive Abilities - 3rd Grade
(1) (2) (3) (4) (5) (6)
VARIABLES Cognitive Logical-Verbal Abstract Spatial Numeric Logical
Treatment 0.270** 0.472*** 0.267*** 0.162 -0.017 0.340** (0.108) (0.126) (0.089) (0.100) (0.191) (0.164) Treat. × Cognit. t−1 -0.035 0.113 0.022 -0.125 0.032 -0.206 (0.137) (0.087) (0.083) (0.092) (0.193) (0.170) Spec. Cognit. t−1 0.530*** 0.099* 0.324*** 0.218*** 0.322*** 0.613*** (0.098) (0.054) (0.068) (0.074) (0.078) (0.130) Constant 0.825* 0.749 1.125** 1.103* 0.618 1.363 (0.477) (0.466) (0.501) (0.578) (0.390) (0.809) Observations 855 855 855 855 855 855 R-squared 0.227 0.107 0.127 0.073 0.156 0.250
Note: This table presents the OLS results for the model in 4 using the cognitive measures as the outcomes and estimating the heterogeneous effects by previous cognitive measures. This model also includes a gender dummy variable, age in month, a dummy variable for 3rd grade and the set of pair dummies as explanatory variables. The coefficients of these variables are omitted and available upon on request.Standard errors clustered in school level - in parentheses.*** means p-value <0.01, **p-value <0.05 and * p-value <0.1.
Table 19: Heterogeneous Impact on Cognitive by Previous Skills - Cognitive Abilities - 5th Grade
(1) (2) (3) (4) (5) (6)
VARIABLES Cognitive Logical-Verbal Abstract Spatial Numeric Logical
Treatment 0.067 0.076 -0.034 0.033 0.110 0.040 (0.059) (0.068) (0.082) (0.066) (0.085) (0.073) Treat. × Cognit. t−1 -0.050 -0.067 0.095 -0.143 -0.014 0.049 (0.087) (0.051) (0.067) (0.086) (0.061) (0.093) Spec. Cognit. t−1 0.727*** 0.299*** 0.417*** 0.376*** 0.568*** 0.556*** (0.077) (0.036) (0.055) (0.059) (0.043) (0.082) Constant 0.798*** 0.883** 0.988*** 1.677*** 1.339*** 1.491*** (0.182) (0.335) (0.325) (0.330) (0.380) (0.334) Observations 1,011 1,011 1,011 1,011 1,011 1,011 R-squared 0.493 0.141 0.251 0.134 0.301 0.409
Note: This table presents the OLS results for the model in 4 using the cognitive measures as the outcomes and estimating the heterogeneous effects by previous cognitive measures. This model also includes a gender dummy variable, age in month, a dummy variable for 3rd grade and the set of pair dummies as explanatory variables. The coefficients of these variables are omitted and available upon on request.Standard errors clustered in school level - in parentheses.*** means p-value <0.01, **p-value <0.05 and * p-value <0.1.
Table 20: Heterogeneous Impact on Cognitive by Previous Skills - Socio-Emotional Abilities
(1) (2) (3) (4) (5) (6)
Cog. by Cog. by Cog. by Cog. by Cog. by Cog. by
VARIABLES Conscien. Extrav. Emot. Stab. Agree. Openness L. of Control
Treatment 0.204*** 0.218*** 0.200*** 0.211*** 0.217*** 0.209*** (0.061) (0.061) (0.063) (0.061) (0.062) (0.063) Treat. × Socio. t−1 0.041 0.136*** 0.014 0.093* 0.073 0.052 (0.042) (0.038) (0.044) (0.046) (0.048) (0.048) Spec. Socio. t−1 0.075** -0.037 0.059** 0.008 -0.000 -0.090*** (0.033) (0.031) (0.025) (0.032) (0.034) (0.025) Cognitive t−1 0.635*** 0.661*** 0.655*** 0.652*** 0.661*** 0.663*** (0.043) (0.045) (0.048) (0.045) (0.046) (0.048) Constant 0.847** 0.903*** 0.940*** 0.935*** 0.910*** 0.964*** (0.309) (0.296) (0.272) (0.301) (0.300) (0.289) Observations 1,175 1,175 1,175 1,175 1,175 1,175 R-squared 0.402 0.398 0.396 0.397 0.393 0.396
Note: This table presents the OLS results for the model in 4 using the cognitive measures as the outcomes and estimating the heterogeneous effects by previous non-cognitive measures. This model also includes a gender dummy variable, age in month, a dummy variable for 3rd grade and the set of pair dummies as explanatory variables. The coefficients of these variables are omitted and available upon on request.Standard errors clustered in school level - in parentheses.*** means p-value <0.01, **p-value <0.05 and * p-value <0.1.
Table 21: Heterogeneous Impact on Cognitive by Previous Skills - 3rd Grade- Socio-Emotional Abilities
(1) (2) (3) (4) (5) (6)
Cog. by Cog. by Cog. by Cog. by Cog. by Cog. by
VARIABLES Conscien. Extrav. Emot. Stab. Agree. Openness L. of Control
Treatment 0.430*** 0.459*** 0.432*** 0.438*** 0.453*** 0.448*** (0.140) (0.148) (0.149) (0.146) (0.149) (0.151) Treat. × Socio. t−1 0.050 0.174** 0.045 0.134 0.109 0.133* (0.100) (0.072) (0.076) (0.090) (0.080) (0.072) Spec. Socio. t−1 0.176** -0.069 0.056 0.016 0.002 -0.112** (0.069) (0.061) (0.040) (0.049) (0.041) (0.050) Cognitive t−1 0.470*** 0.570*** 0.547*** 0.536*** 0.550*** 0.558*** (0.116) (0.123) (0.127) (0.120) (0.124) (0.126) Constant 0.725 0.756 0.842 0.787 0.669 0.784 (0.542) (0.588) (0.528) (0.592) (0.645) (0.575) Observations 375 375 375 375 375 375 R-squared 0.332 0.299 0.297 0.301 0.296 0.297
Note: This table presents the OLS results for the model in 4 using the cognitive measures as the outcomes and estimating the heterogeneous effects by previous non-cognitive measures. This model also includes a gender dummy variable, age in month, a dummy variable for 3rd grade and the set of pair dummies as explanatory variables. The coefficients of these variables are omitted and available upon on request.Standard errors clustered in school level - in parentheses.*** means p-value <0.01, **p-value <0.05 and * p-value <0.1.
Table 22: Heterogeneous Impact on Cognitive by Previous Skills - 5th Grade- Socio-Emotional Abilities
(1) (2) (3) (4) (5) (6)
Cog. by Cog. by Cog. by Cog. by Cog. by Cog. by
VARIABLES Conscien. Extrav. Emot. Stab. Agree. Openness L. of Control
Treatment 0.085 0.092 0.077 0.090 0.093 0.085 (0.061) (0.060) (0.062) (0.061) (0.060) (0.062) Treat. × Socio. t−1 0.033 0.139*** -0.019 0.090** 0.057 0.014 (0.044) (0.038) (0.048) (0.042) (0.044) (0.049) Spec. Socio. t−1 0.045 -0.039 0.077*** 0.006 -0.000 -0.069*** (0.026) (0.028) (0.025) (0.020) (0.028) (0.024) Cognitive t−1 0.704*** 0.711*** 0.708*** 0.707*** 0.717*** 0.715*** (0.050) (0.050) (0.050) (0.051) (0.052) (0.053) Constant 0.699** 0.700** 0.729*** 0.738** 0.756*** 0.763*** (0.275) (0.273) (0.256) (0.273) (0.261) (0.265) Observations 800 800 800 800 800 800 R-squared 0.495 0.499 0.496 0.498 0.492 0.495
Note: This table presents the OLS results for the model in 4 using the cognitive measures as the outcomes and estimating the heterogeneous effects by previous non-cognitive measures. This model also includes a gender dummy variable, age in month, a dummy variable for 3rd grade and the set of pair dummies as explanatory variables. The coefficients of these variables are omitted and available upon on request.Standard errors clustered in school level - in parentheses.*** means p-value <0.01, **p-value <0.05 and * p-value <0.1.
0 .1 .2 .3 .4 0 2 4 6 8 10 Socioemotional Deciles Treatment Effect 95 CI 95 CI
Impact by Conscien. Decile
0 .1 .2 .3 .4 .5 0 2 4 6 8 10 Socioemotional Deciles Treatment Effect 95 CI 95 CI
Impact by Extrav. Decile
.05 .1 .15 .2 .25 .3 0 2 4 6 8 10 Socioemotional Deciles Treatment Effect 95 CI 95 CI
Impact by Emot. Stab. Decile
0 .1 .2 .3 .4 .5 0 2 4 6 8 10 Socioemotional Deciles Treatment Effect 95 CI 95 CI
Impact by Agree. Decile
0 .1 .2 .3 .4 0 2 4 6 8 10 Socioemotional Deciles Treatment Effect 95 CI 95 CI
Impact by Openness Decile
0 .1 .2 .3 .4 0 2 4 6 8 10 Socioemotional Deciles Treatment Effect 95 CI 95 CI
Impact by L. of Control Decile
Figure 2: Heterogeneous Impact on Cognitive by Previous Socio-emotional Skills
.2 .4 .6 .8 0 2 4 6 8 10 Socioemotional Deciles Treatment Effect 95 CI 95 CI
Impact by Conscien. Decile
0 .2 .4 .6 .8 1 0 2 4 6 8 10 Socioemotional Deciles Treatment Effect 95 CI 95 CI
Impact by Extrav. Decile
0 .2 .4 .6 .8 0 2 4 6 8 10 Socioemotional Deciles Treatment Effect 95 CI 95 CI
Impact by Emot. Stab. Decile
0 .2 .4 .6 .8 1 0 2 4 6 8 10 Socioemotional Deciles Treatment Effect 95 CI 95 CI
Impact by Agree. Decile
.2 .4 .6 .8 1 0 2 4 6 8 10 Socioemotional Deciles Treatment Effect 95 CI 95 CI
Impact by Openness Decile
.2 .4 .6 .8 1 0 2 4 6 8 10 Socioemotional Deciles Treatment Effect 95 CI 95 CI
Impact by L. of Control Decile
-.1 0 .1 .2 .3 0 2 4 6 8 10 Socioemotional Deciles Treatment Effect 95 CI 95 CI
Impact by Conscien. Decile
-.2 0 .2 .4 0 2 4 6 8 10 Socioemotional Deciles Treatment Effect 95 CI 95 CI
Impact by Extrav. Decile
-.05 0 .05 .1 .15 .2 0 2 4 6 8 10 Socioemotional Deciles Treatment Effect 95 CI 95 CI
Impact by Emot. Stab. Decile
-.1 0 .1 .2 .3 0 2 4 6 8 10 Socioemotional Deciles Treatment Effect 95 CI 95 CI
Impact by Agree. Decile
-.1 0 .1 .2 .3 0 2 4 6 8 10 Socioemotional Deciles Treatment Effect 95 CI 95 CI
Impact by Openness Decile
-.05 0 .05 .1 .15 .2 0 2 4 6 8 10 Socioemotional Deciles Treatment Effect 95 CI 95 CI
Impact by L. of Control Decile
Figure 4: Heterogeneous Impact on Cognitive by Previous Socio-emotional Skills - 5th Grade
5
Conclusion
In this section, we present our main conclusions so far and future remarks. Using a randomized experiment in Recife (one of the largest city in Brazil), we find sizable short-run effects of the LEGO intervention on the cognitive measures. These effects are higher for children at early ages. This evidence supports the finding in the literature that the cognitive abilities are more malleable in early ages. In addition, we estimate a positive and significant effect of the program on language test scores, and we also find that this effect happens throughout the impact of the program on the development of cognitive and socio-emotional skills.
Moreover, we find strong complementarities between early socio-emotional skills and the exogenous in-vestments (LEGO program). Students with a higher level of non-cognitive skills benefit more from the intervention. This complementary effect happens for students at the 3rd and 5th grades. The development of non-cognitive skills are not only important because the well-documented effect of these skills on risk be-haviors and labour market outcomes, but also because these skills can increase the return of investments on the development of cognitive skills and increase the window of opportunity to change these cognitive skills. One question for further research is that if this complementarity with previous non-cognitive skills is
a particular characteristic of the building blocks program, or it can be find with other types of teamworks programs and investments.
References
Adhvaryu, Achyuta, Teresa Molina, Anant Nyshadham, and Jorge Tamayo, “Helping children catch up: Early life shocks and the progresa experiment,” Technical Report 2015.
Almlund, Mathilde, Angela Lee Duckworth, James Heckman, and Tim Kautz, Personality Psy-chology and Economics, Vol. 4 of Handbook of the Economics of Education, Elsevier, May/June
Barrick, Murray R, Greg L Stewart, Mitchell J Neubert, and Michael K Mount, “Relating mem-ber ability and personality to work-team processes and team effectiveness.,” Journal of applied psychology, 1998, 83 (3), 377.
A
Appendix
A.1
School Sample
Table A.1: School Sample
E.M. Alto Jardim Progresso E.M. Educador Paulo Freire E.M. Prof. Mauro Mota E.M. Bola Na Rede E.M. General San Martin E.M. Prof. Maria Da Paz Alves E.M. Capela Santo Antonio E.M. Jardim Uchoa E.M. Santa Cecilia
E.M. Casa Dos Ferroviarios E.M. Josefina Marinho E.M. Santa Maria E.M. Compositor Levino Ferreira E.M. Marluce Santiago E.M. Santo Amaro
E.M. Do Jordao E.M. Novo Pina E.M. Serra Da Prata
E.M. Do Leao E.M. Padre Jose Delgado E.M. Tres Carneiros
E.M. Dois Rios E.M. Presbitero Bezerra E.M. Vila Santa Luzia E.M. Dom Helder Camara E.M. Prof. Adauto Pontes E.M. Virgem Poderosa E.M. Draomiro Chaves Aguiar E.M. Prof. Manoel Torres E.M. Sao Domingos Note: This table contains the name of the 30 schools in Recife that were assigned to the evaluation
A.2
Representative Test
Table A.2: Similarity Test - Recife Municipality
Mean Standard Deviation Difference
All Selected All Selected of Means
Infra-structure Principal’s Office 0.8 0.87 0.4 0.35 0.07 Teachers’ Room 0.59 0.43 0.49 0.5 -0.15 Computer Lab 0.88 0.87 0.32 0.35 -0.02 Library 0.51 0.5 0.5 0.51 -0.01 Number of Classrooms 8.61 8.33 3.85 2.41 -0.27 Number of Computers 15.18 15.6 8.27 8 0.42 Internet 0.97 1 0.16 0 0.03
Students and Classes
Third Grade Classes 2.41 3.2 1.37 1.32 0.79*
Fifth Grade Classes 2.19 2.27 1.18 0.98 0.07
Third Grade Class Size 23.12 21.79 5.39 5 -1.33
Fifth Grade Class Size 24.7 22.59 6.07 5.01 -2.11
Note: The data source used to construct the table is Censo Escolar (2013) and Prova Brasil (2011). Standard errors clustered in school level - in parentheses.*** means p-value <0.01, **p-value <0.05 and * p-value <0.1.
Table A.3: Similarity Test - Recife Municipality
Mean Standard Deviation Difference
All Selected All Selected of Means
Teachers’ Characteristics
% Tertiary education 0.97 0.96 0.11 0.11 -0.02
% of teachers - 3 years + 0.89 0.96 0.23 0.14 0.07
% of teachers - 3 years+ at school 0.47 0.64 0.39 0.39 0.17* Prova Brasil
Port. Proficiency (5th grade) 170.87 172.49 12.7 10.8 1.62
Math Proficiency (5th grade) 186.2 189.46 13.52 10.98 3.25
Note: The data source used to construct the table is Censo Escolar (2013) and Prova Brasil (2011) . Standard errors clustered in school level - in parentheses.*** means p-value <0.01, **p-value <0.05 and * p-value <0.1.
A.3
Cognitive Instruments - Examples
Figure A.2: Visual-Spatial Test Example
Figure A.3: Logical Test Example
Figure A.5: Logical-Numerical Test Example