doi: 10.1590/0101-7438.2018.038.02.0247
METAHEURISTIC ANALYSIS APPLIED TO THE BERTH ALLOCATION PROBLEM: CASE STUDY IN A PORT CONTAINER TERMINAL
Elizangela Dias Pereira
1, Antonio S´ergio Coelho
1, Andr´e Andrade Longaray
2*,
Catia Maria dos Santos Machado
2and Paulo Roberto Munhoz
3Received September 20, 2016 / Accepted March 17, 2018
ABSTRACT.The simulated annealing (SA) and genetic algorithm (GA) metaheuristics are comparatively applied to the berth allocation problem (BAP) of a port container terminal. By synthesizing the experimental studies of the BAP available in the literature, the two methods are compared when applied to the same case. For this purpose, six test problems are considered, where SA and GA are compared using four crossover operators. Once the optimal GA crossover operator is determined, computational tests are performed with the data obtained at the port terminal to compare the performance of the two metaheuristics.
Keywords: berth allocation problem, genetic algorithm, simulated annealing.
1 INTRODUCTION
The rapid development of international trade and the transportation of containerized cargo have necessitated an increase in the size and number of vessels. This significantly affects the infras-tructure of container terminals. Hence, techniques are sought for assisting in the decision making that is necessary for the satisfaction of the growing demand for vessels, without increasing cost, whether due to delays in the service or inefficiency of the operation.
The search for an efficient logistics system that minimizes the waiting and service time for vessels prompted the formulation of anN p-hard combinatorial optimization problem known as the berth allocation problem (BAP) (Aykagan, 2008). An extensive review of BAP is found in the studies by Meersmans & Dekker (2001), Vis & Koster (2003), Steenken et al. (2004), Vacca et al. (2007), Stahlbock and Voß (2008), Bierwirth & Meisel (2010), and Rashidi & Tsang (2013).
*Corresponding author.
1Universidade Federal de Santa Catarina – UFSC. Programa de P´os-Graduac¸˜ao em Engenharia de Produc¸˜ao – PPGEP, Santa Catarina, Brasil. E-mails: eliz [email protected]; [email protected]
2Universidade Federal do Rio Grande – FURG. Programa de P´os-Graduac¸˜ao em Modelagem Computacional – PPGMC, Brasil. E-mails: [email protected]; [email protected]
BAP consists in allocating vessels to berthing positions in order that the pier space may be used to its maximum and the service time may thereby be minimized. The required decisions to be made relate to the position and time at which the vessel should berth Imai et al. (2008).
According to Yanasse (2013), it is important to attempt to formulate and analyze decision-making mathematical models that facilitate a better understanding of the systems under consideration. The analysis of models that represent combinatorial optimization problems is difficult; thus, it is challenging from the mathematical perspective. Moreover, it appears that there is a practical interest in the investigation of these models, which represent combinatorial problems, as their solution could lead to better use of limited resources, minimizing cost, and maximizing revenue.
In this regard, Guan & Cheung (2004) emphasized the need for implementing the algorithms for efficiently solving BAP. Thus, the proposed study – which is motivated by a real problem detected in Brazilian ports – develops a computational method for the discrete BAP that allows the qualitative evaluation of the behavior of the algorithms. There is growing interest in this class of algorithms, owing to their easy implementation and, in particular, their robustness in solving a large variety of problems.
Considering the significance of BAP for the operational efficiency of a port and that the elabo-ration of a berthing plan, i.e., the allocation of vessels to berths, is costly, owing to the number of variables involved in the problem, the use of a computational approach is of the utmost im-portance. The following objectives were considered in the study: the application of a Linear Programming mathematical model to solve a problem derived from real situations in the port sector; the implementation of the SA and GA algorithms; the development of computational methods for simulation tests of the SA and GA algorithms; the identification of the instances for which the performance of the SA algorithm is different from or similar to that of GA; the evaluation of the quality of the solution and the run time of the algorithms.
This paper is organized into five sections, including Introduction. In Section 2, a literature review is presented, highlighting the methods used for solving the berth allocation problem. Moreover, a synthesis of the results obtained in this study is provided, primarily for comparison of the used methodologies. In Section 3, the SA and GA metaheuristics are presented in detail and applied to BAP. In Section 4, the computational tests and the results obtained from the proposed scenario are presented and discussed. Section 5 concludes the paper.
2 BERTH ALLOCATION PROBLEM
vessel arrival and by berthing priority and condition, i.e., according to the time window offered by the terminal to the ship-owner, considering the total cost of the vessels in line.
The dock time window is a period of time offered by the terminal to the ship-owner on a given day to dock its vessel with the guarantee of a reserved space for berthing. This guarantees the payment of penalties by the terminal in case the vessel arrives during the given time window and is unable to berth owing to berth or pier space unavailability.
Therefore, the primary objective of BAP is the minimization of costs with respect to both the port and the ship-owner that are related to the service time; in this case, the total service time is considered to be from the moment of arrival of the vessel at the port to its berthing and deberthing.
The available models in the literature are classified according to spatial as well as time restric-tions. In regard to the spatial restrictions, the classification is performed according to the layout of the docking areas of the port. That is, BAP with discrete layout (DBAP) and BAP with con-tinuous layout (CBAP) can be defined. In DBAP, the docking area is partitioned in so called berths, where only one vessel can be served in a specific time interval, and the vessel’s length cannot be longer than the berth length. In CBAP, the docking area is not partitioned, i.e., the vessels may dock in any position along the wharf or pier (Imai et al., 2005b).
The time restrictions include arrival time, berthing time, and waiting time in line. Time restric-tions mainly occur in relation to the berthing and deberthing time. In the literature, the time restrictions have been classified as static arrival and dynamic arrival. In the former, it is assumed that all vessels are already in the anchoring area, ready to berth. Therefore, the arrival time can be disregarded. By contrast, in the latter, the vessels have different arrival times throughout the planning horizon; hence, they cannot berth before their arrival time. Thus, a sequence of ves-sel services should be performed, called vesves-sel line. BAP with dynamic arrival reflects the port management needs more accurately (Bierwirth & Meisel, 2010; Imai et al., 2001). Arrival time can be either deterministic or stochastic. In the deterministic case, arrival time is considered a fixed parameter of the problem. By contrast, in the stochastic case, the uncertainties in the ar-rival time, caused by problems in the ports or navigation problems, are taken into consideration. Several studies have addressed various characteristics of BAP. New mathematical formulations are considered in the discrete, continuous, as well as real cases.
Chart 1– Summary of the experimental studies of BAP in the literature.
Authors and title Studied Method(s) Summarized Conclusions
Imai et al. (2001) and Nishimura et al. (2001)
Minimize the total waiting and handling times for ev-ery vessel.
Lagrangian Relaxation (LR) and Genetic Algorithm (GA) applied to DBAP.
The calculations obtained with GA indicated the efficient use of 5 berths instead of 7 berths used in a Japanese public port. The tests (fictitious data) demonstrated that the quality of the solution obtained by the (GA) was the same/similar to the one obtained by the (LR).
Kim & Moon (2003)
Minimize the penalty cost resulting from delay and the additional han-dling costs resulting from non-optimal locations.
Simulated Annealing applied to CBAP.
The unfeasibility of the mixed-integer pro-gram (MIP) technique with 7 vessels was demonstrated, and theSimulated Annealing
algorithm was suggested.
Cordeau et al. (2005)
Minimize the sum for each vessel of the service time.
The Tabu search algorithm applied to DBAP.
It was demonstrated that the Tabu search algorithm outperformed both the first-come first-served rule and CPLEX.
Imai et al. (2008)
Minimize the total service time.
Genetic Algorithm applied to DBAP.
The number of rejected vessels owing to lack of service within the maximum time limit was minimized. The study is useful for the efficient management of extremely busy container terminals in underdeveloped coun-tries.
Theofanis et al. (2007)
Minimize the total weighted service time of all the vessels.
Optimization based GA heuristic (OBGA) and GA for DBAP.
Sensitivity analysis for the parameters of the OBGA and GA heuristics was performed. Both heuristics proved to be efficient, with small changes in the value of the objective function.
Mauri et al. (2008b)
Minimization of the num-ber of rejected vessels due to the lack of service within the maximum time limit established.
Minimization of the number of re-jected vessels due to the lack of ser-vice within the maximum time limit established.
Population Training Algorithm (PAT) in combination with Linear Programming (LP) for Column Generation for DBAP.
The results demonstrated the potential of the proposed approach, where high quality solu-tions were obtained for relatively large prob-lems, in significantly short processing time. Buhrkal et al. (2011)
Minimize the total waiting and handling times of ev-ery ship.
Generalized set-partitioning (GSPP) applied to DBAP.
The performance of five formulations of DBAPs was compared. It was claimed that the model proposed by Cordeau et al. (2005) is computationally advantageous. The re-sults obtained with GSPP were superior to those obtained by (Cordeau et al. 2005). Hu (2015)
Minimize the work of cargo operated at night-time.
The multi-objective GA (moGA) for the bi-objective DBAP.
Lalla-Ruiz et al. (2014)
Maximize the sum of the values of the chosen quay crane profiles and minimize the yard-related housekeeping cost.
Biased Random Key Genetic Algo-rithm (BRKGA) for DBAP.
The required computational time showed that, even in small-scale instances, the prob-lem is difficult to solve by CPLEX. The use of BRKGA was justified for the solution of the tactical berth Allocation problem in real-world contexts; particularly, in those inte-grated designs where this problem frequently appears as a sub-problem. Therefore, the use of efficient procedures that provide near-optimal solutions within short computational time is preferable.
Lalla-Ruiz et al. (2016b)
Minimize the total time re-quired for the vessels to pass through the water-ways.
Simulated Annealing for the Wa-terway Ship Scheduling Problem (WSSP) for (BAP).
Computational experiments showed that the problem is difficult to solve, even in small-scale instances, using a general-purpose solver. Nevertheless, the proposed S ap-proaches may provide high-quality solutions in short computational time. Moreover, the tests showed that the SA approaches are suit-able for contemporary problems.
Hsu (2016)
Minimize the total cost consisting of the sub-costs of waiting, delay and oper-ation.
Hybrid Particle Swarm Optimiza-tion (HPSO) for BAP.
The proposed HPSO was compared with the two GA-based approaches. Among the three approaches, HPSO required the longest, al-beit reasonable, computational time. Thus, it remains acceptable.
Mauri et al. (2016)
Minimize the sum of the service times while the vessels stay into the port.
Adaptive Large
Neighborhood Search (ALNS) DBAP and CBAP.
The computational tests indicated the rela-tive superiority of the ALNS heuristic for solving DBAP and CBAP. It determined all known optimal solutions for DBAP within shorter computational time. Better solutions were obtained for CBAP.
Venturini (2017)
Minimize the cost of idle-ness, delay, handling and the fuel consumption.
CPLEX A novel formulation was presented by inte-grating the BAP with vessel speed optimiza-tion for multiple ports under environmental considerations, in particular ship air emis-sions.
stud-ied. Moreover, in Hu (2015), berth allocation in daytime shift allocation was considered, and in Venturini (2017), the vessel’s speed and fuel consumption were studied.
This study, by considering a characteristic problem in ports in Brazil, is well-aligned with the studies performed with real data from the port of Kobe in Japan (Imai et al., 2001; Nishimura et al., 2001), the port of Gioia Tauro in Italy (Cordeau et al., 2005), and the port of the Yangtze River Delta in China (Lalla-Ruiz et al., 2016b). In particular, this study aims at identifying the behavior of the SA and GA interactive algorithms in a port terminal in Brazil.
2.1 Modeling for BAP
The mathematical model of BAP that motivated various studies was formulated by Legato et al. (2001) as a Multi-Depot Vehicle Routing Problem with Time Window. However, Mauri et al. (2008) reformulated the model as a Multi-Depot Vehicle Routing Problem WITHOUT Time Windows that is more tractable compared with the model described by Cordeau et al. (2005).
Formally, the classical vehicle routing problem (VRP), is defined using a graph G = (V,A), whereV = {v1, v2, . . . , vm} ∪V0is a vertex set and A= {e1,e2, . . . ,en}is a set of arcs. Each vertexvi ∈V−V0represents a client to be served, wherev0∈V0represents a berth. Moreover,
each arc(i,j)∈ Ais associated with a non-negative costci j, usually the distance between two vertices.
It is important to note that all routes have berths (v0)as start and arrival points and include
a subset of A. Each client has a demandq = 0 to be met by one of ther vehicles initially berthed in the berth and it can only be visited once. VRP consists in determining a set of routes for minimizing the sum of the costs attributed to the arcs of A. Moreover, special attention is drawn to the fact that the capacityQof the associated vehicle for each route should be respected. The multi-depot vehicle routing problem (MDVRP) is a generalization of VRP, where the set of verticesV is defined byV = {v1, v2, . . . , vm} ∪V0, whereV0 = {v01, v02, . . . , v0g}are the depots. The routeiis defined asRi = {g, v1, v2, . . . , vn, g}withg ∈V0andn =m. The cost
of a route can be calculated as in the classic VRP.
Therefore, in the BAP model, the vessels are regarded as clients and the berths as garages or depots (each with its own specific vehicle). There aremvehicles (one for each depot) and each vehicle starts and finishes its route in its own depot. The vessels are modeled as vertices in a multigraph, where each depot (berth) is still divided into an origin vertex and a destination vertex. These vertices are constructed to correspond to the operating period of the berths.
The model proposed by Cordeau et al. (2005) is discrete and can be represented by a multigraph Gk =(Vk,Ak),∀k∈ M, whereVk = N∪ {o(k),d(k)}, Ak ⊆Vk×Vk, andM andNare the set of berths and vessels, respectively.
Each berthk can be represented by a super vertex that contains two elementary verticeso(k)
andd(k) that correspond to the operating period of berthk. The routeR to berth kis the set Rk = {o(k), v1, v2, . . . , vn,d(k)}, where vessel v1 is the first vessel to be served in berthk,
following sets of variables and constants are considered: N = set of vessels;
M = set of berths;
xi jk ∈ {0,1},∀k∈ M,∀(i,j)∈ Ak, xki j =1 = if vessel jis served by berthk after vesseli;
Tik, ∀k∈ M,i ∈N = time at which vesseli berthed in berthk; Tok(k), ∀k∈ M = time at which the first vessel berthed in berthk; Tdk(k), ∀k∈M = time at which the last vessel berthed in berthk;
tik = duration of the service of vesseliin berthk; ai = time of arrival for vesseli;
bi = time at which the time window ends for vesseli;
vi = value (cost) of the service time for vesseli; sk = opening time for berthk;
ek = closing time for berthk;
Mi j =max{bi+tik−aj,0}, ∀k∈ M and ∀(i,j)∈N.
Minimize Z∗= i∈N
k∈M
vi
Tik−ai+tik
j∈N∪{d(k)}
xki j
(1)
Subject to: k∈M
j∈N∪{d(k)}
xki j =1, ∀i ∈ N (2)
j∈N∪{d(k)}
xok(k),j =1, ∀k∈ M (3)
i∈N∪{o(k)}
xki,d(k)=1, ∀k∈ M (4)
j∈N∪{d(k)}
xi jk − j∈N∪{o(k)}
xkj i =0, ∀k∈ M, ∀i ∈N (5)
Tik+tik−Tjk =(1−xi jk)Mi jk, ∀k∈ M,∀(i,j)∈ Ak (6)
Tik≥ai ∀k∈ M, ∀i ∈N (7)
Tik+tik j∈N∪{d(k)}
xi jk −bi ∀k∈ M, ∀i ∈N (8)
Tok(k) ≥sk ∀k∈ M (9)
Tdk(k) ≤ek ∀k∈ M (10)
Equation (1) represents the objective function (OF) that minimizes the time elapsed since vessel arrival, berthing, and service, with respect to the total allocation cost. Restriction (2) ensures that each vessel is allocated to a single berth, where vessel j is served after vesseli in berthk. Restriction (3) ensures that only one vessel will be the first to be served by each berth, i.e., there is only one vessel jthat will be joined to the origin vertexo(k). Similarly, restriction (4) ensures that a single vessel will be the last to be served by each berth; this vesseliwill be joined to the destination vertexd(k). Restriction (5) ensures the conservation of flow for the other vessels, i.e., the service for the vessels allocated to berthk, which will enter and exit the respective berth. Restriction (6) determines the calculation of the berthing time of the vessels that can be served by the berths. Restrictions (7) and (8) ensure that the berthing time will be after the arrival of the vessel, and that the time at which the service ends for a vessel will be prior to the limit time of the vessel (within the time window). Restrictions (9) and (10) ensure the non-violation of the time windows in the berths. Finally, restriction (11) ensures that the decision variables are binary.
2.2 Reformulation of the BAP Model
The reformulation of the model by Mauri et al. (2008) is as follows:
Minimize Z∗=w0
i∈N
k∈M
vi
Tik−ai+tik
j∈N∪{d(k)}
xi jk
(12)
+w1
i∈N
k∈M
j∈N∪{d(k)}
xi jk(max(0,ai −Tik)+max(0,Tik+tik−bi)) (13)
+w2
k∈M
(max(0,sk −Tok(k))+max(0,Tdk(k)+ek)) (14)
Subject to: k∈M
j∈N∪{d(k)}
xi jk =1, ∀i ∈N (15)
j∈N∪{d(k)}
xok(k),j =1, ∀k∈ M (16)
i∈N∪{o(k)}
xki,d(k)=1, ∀k∈ M (17)
j∈N∪{d(k)}
xi jk −
j∈N∪{d(k)}
xkj i =0, ∀k∈ M, ∀i ∈ N (18)
Tik+tik−Tjk =(1−xi jk)Mi jk, ∀k∈ M,∀(i,j)∈ Ak (19)
xki j∈ {0,1}, ∀k∈ M,∀(i,j)∈ Ak (20)
trans-ferred to expression (14). The other restrictions are retained; however, in the objective function, penalization factorsw= [w0, w1, w2]are added.
In this model, according to observations, the service time (with its associated cost value) is represented in expression (12). Expression (13) minimizes the violations of the time windows of the vessels. Likewise, expression (14) minimizes the violations of the time windows of the berths.
Analyzing the restrictions of the model above, we note that it relates to a Multi-Depot Vehicle Routing Problem WITHOUT Time Windows. The model could result in impracticable solutions for the BAP; however, these are eliminated through the penalization imposed by the factors
w= [w0, w1, w2]added to the objective function.
3 METHODOLOGY
A metaheuristic is a set of concepts that can be used to define heuristic methods applicable to an extensive set of different problems. A metaheuristic can be seen as a general algorithmic structure that can be applied to different optimization problems, with relatively few changes required for adaption to specific problems.
According to Pureza & Morabito (2003), one concept of metaheuristics is that they represent techniques that, when applied to local search methods, exceed local optimality and yield a solu-tion of the highest quality.
The SA and GA algorithms were designed to determine the minimum of a function that repre-sents some characteristic of the modeled process. The evolution of these algorithms in time is completely different. In its search process, SA uses a single point, always generating a new so-lution from it, which is tested and may be accepted or not. By contrast, GA uses a set of points called a population, from which another population is generated and is always accepted. The common characteristic of these two algorithms is that the next point or the next population are generated obeying the stochastic properties.
3.1 Initial Solution and Neighborhood Structure
The initial solution for the problem is obtained using two heuristics: the berth distribution heuris-tic and the vessel programming heurisheuris-tic. The distribution heurisheuris-tic is responsible for allocating the vessels to the berths and the programming heuristic determines the service time of the vessels in the berths.
3.2 Simulated Annealing Applied to BAP
The SA algorithm originated from an algorithm called Metropolis (1953), and Kirkpatrick et al. (1983) suggested its use in a computational environment. The basic principle of the algorithm is to allow selected solutions worse than the current solution to explore the neighborhood, thereby escaping the local minimum and enabling the search to reach regions that are more promising. The SA algorithm is described as follows:
1. GIVEN(α,S Amax,T0eTc)DO
2. GENERATE(a solutionSusing the distribution heuristic); 3. EVALUATE(solutionSusing the programming heuristic); 4. S∗←S;{Optimal solution obtained so far}
5. IterT←0;{Number of iterations at temperatureT}
6. T ←T0;{Current temperature} 7. WHILE(T >Tc)DO
8. WHILE(I ter T <S Amax)DO 9. IterT←IterT+1;
10. GENERATE(a random neighborS′through one of the swap mov); 11. EVALUATE(solutionS′using the programming heuristic); 12. ← f(S′)− f(S);
13. IF(<0)S←S′;
14. IF(f(S′) < f(S∗))S∗←S′;END IF 15. ELSE
16. TAKE(x∈ [0,1]);
17. IF(x<e−/T)S←S′;END IF 18. END IF
19. END WHILE
20. T ←α∗T; IterT←0;
21. END WHILE
22. S←S∗; 23. RETURN(S).
In line 1, the algorithm is started with the parameters used by Mauri et al. (2008). In line 2, there is an initial solution through the distribution heuristic. Initially,mempty berths are generated. The n vessels are organized in order of arrival at the port and are sequentially and randomly distributed in the berths; however, it is always verified whether the selected berth can serve that particular vessel.
In line 3, the initial solution is evaluated using the programming heuristic. The calculations of the berthing time of each vessel and the objective function are performed. In this heuristic, the superposition of times is eliminated with the calculation of the berthing time of the vessels.
In line 6, the initial temperature value(T0)is assigned toT. The parameterT0should be large
enough for all transitions to be initially accepted.
Lines 7 and 8 establish the stopping criteria. While the temperature is higher than the current temperature and the number of iterations is smaller than the maximum number of iterations, execute the step of line 10.
Line 9 represents the increase of iterations. Line 10 generates a random neighbor solutionS′ through one of the swap movements (reordering, reallocation, and swapping of vessels).
In line 11, the neighbor solutionS′is evaluated using the programming heuristic.
In line 12, the variation of the objective function (cost) is tested, i.e., = f(S′)− f(S). In line 13, if <0, the method accepts the solution and S’ becomes the new current solution.
In line 14, the current value is tested whether it is smaller than the stored valueS*. If positive, the value ofS′is accepted.
From line 15 to line 19, if≥0, the neighbor candidate solution can also be accepted; however, in this case, with probability ofe−/T, whereT is the parameter that regulates the probability of accepting worse cost solutions.
In line 20, after a fixed number of iterations (the number of iterations required by the system to reach thermal equilibrium at a given temperature), the temperature gradually decreases at a cooling rate ofα. In this procedure, at the beginning, there is greater chance to escape the local minima, and as T approaches zero, the algorithm behaves similarly to a descending method because the probability of accepting worsening movements decreases.
The procedure terminates when the temperature reaches a value close to zero (freezing tempera-ture:Tc) and solutions that worsen the value of the optimal solution are no longer accepted, i.e., when the system is stable. The solution obtained when the system is in this state indicates a local minimum, which, in some cases, is also a global minimum.
The reheating technique was also implemented to further improve the solutions obtained by SA. This technique consists in, after executing SA, applying it once again, using the optimal solu-tion obtained so far as the initial solusolu-tion. Different parameter values are used in the reheating. The initial temperature is reduced, compared with “normal” SA, and the maximum number of iterations increases. Hence, the search for better solutions intensifies in the spatial search region close to the initial solution, i.e., the reheating refines the solution obtained by SA.
3.3 Genetic Algorithm (GA) applied to the BAP
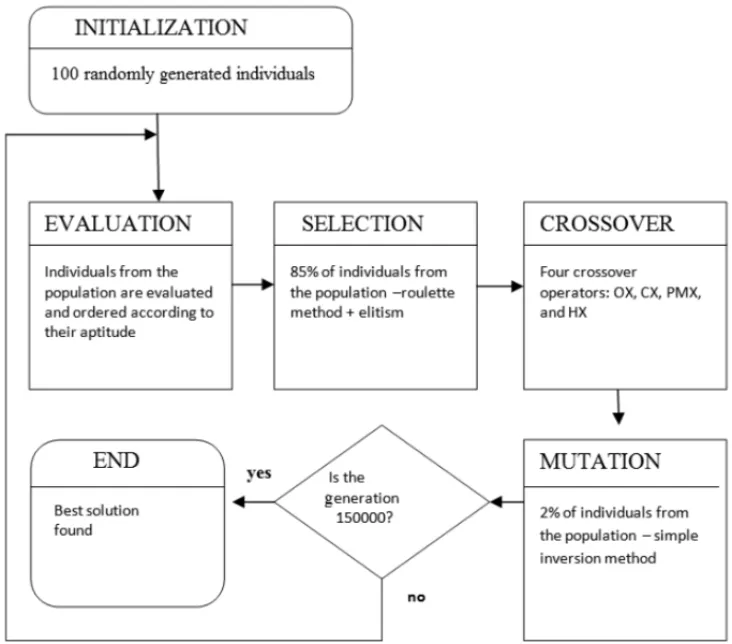
Figure 1–Flowchart for the execution of GA.
As in SA, the initial population for BAP is generated through the vessel distribution heuristic. The population size should range between 50 and 100 individuals because, depending on the pop-ulation size, the performance of the algorithm could be affected. Overly small poppop-ulations have lower diversity than that required for convergence to a satisfactory solution, with the possibility of premature convergence. Furthermore, overly large populations can affect the computational cost of the problem, as the search space could become excessively large. In the present study, the path representation was selected, where the individual is represented by a numeric vector; thus, the sequence represents vesselsNi to be allocated to a specific berthBk, as shown in Figure 2.
Figure 2–Chromosome Representation.
Evaluation of the Individuals
In this step, the same programming heuristic is used as in the SA algorithm, for determining the least costly programming of vessels, objective function, or aptitude (which minimizes the function). For each individual, the value of the objective function is calculated, and the best indi-viduals are selected to reproduce in the current generation. The indiindi-viduals are ordered according to their aptitude, i.e., their adaptation level with respect to the population where they belong.
According to Whitley (1994), the calculation of the aptitude function in GA could require a considerable amount of time, as for each iteration it is necessary to evaluate an entire popula-tion of potential solupopula-tions (individuals), rather than only one solupopula-tion, as compared with other optimization techniques.
Selection
The selection process of individuals from the population for reproduction is performed by the evaluation of the aptitude function of the individuals. The most apt individuals form an interme-diary population to which the crossover operators will be applied.
According to Beasley et al. (1993), the selection process has great influence on the behavior of GA, as the type of selection could cause premature convergence or unacceptably slow conver-gence. Hence, there is no definitive method, and there is a need for appropriate selections to address problem classes.
The selection operator used here was the roulette method, where the individuals to be selected are represented in a roulette according to their aptitude. In this method, the individuals are selected to be part of an intermediary population using the drawing roulette. The aptitude level of each individual is related to the portion occupied by the individual in the roulette, i.e., individuals of higher aptitude will have a larger section in the roulette. The present study also included the use of elitist selection, i.e., the most apt individual of a population automatically proceeds to the next population.
Crossover Operators
The crossover operator is the most significant part of GA. The operator performs the swap of parts of pairs of individuals in an attempt to obtain better individuals from the selected individuals. The probability ranges between 40% and 95%. In the implemented algorithm, the crossover rate was fixated at 85% for all operators.
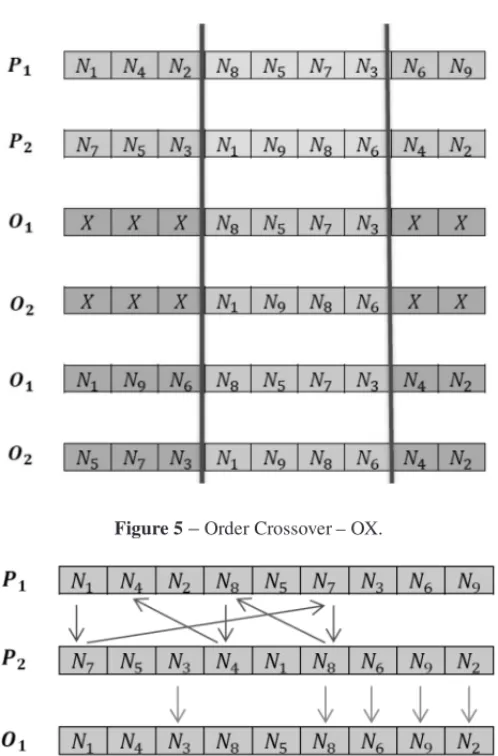
should be the same. The same occurs in the allocation problem: Although the order in which the vessels are served could vary, all vessels must be served. The recombination of two points selects two locations for the parent chromosomes to be sectioned. The entire section between these two points is changed, resulting in two different chromosomes. In this case, the offspring generated by each set of parents could often result in offspring with duplicated vessels, while some vessels may not appear on the list. Figure 3 illustrates this situation.
Figure 3–Multipoint crossover – GA.
In the example above, the offspringO1is missing vesselsN3,N5, andN7, and has the duplicates
of vessels N1,N6, andN9. Likewise,O2has vessels N3,N5, andN7duplicated and is missing
vesselsN1,N6, andN9.
Partially-Mapped Crossover (PMX)
To solve the abovementioned problem, other types of crossover have been studied, for instance, Partially-Mapped Crossover (PMX). In PMX, a tournament subsequence of one of the parents is selected, preserving the order and position of as many positions as possible from the other parent.
A subsequence is first demarked by two sectional points. Then, the segments between the sec-tional points are swapped. A series of mappings is extracted from the swapped segment. In the example below: N1 ↔ N8,N9 ↔N5,N8 ↔ N7, andN6↔ N3. The second step is to fill all
positions where there is no conflict; in the example shown in Figure 4, this corresponds to posi-tionsN4andN2in both chromosomes. The last step is to use the mappings to fill the remaining
positions, previously marked withX. Using theN1↔ N8, mapping in vectorO1there is, once
again, a conflict; therefore, the mappingN8↔N7should be used to obtain an unrepeated gene.
The positions inO1andO2relative to the duplicated elements are shown in Figure 4.
Order Crossover (OX)
Figure 4–Partially-Mapped Crossover – PMX.
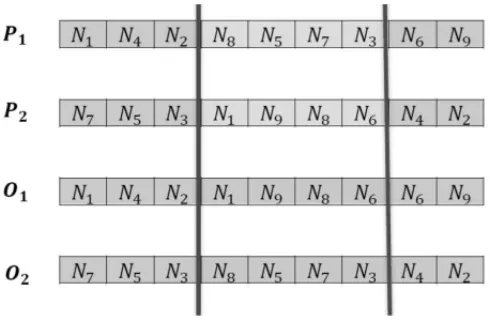
the positions of the other parent are copied in the same order, disregarding the symbols that are already present. Reaching the end of the chain, it moves to the beginning of the chain. In the example shown in Figure 5, chromosomeO2is filled according to the sequence N6 → N9 →
N1→N4→ N2→N8→N5→ N7→N3in the positions that are still not present. Positions
N4,N2,N5,N7, andN3are filled. The same procedure is followed for chromosomeO1,
follow-ing the listN4 → N2 → N7 → N5 → N3 → N1 → N9→ N8 → N6. Hence, the following
positions are filled:N4,N2,N1,N9, andN6.
Cycle Crossover (CX)
The CX operator preserves the absolute position of the vessels in the parent chromosomes. The first offspring is obtained with the repetition of the first vessel fromP1, the position
correspond-ing to this vessel is searched inP2, and the vessel will be inherited, preserving the position
oc-cupied inP1. The procedure continues until the chromosome is filled. In case a cycle is formed,
the positions will be occupied by individuals from P2. Figure 6 shows the scheme of CX. The
first vessel of P1 is repeated in O1, the corresponding vessel in P2is N7, which is copied in
O1, preserving the position occupied in P1. The same is repeated for N8,N4, andN5when the
corresponding vessel in P2 finishes one cycle. Henceforth, the offspringO1 is filled with the
individuals fromP2, preserving the order occupied in the chromosome.
Heuristic Crossover (HX)
Figure 5–Order Crossover – OX.
Figure 6–Cycle Crossover – CX.
1. Select a random vessel from one of the parent chromosomes.
2. Compare the allocation costs for the next vessel in both parents and select the smallest.
3. If the lowest cost selected forms a cycle in the partial route, then choose a random cost that does not introduce a cycle.
4. Repeat steps 1 and 3 until all vessels are included in the berth.
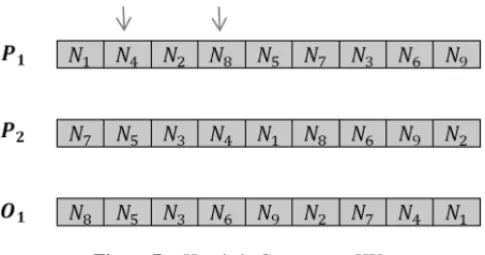
Figure 7 shows an example of the HX crossover where vessel N8was randomly selected;
there-fore, the allocation cost for N5and N6 is analyzed, which are the next vessels in P1 and P2,
respectively. Assuming that the lowest cost corresponds to the sequence N8 → N5, the cost
analysis is performed for the next allocation. With regard to vessel N7, there is a cycle; hence,
any vessel that does not introduce a cycle is randomly selected. In this example, vessel N4was
Figure 7–Heuristic Crossover – HX.
Mutation
From the selected individuals, the mutation operator performs random swaps of some genes of the individuals, enabling the study of new areas in the search space. Therefore, it avoids premature convergence of the population, maintaining the population diversity, and avoiding local minima.
In the reviewed literature, the mutation rate should be predicted within a range of 1% to 5%.
The implemented mutation operator was that of simple inversion proposed by Michalewicz (1992), where two points are randomly selected in the chromosome and the subsequence be-tween them is inverted.
In this study, the operator was applied to each chromosome in the population with a probability of 2%.
Stop Criterion
Several criteria can be chosen to terminate the execution of GA: after a given number of gener-ations (total evolutionary cycles), when there is no further improvement of the average aptitude or the best individual, when the aptitudes of the individuals from a population become similar, or when the diversity in the population is lost.
In this study, the selected stop criterion was the maximum number of generations, which was set at 150.000.
4 COMPUTATIONAL TOOL DEVELOPMENT
Recently, optimization tools have been increasingly used in simulators (Pureza & Morabito, 2003; Cherri et al., 2013). Moreover, approximation or heuristic algorithms as well as simulation tools have been combined with optimization tools.
The computational tool is fed by data about the date and time of arrival of the vessels, the duration of the time window (time period offered by the terminal to the ship-owner in order that the vessel, on a specific day, have the guarantee of space reserved for its berthing or the payment of penalties by the terminal if the time window is reached and the vessel cannot be berthed owing to lack of available berth). The computational tool offers some flexibility to the user with respect to the use of the algorithms. In the GA simulation, the crossover operators, the number of iterations (generations), and the mutation rate can be selected. These alternatives are used for adjusting the parameters in the algorithm, affecting the simulation of the problem. In the SA simulation, the initial solution can be obtained by four methods: user definition, movement swap, setting vessels in berths, and rejecting vessels; all these options are detailed in Rodrigues (2013). Moreover, the SA algorithm can be executed with or without the reheating procedure. The operational cost for each day of berth allocation is provided by GA and SA, which allow the daily follow-up of the solutions.
The interface of the developed tool allows the generation of a report on the data of the vessels, that is, a list of vessel arrivals and a list of berths (capacity, opening and closing times). Furthermore, all the results obtained in the process, the optimal solutions obtained, and the parameters in the application of the SA and GA metaheuristics are recorded. Moreover, in the case of SA, the total reallocation, reordering, and swap movements of the vessels are recorded. This allows for better evaluation of the neighborhood structure that uses the three movements, and the choice is made in a random but uniformly distributed manner. It should be emphasized that the application offers the option of securing vessels to the berths, as, in real situations, it may happen that a vessel can only be allocated in a berth appropriate to its type of cargo.
4.1 Computational Tests
The computational tests were performed on a PC with an Intel Pentium R Dual-Core T4400 2.20 GHz CPU and 4 GB of RAM. The implementation was developed in the Delphi language based on Object Pascal (Pascal with object-oriented extensions) because it allows the inclusion of different simulation tools and the representation of dynamic aspects, increasing the model’s accuracy.
The first computational tests were performed to measure computational time and the quality of the solution in regard to the crossover operators used in GA and the randomly applied swap movements in SA. The performance of these tests was used to demonstrate the quality of the solution obtained by the HX crossover operator, which used in the comparison of the SA and GA algorithms, in the allocation of 62 vessels to 3 berths of a container terminal. Hence, 6 test problems with real data were run 10 times each, involving 35, 55, and 62 vessels allocated to 5 and 10 berths. The mean results are presented in Tables 1, 2, 3, 4, 5, and 6, as follows:
Table 1–35 vessels and 5 berths.
Genetic Algorithm Simulated Annealing Simulated Annealing + Reheating Technique
Crossover operation O.F. Time O.F. 55,842.80 O.F. 55,212.83
OX 55,212.83 4’ Time 11’25” Time 43’09”
CX 55,212.83 3’58” PMX 55,212.83 3’15” HX 55,212.83 9’12”
Table 2–35 vessels and 10 berths.
Genetic Algorithm Simulated Annealing Simulated Annealing + Reheating Technique
Crossover operation O.F. Time O.F. 55,292.80 O.F. 54,672.83 OX 54,672.83 4’08” Time 8’27” Time 22’40” CX 54,672.83 3’24”
PMX 54,672.83 3’22” HX 54,672.83 7’06”
Table 3–55 vessels and 5 berths.
Genetic Algorithm Simulated Annealing
Crossover operation O.F. Time O.F. 134,334.70 OX 129,489.00 6’30” Time 20’35” CX 129,489.00 6’26”
PMX 129,489.00 6’30” HX 129,489.00 16’27”
Table 4–55 vessels and 10 berths.
Genetic Algorithm Simulated Annealing Crossover operation O.F. Time O.F. 127,149.80
OX 128,137.83 6’44” Time 14’25” CX 127,689.81 6’50”
PMX 126,534.83 5’43” HX 126,534.83 11’45”
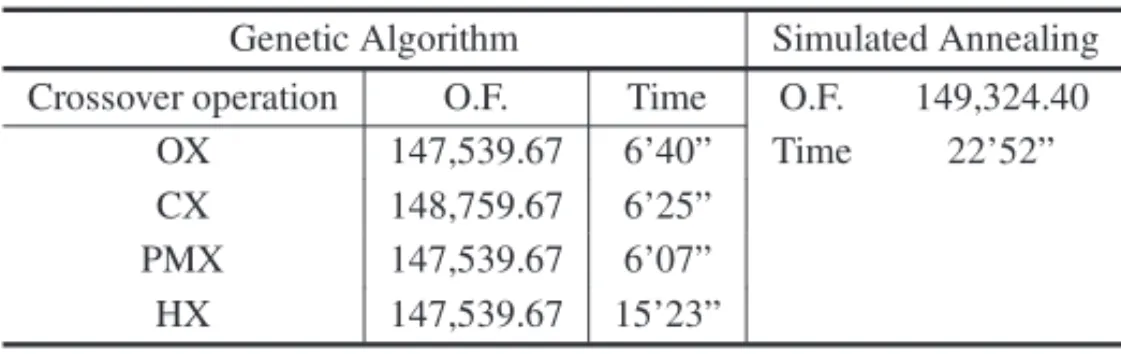
Table 5–62 vessels and 5 berths.
Genetic Algorithm Simulated Annealing
Crossover operation O.F. Time O.F. 149,324.40 OX 147,539.67 6’40” Time 22’52” CX 148,759.67 6’25”
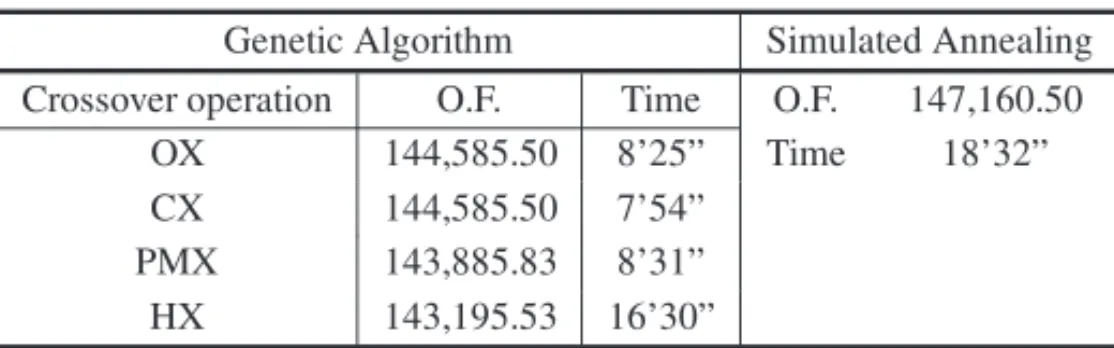
Table 6–62 vessels and 10 berths.
Genetic Algorithm Simulated Annealing
Crossover operation O.F. Time O.F. 147,160.50 OX 144,585.50 8’25” Time 18’32” CX 144,585.50 7’54”
PMX 143,885.83 8’31” HX 143,195.53 16’30”
PMX. The (SA + Reheating) combination yielded the same solution as GA, with significantly longer computational time. In the problems involving 55 and 62 vessels, the optimal solution was obtained with the HX operator. Some tests were performed with (SA + Reheating); however, the computational time was longer than 45 min, yielding no better solutions than with GA. In all instances, the HX operator yielded the optimal solutions.
Considering the performed tests and the evidence of the local search procedures used by the SA and GA algorithms, special attention should be drawn to the qualitative evaluation of their behavior.
The scenario of analysis was derived from real situations found in the programming of vessels at a container terminal that uses three berths. This information is available on the website of Terminal de Conteineres – TECON RioGrande S/A(http://www.teconline.com.br).
The tests were performed based on a terminal with three operating berths of fixed length and a total of 62 vessels, with the following information: predicted time and date of arrival, length (meters), service time (00:00’00”), duration of time window (00:00’00”), and value in current currency of service time per minute. Some of these data are fictitious, for instance, the service cost, as it was not provided by the container terminal.
The parameters used for SA, according to Mauri (2008), were: α = 0.975, Ti = 40,000, Tc = 0.01, and S Amax = 1,000. For the reheating, the parameters were α = 0.975, Ti = 10,000,Tc =0.01, andS Amax=2,000. The parameters used for GA were: population size of
100 individuals, 150,000 generations, crossover rate of 85%, and mutation rate set at 0.02. The penalties used for the objective function for the reformulated model werew= [1,10,10].
4.1.1 Obtained Results
30 tests were performed for each metaheuristic, for the same instance (62 vessels, 03 berths). These provided data for the final objective function as well as the run time for each metaheuristic. For the first analysis, the graph shown in Figure 8, which compares the values of the objective function for each test, indicates the less volatile behavior of GA, as the values obtained for the objective function range from 185,000 to 190,000, whereas the SA exhibits greater variations.
Figure 8–Comparative graph of the Final Objective Function.
This may be attributed to the difference between the neighborhood structures of each heuristic, as in SA, movements are randomly performed, whereas in GA, the selected crossover operator mandatorily performs all swap, reordering, and reallocation movements.
Figure 9–Comparative graph of run time.
Using the data obtained from a sample of 30 tests, the average run time and final OF were estimated, assuming that they represent the corresponding true values of the population, which are unknown. These and other estimations are presented in Table 7.
Table 7–Estimations.
Estimations Metaheuristics
Simulated Annealing Genetic Algorithm
Average Timext 29’04” 20’50”
Final OF Averagexf 194,073.97 185,951.42
Based on these estimations, the GA metaheuristic is more efficient than the SA metaheuristic in terms of the final OF and run time, as the objective of BAP is to minimize OF with the use of computationally efficient tools.
The consistency of the solution can be determined by calculating the standard deviation and the coefficient of variation. Both demonstrate that the values for OF and run time tend to be closer to the average in the case of GA.
4.1.2 Discussion
An important observation related to the number of vessels that were not allocated owing to viola-tion of the time window is that GA allows the allocaviola-tion of more vessels within the time window, which leads to a smaller cost in the objective function.
There is an apparent problem, namely, the implemented metaheuristics do not consider the possi-bility of interruptions in the service time due to the closing/opening of the berth, i.e., each vessel starts and concludes its operation on the same day. The vessels that are unable to conclude the operation on the day of their arrival are allocated at the first available time after 00’00” (min/s) on the following day.
For academic purposes, the analyses presented here are based on the results obtained using the GA and SA metaheuristics; however, the evaluation of their efficiency would require the compar-ison of these results with real data, which unfortunately are not available. Nevertheless, the GA metaheuristic implemented in the present study yielded better results. This implies a reduction in the operational costs of a terminal, the primary objective of BAP.
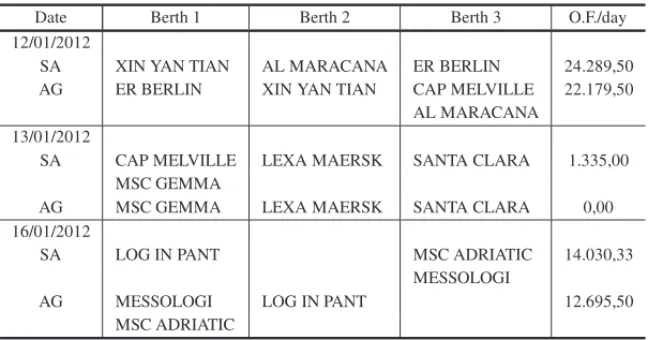
One of the objectives of this study was the search for instances of the proposed problem where the similarities and differences of the implemented metaheuristics would be exhibited. In this respect, the final results obtained according to the optimal objective function of each algorithm were compared. Thus, the vessels allocated to each berth by date and the final daily OF were considered. These data were obtained from the report generated by the application. The main difference was in the value of OF when the SA algorithm was executed. On January 12, 13, and 16, the objective function obtained by SA was superior to that of GA. This is attributed to the non-allocation of vessels.
In Table 8, on January 12, vessel CAP MELVILLE was not allocated. CAP MELVILLE arrived on January 11, with time window until 20:00 on January 12. This caused an increase in the objective function and forced the violation of the time window of this vessel on January 13, adding costs to the objective function for January 13 as well.
On January 16, there was a different situation; vessel MESSOLOGI, which arrived on January 15 with time window until 21h of January 16, was allocated to berth 3, after vessel MSC ADRI-ATIC, whose arrival was on January 16. As observed, the randomness of the neighborhood structure of the SA algorithm may have caused this incident because berth 2 was available to serve MESSOLOGI, which would prevent it from violating its time window.
Table 8–Differences between the programming of SA and GA.
Date Berth 1 Berth 2 Berth 3 O.F./day
12/01/2012
SA XIN YAN TIAN AL MARACANA ER BERLIN 24.289,50 AG ER BERLIN XIN YAN TIAN CAP MELVILLE 22.179,50
AL MARACANA 13/01/2012
SA CAP MELVILLE LEXA MAERSK SANTA CLARA 1.335,00 MSC GEMMA
AG MSC GEMMA LEXA MAERSK SANTA CLARA 0,00
16/01/2012
SA LOG IN PANT MSC ADRIATIC 14.030,33
MESSOLOGI
AG MESSOLOGI LOG IN PANT 12.695,50
MSC ADRIATIC
5 CONCLUSIONS
The present study aimed at describing the comparative application of the simulated annealing (SA) and genetic algorithm (GA) metaheuristics to the berth allocation problem (BAP) in a port container terminal.
The study highlighted important issues that naturally emerge when attempting to solve a berth allocation problem in a port terminal, namely, the selection and comparison of algorithms. In this respect, considering the performed bibliographical review, the present study can be added to the studies of DBAP. The studied algorithms were implemented to develop a computational tool, allowing the follow-up of the local search procedures in the determination of the optimal so-lutions for the problem. The first computational tests indicated the selection of the HX crossover operator for the comparison of GA and SA in the berth allocation of the port container terminal. The tests demonstrated the dynamic balance between diversification (breadth-first search=BFS) and intensification (depth-first search=DFS) in the applicability of the metaheuristics.
It is important to emphasize that the tests performed in this study were not intended to com-pare the techniques competitively, but rather to show that they are complementary tools in the decision-making process. The computational tool developed for the resolution of DBAP will en-courage studies in research areas that aim at identifying and collecting a set of test problems for evaluating the performance of the GA and the SA algorithms.
Great caution should be taken when generalizing the statements about the performance of the algorithms, as it is not possible to state that an algorithmic approach is superior to another for a given problem. However, this issue may be meaningless because many current studies aim at hybridization and attempt to generalize the main characteristics of the studied algorithms.
This study does not exhaust the studies of BAP or those of the presented metaheuristics. The results obtained are encouraging; however, there are still gaps to be filled by future studies. For instance, continuous allocation. That is, a reformulation of the BAP modeling that allows the exclusion of the berth opening and closing times, as, in practice, some ports do not operate with this condition, although there is shift change (dockers, machine operators, etc.)
Another key point would be a review of the restrictions and programming of algorithms, avoiding the interruption of service time owing to the closing/opening of the berth; although there could be a break in the berth service, in real situations, the vessel could start operating immediately after its arrival as long as there is an available berth, regardless of the break in the operational service, and as long as it does not generate costs for the terminal owing to, e.g., the violation of the time window of the vessel.
REFERENCES
[1] AYKAGANAK. 2008. Berth and Quay Crane Scheduling: Problems, Models and Solution Methods, Ph.D. Thesis at Georgia Institute of Technology of United States.
[2] BEASLEYD, BULLDR & MARTINRR. 1993. Na Overview of Genetic Algorithms: Part I, Funda-mentals.University Computing,15(2): 56–89.
[3] BIERWIRTHC & MEISELF. 2010. A survey of berth allocation and quay crane scheduling problems in container terminals. European Journal ofOperational Research,202(3): 615–627.http://dx. doi.org/10.1016/j.ejor.2009.05.031.
[4] BUHRKALK, ZUGLIANS, ROPKES, LARSENJ & LUSBYR. 2011. Models for the discrete berth al-location problem: a computational comparison. Transportation Research Part E, Logistics and Trans-portation Review,47(4): 461–473.http://dx.doi.org/10.1016/j.tre.2010.11.016.
[5] CHERRIAC, ARENALESMN & YANASSEHH. 2013. The usable leftover one-dimensional cutting stock problem a priority-in-use heuristic.International Transactions in Operational Research,20: 188–199.
[6] CORDEAUJF, LAPORTEG & MERCIERA. 2001. A unified tabu search heuristic for vehicle routing problems with time windows.Journal of the Operational Research Society,52(8): 928–936.
[7] CORDEAUJF, LAPORTEG, LEGATOP & MOCCIAL. 2005. Models and tabu search heuristics for the berth allocation problem.Transportation Science, 39(4): 526–538.http://dx.doi.org/ 10.1287/trsc.1050.0120.
[8] GUANY & CHEUNGRK. 2004. The berth allocation problem: models and solutions methods.OR Spectrum,26: 75–92.
[9] YANASSEHH. 2013. A Review of three decades of research on some combinatorial optimization problems.Operations Research,33(1): 11–36.
[10] HSUH-P. 2016. A HPSO for solving dynamic and discrete berth allocation problem and dynamic quay crane assignment problem simultaneously.Swarm Evol. Comput.,27: 156–168.
[12] IMAIA, NISHIMURAE & PAPADIMITRIOUS. 2001. The dynamic berth allocation problem for a container port.Transportation Research Part B: Methodological,35(4): 401–417.
[13] IMAIA, NISHIMURAE & PAPADIMITRIOUS. 2005b. Berth allocation in a container port: Using a continuous location space approach.Transportation Research Part B,39: 199–221.
[14] IMAIA, NISHIMURAE & PAPADIMITRIOUS. 2008. Berthing ships at a multi-user container ter-minal with a limited quay capacity.Transportation Research Part E, Logistics and Transportation
Review,44(1): 136–151.http://dx.doi.org/10.1016/j.tre.2006.05.002.
[15] KIM KH & MOON KC. 2003. Berth scheduling by simulated annealing.Transport Res. B, 37: 541–560.
[16] KIRKPATRICKS, GELLATDC & VECCHIMP. 1983. Optimization by Simulated Annealing. Sci-ence,220(4598): 671–680.
[17] LALLA-RUIZE, GONZALEZ-VERLARDEJL, MELIAN-BATISTAB & MORENO-VEGAJM. 2014. Biased random key genetic algorithm for the tactical berth allocation problem.Applied Soft Comput-ing,22: 60–76.
[18] LALLA-RUIZE, SHI X & VOß S. 2016. The waterway ship scheduling problem. Transport. Res. Part D: Transport Environment,60: 191–209.
[19] LEGATOP, MONACOF & TIGANIN. 2001. Berth planning at gioia tauro’s maritime terminal by logistic distribution models. In: Annual Conference of Italian Operational Research Society, 32, Cagliari.
[20] LOPESAT, SCHULZVML & MAURIGR. 2011. GRASP com path relinking para o problema de alocac¸˜ao de berc¸os [GRASP with path relinking for the berth allocation problem].PODes – Opera-tions Research for the Development,3(3): 218–229.
[21] MAURIGR, OLIVEIRAACM & LORENALAN. 2008. Heur´ıstica baseada no Simulated Annealing aplicada ao problema de alocac¸˜ao de berc¸os.GEPROS – Gest˜ao da Produc¸˜ao, Operac¸˜oes e Sistemas, 1(1): 113–127.
[22] MAURIGR, OLIVEIRAACM & LORENALAN. 2008-b. A hybrid column generation approach for the berth allocation problem. In: VANHEMERTJ & COTTAC. (Eds.). 8th European Conference on Evolutionary Computation in Combinatorial Optimisation – EvoCOP 2008.Lecture Notes in Com-puter Science,4972: 110–122. Berlin: Springer.
[23] MAURI GR, OLIVEIRA ACM & LORENALAN. 2010. Resoluc¸˜ao do Problema de Alocac¸˜ao de Berc¸os atrav´es de uma T´ecnica de Gerac¸˜ao de Colunas [Resolution of the Berth Allocation Problem using Column Generation Technique].Operations Research,30(3): 547–562.http://dx.doi.
org/10.1590/S0101-74382010000300003.
[24] MAURIGR, RIBEIROGM, LORENALAN & LAPORTEG. 2016. An adaptive large neighborhood search for the discrete and continuous berth allocation problem.Comput. Oper. Res.,70: 140–154.
[25] MEERSMANS PJM & DEKKER R. 2001. Operations research supports container handling, No EI 2001-22, Econometric Institute Research Papers, Erasmus University Rotterdam, Erasmus School of Economics (ESE), Econometric Institute.
[27] MICHALEWICZZ. 1992. Genetic Algorithms + Data Structures = Evolution Programs. Springer-Verlag, 29–39.
[28] NISHIMURAE, IMAIA & PAPADIMITRIOUS. 2001. Berth allocation planning in the public berth system by genetic algorithms.European Journal of Operational Research,131: 282–292.
[29] POTVINJY. 1996. Genetic Algorithm for the travelling salesman problem.Annuals of Operations Research,6: 339–370.
[30] PUREZA V & MORABITOR. 2003. Uma Heur´ıstica de Busca Tabu simples para o problema de carregamento de paletes do produtor [Simple Tabu Search Heuristic for the manufacturer’s pallet loading problem].Operations Research,23(2): 359–378.
[31] RASHIDIH & TSANGE. 2013. Novel constraints satisfaction models for optimization problems in container terminals.Applied Mathematical Modelling,37(6): 3601–3634.http://dx.doi.org/ 10.1016/j.apm.2012.07.042.
[32] RODRIGUESMHP, MACHADOCMS & LIMAMLP. 2013. Simulated Annealing applied to the berth allocation process.Journal of Transport Literature, 7: 117–136.http://dx.doi.org/ 10.1590/S2238-10312013000300006.
[33] STAHLBOCK R & VOß S. 2008. Operations research at container terminals: a literature update.
OR-Spektrum,30(1): 1–52.http://dx.doi.org/10.1007/s00291-007-0100-9.
[34] STEENKEN D, VOß S & STAHLBOCKR. 2004. Container terminal operation and operations re-search: a classification and literature review.OR-Spektrum,26(1): 3–49.http://dx.doi.org/ 10.1007/s00291-003-0157-z.
[35] THEOFANISS, BOILEM & GOLIASM. 2007. An optimization based genetic algorithm heuristic for the Berth Allocation Problem. IEEE Congress on Evolutionary Computation. p. 4439-4445.
[36] VACCAI, BIERLAIREM & SALANIM. 2007. Optimization at container terminals: status, trends and perspectives. In: Proceedings of the Swiss Transport Research Conference – STRC, pp. 1–21. Ascona: Monte Verit´a.
[37] VENTURINIG, IRISC¸ , KONTOVASCA & LARSENA. 2017. The multi-port berth allocation prob-lem with speed optimization and emission considerations.Transportation Research Part D,54: 142– 159.
[38] VIS IFA & KOSTERR. 2003. Transshipment of containers at a container terminal: an overview.
European Journal of Operational Research,147(1): 1–16.http://dx.doi.org/10.1016/ S0377-2217(02)00293-X.