Spectral and Coherence Estimates
on Electroencephalogram recordings
during arithmetical tasks
Ana Filipa Teixeira Borges
Disserta¸c˜ao apresentada na Faculdade de Ciˆencias e Tecnologia da Universidade Nova de Lisboa para obten¸c˜ao do Grau de Mestre em Engenharia Biom´edica
Coordenadores: Prof. Carla Quint˜ao Silva
i
`
Acknowledgments
First of all, I would like to thank my thesis advisors. In particular, Prof. Carla Silva for her enthusiastic way of teaching, all her efforts and the way she believed in me to this work since the first moment and Prof. Giuseppe Baselli, for his endeavors attempts to make this work possible and supporting guidance both, during my stay in Italy and the work developed here. I thank also Professor M´ario Secca for his efforts in bureaucratic procedures regarding my stay abroad.
I thank also Marcella Lagan`a and Roberta Carabalona for their help and the data they provide me in the Polo Tecnologico della Fondazione Don Gnocchi.
I am grateful also to Ana Carolina Sousa, the person responsible for the acquisi-tion of the data in the Instituto de Biof´ısica e Engenharia Biom´edica.
A special thanking word to John Peter for his valuable suggestions on the arith-metical protocol and to all the volunteers of this work.
To my cousin, Pedro Teixeira, a thanking word for introducing me in the Latex
typesetting world.
So many thank’s to my friends, you know who you are, I must say that more than the support and all the moments we shared, every singularity of their personalities has inspired me in a profound way, I like so much each one exactly the way they are. I would like to thank Iolanda and Mariana for all the time we lived together, friends can really be family.
I express my gratitude also to all my family and specially to my grandma and grandpa, even though they are far away I feel them all around.
A thanking word also to Enrico, for the way he is always present in my ups and nows and shares with me everything. I would like to thank also the Scofone family for their support.
I thank my little sister, she might think Science is for nerds but her presence and constant support are a source of inspiration and proud to me.
In the end but not the least, I deeply, deeply thank my mother, she gave every-thing I am and she is everyevery-thing I want to be.
Contents
Acknowledgments iii
Abstract xix
1 Preface 1
1.1 Context . . . 1
1.2 Scope and Work Developed . . . 2
1.3 Outline of the Thesis . . . 3
2 The Brain:Anatomy, Physiology and Functional Connectivity 5 2.1 Anatomy and Physiology of the Brain . . . 5
2.1.1 Brain and Cognition . . . 6
2.1.2 Cytology of the Brain . . . 8
2.2 Neurophysiological Background of the Brain Signals . . . 11
2.3 Brain’s Functional Connectivity . . . 14
2.3.1 Introduction to Brain Networks . . . 14
3 Methods of Acquisition of the Signals of the Brain - EEG Acquisition 17 3.1 First Steps and Recent Developments- Brief Review of Electroencephalo-gram History . . . 17
3.2 EEG Signal . . . 18
3.2.1 EEG Rhythms . . . 19
3.2.2 Variability of EEG . . . 20
3.3 Protocols in EEG Acquisition . . . 20
3.3.1 Electrodes and Head Stage . . . 21
3.3.2 Preprocessing . . . 23
3.3.3 Data Storage . . . 25
3.4 EEG in the context of other Brain study techniques . . . 25
3.4.1 EEG and an overview of the Hemodynamic Response based techniques 26 3.4.2 EEG and MEG . . . 28
vi CONTENTS
3.5 EEG Temporal and Frequential Analysis . . . 29
4 Coherence on Electroencephalography 33 4.1 Brief Historical Remarks on EEG Coherence . . . 33
4.2 Concept of EEG Coherence . . . 34
4.3 EEG Coherence as a measure of Brain Functional Connectivity . . . 37
4.4 Methods of Coherence Estimation . . . 38
4.5 Stationary analysis: Fourier Approaches . . . 39
4.5.1 Continuous Fourier Transform . . . 39
4.5.2 Discrete Fourier Transform . . . 41
4.6 Spectrum Estimation . . . 43
4.6.1 Windowing - Frequency smoothing . . . 44
4.6.2 Averaging the data - Temporal Smoothing . . . 47
4.6.3 Welch’s Overlapping Segment Averaging (WOSA) Estimation . . . 47
4.6.4 Statistical Properties of the Fourier Approaches . . . 48
4.6.5 Thomson’s method - Multitaper’s approach . . . 49
4.7 Dynamical analysis . . . 50
4.7.1 Short-time Fourier and Gabor analysis . . . 51
4.7.2 Wavelet analysis . . . 51
4.8 EEG Coherence Significance and Drawbacks in EEG Coherence Studies . . 57
4.9 EEG Coherence in Neurocognitive and Clinical findings . . . 59
5 Simulation Data 61 5.1 Experimental Paradigm . . . 61
5.1.1 Apart on Confidence Intervals . . . 62
5.2 Cosine Based Data . . . 63
5.2.1 Phase modulation . . . 63
5.2.2 Integral Phase Modulation . . . 64
5.2.3 Amplitude Modulation . . . 64
5.2.4 Modulation with additive noise . . . 65
5.2.5 Brief Discussion . . . 65
5.3 Mix Spectrum Data . . . 66
5.4 Interpretation and Discussion of the results . . . 67
6 Mental Calculation 71 6.1 Mental calculation substrate . . . 71
6.2 Comprehensive state-of-art . . . 72
CONTENTS vii
7 Mental Calculation: Interval Stimuli task 75
7.1 Experimental Protocol and Paradigm . . . 75
7.2 Stationary Analysis . . . 77
7.2.1 Spectral Analysis . . . 77
7.2.2 Coherence Analysis . . . 78
7.2.3 Some Conclusions . . . 81
7.3 Dynamical Analysis . . . 81
7.3.1 Experimental Procedure . . . 83
7.3.2 Main Results . . . 84
7.4 Discussion . . . 87
8 Mental Calculation: Counting backwards task 91 8.1 Experimental Protocol . . . 91
8.1.1 EEG Acquisition and Participants . . . 91
8.1.2 Cognitive task: Counting Backwards . . . 92
8.2 Experimental Paradigm and EEG Processing . . . 93
8.2.1 Frequency Analysis . . . 93
8.2.2 Study of Spectral Power and Coherence . . . 94
8.3 Results . . . 96
8.3.1 Power Results . . . 96
8.3.2 Coherence Results . . . 97
8.4 Discussion of the results . . . 101
9 General Discussion and Conclusion 107 9.1 Discussion and Limitations . . . 107
9.2 Contributes of the work done . . . 108
9.3 Perspectives of future work . . . 109
Contents . . . 113
Appendix 1 125
List of Figures
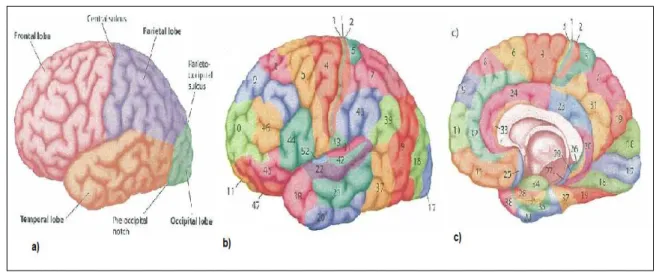
2.1 The seven main parts of the Central Nervous System. (adapted from [27]) 7 2.2 Functional divisions of the cerebral cortex. In a) we can see the four main
lobes in lateral view of the left hemisphere. Images b) and c) represent a lateral view of the left hemisphere and a medial view of the right hemi-sphere of the 52 Brodmann areas (one can see they are almost symmetrical). (adapted from [76]) . . . 8
2.3 Cortex viewed trough a MRI scan and schematic representation of the its ultrastructure, evidencing the pyramidal cells. . . 9
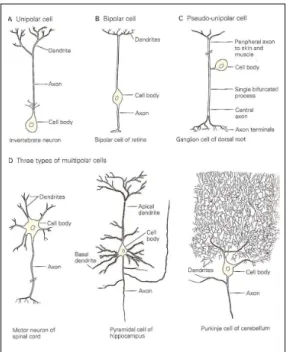
2.4 The structure of the neuron.(adapted from [27]) . . . 9 2.5 Classification of neurons in agreement with the number of processes
origi-nated in the cell body. A - Unipolars; B - Bipolars; C - Pseudo-unipolars and D - multipolars.(adapted from [27]) . . . 10
2.6 Generated potential field in a pyramidal cell due to a excitatory synaptic input in the dendritic tree, note that for inhibitory stimulation the current flow would spread inversely. (adapted from [126]) . . . 12 2.7 Brain as a network. (reproduced from [38]) . . . 15
3.1 The rhythms δ, θ,α and β of the brain.(adapted from [26]) . . . 20 3.2 Schematic representation of the EEG recording system divided in 3 parts
-Electrodes and Head Stage (I), Preprocessing (II) and Data Storage (III). (extracted from [116]) . . . 21 3.3 The position of electrodes in the 10-20 system. (adapted from [126] . . . . 23
3.4 The cortical areas and Brodmann areas underlying each electrode in the 10-20 system. [58]) . . . 24 3.5 Different types of basic filters and respective frequency response. (extracted
from [79]) . . . 25
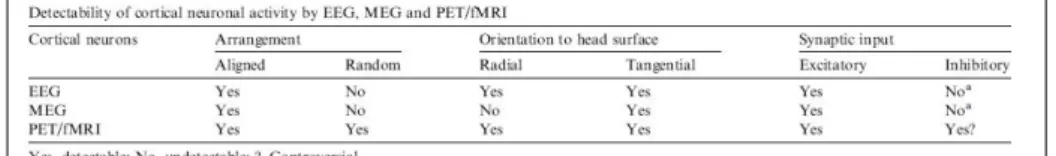
3.6 Comparison of detection of cortical neuronal activity by EEG, MEG and PET/fMRI. (reproduced from [103]) . . . 29
x LIST OF FIGURES
4.1 Schematic representation of the Heisenberg inequality. . . 41
4.2 Evidence of discontinuities in a periodic extension, phenomenon that causes spectral leakage. . . 45
4.3 Time-frequency tiling of the Gabor Transform and of the Wavelet Transform. 52
4.4 Example of wavelet base: Morlet wavelet. On the left, representation of the real (solid line) and imaginary part (dashed line) of the time-domain wavelet. On the right, one can see the correspondent frequency-domain wavelet (adapted from [122]). . . 56
5.1 Magnitude Squared Coherence (Welch method) with 10 of modulation (left) and 100 modulation (right). Confidence levels estimated trough FFT sur-rogation. . . 64
5.2 Magnitude Squared Coherence (Welch method) with 10 of modulation (left) and 100 modulation (right) for amplitude modulation. Note that maximal noise seems that does not influence the broadness of the peak. Confidence levels estimated trough FFT surrogation. . . 65
5.3 Magnitude Squared Coherence for the four conditions with the maximum level of noise: phase modulation (top,left), integral phase modulation (top, right), amplitude modulation (left,bottom) and additive case (right,bottom). 67
6.1 Schematic diagram represents the actual opinion on pathways of digit pro-cessing in the brain. It results from a combined information of diverse neuroimaging techniques in healthy and pathological subjects. Abbrevia-tions: AG - angular gyrus; FuG - fusiform gyrus; HIPS - horizontal segment of the intraparietal sulcus; IFG - inferior frontal gyrus. (adapted from [98]). 73
7.1 Experimental setup: on the top we see the configuration of the electrodes used in this protocol with a placement according to 10-20 system (adapted from [19]) and an exemplary group of obtained brain waves. On the bottom, a schematic representation of the two applied tasks: stimuli each 3 seconds and stimuli each 2 seconds. . . 76
7.2 Power spectrum from basal condition to a mental task situation. . . 78
LIST OF FIGURES xi
7.4 Magnitude Squared Coherence for the pair Fz-Cz contrasted between basal eyes open condition and the two mental tasks: 2-sec interval (left) and 3-second interval (right). Note the increase in coherence in the sub-region of
β, nearly 12-16 Hz and a small increase also in the θ region merely for the condition with 3-second stimulation. . . 80
7.5 Comparison for the central electrode and the 2-second stimulation task of the ITLC (left) and ITPC (right), using a fixed-window. Note the changes inherent to each mode in the lower panel. Frequencies are plotted trough 0.5-50 Hz. . . 84
7.6 Top: The ERSP for the frontal electrode for the 2-second stimulation task using hanning tapered zero-padded DFT (left) and Morlet variant wavelets (right). The upper left panel shows the baseline mean power spectrum, and the lower part of the upper panel,the ERSP envelope (low and high mean dB values, relative to baseline, at each time in the epoch), the ERSP is depicted trough the color scheme on the right. Bottom: The ITC for the same electrode-condition combination . Frequencies are plotted trough 1-50 Hz(DFT) and 4-50 Hz (Wavelet). . . 85
7.7 Two example cases of Event-related phase coherence computed with fixed-window in the task with 3-second stimulation.Left: pair Fz/Pz and Right: pair Fz-Oz. The panel on the left on the top image represents the mean baseline coherence among the frequencies. The horizontal panel instead shows coherence maximum (green) and minimum (blue) value in the range of all frequencies.In the inferior plot, phase difference of the two signals is shown for all cases coherence is significant. Frequency span is 2-30 Hz. . . 88
7.8 Comparison of Event-related phase coherence computed with varying-window in both tasks for the combination pair Cz/Pz - task 2 seconds (on the left) and task 3 seconds (on the right). Frequencies represented are between 2-30 Hz. . . 89
8.1 Distribution of the electrodes utilized in the present experience. Electrodes outside the head model account for lateral positions.It was used average reference. . . 92
xii LIST OF FIGURES
8.3 The analyzed channel pairs in frontoparietal study, I investigated short and long range connections, pairs inside one hemisphere or representing coupling among the two hemispheres. . . 95 8.4 Power spectrum [dB/Hz] of performer 8 for all channels during basal
con-dition eyes closed (left) and mental calculation (right). Note the vanishing of alpha frequency (12 Hz) during mental calculation accompanied by a tenuous increase in frequencies of beta band. . . 97 8.5 Top: Magnitude squared coherence of subject 9 for precentral and frontal
electrodes C3-F3 during basal condition eyes closed (black) and mental cal-culation (red). Note the increase in a1 frequency (12 Hz) and ß frequencies. Right: Magnitude square coherence of subject 2 in the same conditions but for precentral and parietal electrodes C3-P3. An increase in 6 Hz (θ), α
(11 Hz) and β (22 Hz) is shown. . . 98 8.6 Left: Magnitude squared coherence for the precentral-inferior frontal pair
(C3-F8) in each minute in the case of subject 8. Note the 13 Hz frequency peak more pronounced in the third minute. Right: Magnitude squared coherence for the precentral-frontal pair(C3-AF3) in each minute in the case of subject 9. Note that the 12 Hz frequency peak more pronounced in the first minute is a tendency found in 9 cases. . . 99 8.7 Left Top: Magnitude squared coherence (MSC) for performer 7, pair
List of Tables
2.1 The main parts of the Central Nervous System and short description of its main functions. . . 6
5.1 The magnitude coherence results for the cosine simulated data in the four conditions. . . 65 5.2 Magnitude of coherence values of the conditions of Phase modulation and
Integral phase modulation for the mix spectrum data. . . 68 5.3 Magnitude of coherence values of the conditions of Amplitude modulation
and Additive noise for the mix spectrum data. . . 69
7.1 Summary of the principal ERSP increasings (frequency and time in sec-onds) found for all electrodes and bands θ, αandβ in the 2-second interval stimulation using fixed-window decomposition. The frequencies and times are reported in a rough manner, the frequency/ies chosen is/are the most representative. . . 86 7.2 Summary of the principal ERSP increasings (frequency in hertz and time
in seconds) found for all electrodes and bands θ, α and β in the 3-second interval stimulation using fixed-window decomposition.The frequencies and times are reported in a rough manner, the frequency/ies chosen is/are the most representative. . . 87
8.1 Table resuming some details about the volunteers. Performer 10 is the only one who is left-handed. Volunteers 4 and 11 are under medication. All subjects declared they have not any auditive, visual or neurological problem. . . 106
Acronyms
EEG Electroencephalography MEG Magnetoencephalography CNS Central Nervous System CSF Cerebral Spinal Fluid AP Action Potential
PSP Postsynaptic Potentials ATP Adenosine Triphosphate
EPSP Excitatory Postsynaptic Potentials IPSP Inhibitory Postsynaptic Potentials fMRI functional Magnetic Resonance Imaging SMR Sensorimotorrhythm
EOG Electrooculography EMG Electromiography ECG Electrocardiography
ADC Analogue-to-Digital Converter
SPECT Single-photon Emission Tomography PET Positron Emission Tomography
MRS Magnetic Resonance Spectroscopy HEG Hemoencephalography
xvi LIST OF TABLES
TMS Transcranial Magnetic Stimulation EROS Event-related Optical Signals NIRS Near-Infrared Spectroscopy BOLD Blood Oxygen Level Dependent DTT Difusion Tensor Tractography WVD Wigner-Ville Distribution WT Wavelet Transform
HOS High-Order Statistics
CFT Continuous Fourier Transform DFT Discrete Fourier Transform FFT Fast Fourier Transform
WOSA Weighted Overlapping Segment Averaging Estimation STFT Short Time Fourier Transform
FT Fourier Transform
CWT Continuous Wavelet Transform OCD Obsessive-Cmpulsive Disorder WM Working Memory
CC Corpus Callosum
MSC Magnitude Squared Coherence
ERSP Event-Related Spectral Perturbation ITLC Inter-Trial Linear Coherence
ITPC Inter-Trial Linear Coherence ERCOH Event-Related Cross-Coherence ERP Event-Related Potential
Abstract
Activation in brain areas during mental calculation can be assessed by tech-niques such as Positron Emission Tomography (PET) and Functional Magnetic Resonance (fMRI), however this information does not regard synchronization of distant brain regions in a given frequency. Following the fact that brain networks have distinct resonance prop-erties, a correlation between the specificity of frequency and a particular brain circuit is expected. A way of evaluating brain’s functional connectivity is trough measuring coher-ence between Electrocoher-encephalographic (EEG) channels. This work focus on the analysis of spectral differences and coherence between electrodes, during arithmetic calculation. The selected frequency bands were theta (4-7 Hz), alpha (8-12 Hz), beta (12-30 Hz) and gamma (above 30Hz).
The coherence algorithm was previously tested in simulated data in diverse con-ditions and levels of confidence were obtained trough a surrogation procedure. Analysis of real data comprised two protocols, the former related to only one individual in a mental task using arithmetical computations as stimuli and the latter, a mental calculation task of backward counting with eyes closed applied to 15 healthy volunteers. In the first proce-dure it was made a stationary and dynamical analysis of the power and coherence. In the last experiment, participants were asked about what strategy they use for calculation and power and coherence computed firstly for the whole recording and after for each minute separately aiming to look for coherence differences in time.
Simulation permitted to conclude that the method is well-suited to identify cou-pling in the frequency regions of interest in EEG, even though limited for higher fre-quencies. In the first experimental approach, results showing distinct information can be acquired depending on the method. Finally, mental calculation spectral and coherence results were related successfully with previous findings in the field, consistent results were obtained for alpha and beta bands, meanwhile theta appears correlated with suggestive results. It was not possible to discern between different mental calculation strategies with the current experimental protocol.
Coherence measure is shown to be an useful method in understanding mental cal-culation processes, though more research and improvements of the technique are needed.
Chapter 1
Preface
”In a world divided by culture, politics, religion and race, it is a relief to know one thing that stands above them - mathematics. The diversity among today’s mathematicians shows that it scarcely matters who invents concepts or proves theorems; cold logic is immune to prejudice, whim and historical accident. And yet, throughout history, different families of humans have distilled the essence of the cosmos to capture the magic of numbers in many ways.” (Pervez Hoodbhoy)
1.1
Context
Since early days there is an interest in understanding the functions that contribute to form what we can call the human identity as a species. Exploring mental processes such as language, emotion and memory have always kept live the attention of the scien-tific community. Conversely, investigation of other specific higher cognitive functions like mental calculation (arithmetical thinking) only came into focus in the last decades and a permanent discussion of its underlying mechanisms persists nowadays.
The functional aspect of the brain, in the same way, was always correlated with the specific zones firstly denominated by Brodmann in the turn of the twentieth century. Nowadays, parallel to specific regional functionality there is a growing interest in ex-plaining how functional aspects result from interaction between the different parts. This interesting excerpt illustrates the relevance of this study, comparing brain networks to personal computers:
”The number of neurons in the human brain is approximately equal to the number of transistors in a modern personal computer. Compared with the
2 1. Preface
computer that operates in the GHz range, the brain has a much lower firing rate (below ca. 1000 Hz), but a massive advantage in the interconnectivity between its basic units: a single neuron can have up to 1000 connections to other neurons, and in the entire human brain, there are approximately 100 trillions of neuronal connections. While computers are certainly faster and more reliable in straight-forward ‘number crunching’ computational tasks, the brain outperforms computers in reliability and accuracy when dealing with complex tasks such as language understanding, object recognition or planning and strategy development. Thus, it is likely that the brain’s advantage in these tasks must be in the cooperation of the units, rather than the processing speed in the units. Therefore, connectivity in the brain is probably one of the most fundamental and challenging fields of study at this time. Useful theories on ‘how the brain works’ will certainly have to account for how the brain establishes, organizes, maintains and modifies its internal connectivity structure in space and time.” (T. Koenig et al,2005 in [114])
This theory that cognition bases emerge from dynamic connections mediated by synchrony over diverse frequency bands was recently advanced from several authors [104, 38, 114] and the need for the use of techniques with high-temporal resolution (EEG, MEG) for this line of research strongly emphasized [38]. Nonetheless, a full comprehen-sion of large-scale integration of brain networks during mental processes is still impossible. Mental calculation is no exception, the comprehensive work done regarding brain func-tional connectivity of arithmetical thought is unsatisfactory to clearly establish a paradigm sustaining the hypothesis of binding trough frequency.
1.2
Scope and Work Developed
1.3. Outline of the Thesis 3
The main questions of this thesis are: Is EEG coherence appropriate to measure functional correlation of distant brain areas? What are the main limitations of the al-gorithm applied? What other approaches can be followed to study coupling in mental calculation processing? Can mental calculation’s patterns be depicted trough spectral and coherence measures? Can we find different wiring patterns following distinct strategies n mental calculation? What are the main drawbacks of such a protocol?
1.3
Outline of the Thesis
This thesis work is organized in chapters, each chapter as a distinct goal. Fol-lowing the present preface, Chapter 2 elucidates the principal aspects regarding brain anatomy, physiology and functional aspects, a brief introduction to the electrical prop-erties of the brain signals and the network structure of the brain. The third chapter explains succinctly the questions regarding the technique of acquiring the signals - EEG; important constraints and the context among other techniques are highlighted. The the-oretical background in EEG coherence is developed in the immediate subsequent chapter, reviewing some approaches and subtleties of the technique, most of them necessary for the experimental work. The concepts of this Chapter are developed extensively, they correspond to the author’s efforts of understanding all the potentialities of the coherence technique in EEG data and must be faced as a preliminary guide. Once this project will be continued by a colleague, it is assertive to include it in such a way, unifying well-established knowledge with more recent advances. Chapter 5 makes a concise introduction to the actual knowledge about mental calculation processing in the brain. Indeed, the first five chapters have a focus on theoretical aspects which are assumed thereafter in the next chapters.
The experimental work comprises three distinct parts: a first chapter (Chapter 6) in which the coherence algorithm is validated trough simulated data and two following chapters (Chapter 7 and 8) relative to real datasets. The former presents the study done with a first set of data of one healthy volunteer of different approaches and the latter, the detailed description of the experiment done with 15 healthy individuals. All these three chapters expose independently their methods, results and discussion.
Chapter 2
The Brain:Anatomy, Physiology and
Functional Connectivity
This chapter intends to provide a basic introduction to the anatomical and func-tional characteristics of the field of study of the present project - the brain. An accurate study of methodologies for optimization of brain inspection is not possible without a notion of brain’s architecture and also the origin’s of the biosignal measured with the Electroencephalogram. As an extension, an approach to the brain signal characteristics that can be revealed with EEG coherence measures of coupling is presented too, namely the patterns of brain functional connectivity among different zones of which intensity can be correlated with the level of coherence among EEG data.
2.1
Anatomy and Physiology of the Brain
The Brain is the part of the Central Nervous System (CNS) with the greater degree of enlargement and specialization, externally protected by the skull and more interiorly by protective membranes called meninges [126]. The CNS is composed by seven main parts [27] reported in Table 2.1 and Figure 2.1:
Both, the spinal cord and the brain are immersed in a fluid designated Cere-bral Spinal Fluid (CSF) that relieves the pressure, inevitably present if the brain would be merely sitting in the top of the skull. The brain has also a subdivision in three large regions (see figure 2.1): the hindbrain, the midbrain and the forebrain. The brainstem is constituted by the first two, excepting the cerebellum.
6 2. The Brain:Anatomy, Physiology and Functional Connectivity
The Main Parts of the Central Nervous System (CNS)
Spinal Cord Caudal part responsible for receiving and processing in-formation from the limbs and trunk
Medulla oblongata Situated immediately above the spinal, controls essen-tially autonomic functions like digestion, breathing and heart rate
Pons Juxtaposed to the medulla, carrier of the information between the cerebral hemisphere and the cerebellum Cerebellum Mass behind the pons, it is the coordinator of voluntary
muscle movement and takes a role in the learning of motor functions
Midbrain Located rostral to the pons, it is responsible for sensory-motor function such as eye movement and vi-sual/auditory reflexes.
Diencephalon Rostrally positioned relative to the midbrain, it is com-posed by the thalamus (where the major part of the sen-sory information is processed and relayed to the cortical areas) and the hypothalamus (regulator of autonomic, endocrine and visceral functions)
Cerebral Hemispheres Composed in their outer portion by the cerebral cortex and innerly by the basal ganglia (regulator of motor per-formance), the hippocampus (memory storage) and the amygdaloid nuclei (autonomic and endocrine responses of emotional states)
Table 2.1: The main parts of the Central Nervous System and short description of its main functions.
2.1.1
Brain and Cognition
2.1. Anatomy and Physiology of the Brain 7
Figure 2.1: The seven main parts of the Cen-tral Nervous System. (adapted from [27])
prevalent with a lot of modifications suffered through the years, in Figure 2.2 part b) and c) one can see the division in the 52 distinct areas.
In a general way, the higher cognitive systems are often composed of networks whose individual units are located in distinct lobes, all the brain functions (sensory, motor or cognitive) rely on both cortical and subcortical components. The complex functional anatomy of the cortex will not be reviewed in an extensive way, merely the main functions will be highlighted. The frontal lobe is mainly divided in motor cortex and prefrontal cor-tex. The motor cortex has the precentral gyrus (also known as primary motor cortex (area M1) or Brodmann’s area 4) and other areas responsible to contact with spinal cord and brainstem motor neurons. The prefrontal cortex is responsible for higher aspects of motor control, planning and execution of behavior and general tasks that include integration of information in a temporal scale. It is divided in several regions like e.g. the dorsolateral prefrontal cortex that has been implicated in working memory functions. In the parietal lobe, we have the somatosensory cortex composed by the postcentral gyrus and adjacent regions (Brodmann’s areas 1,2 and 3 - see Figure 2.2), its main function is to receive the inputs from the thalamus and constitute information about pain, touch, temperature sense and limb prioception. The areas for visual processing are, on their turn, located in the occipital lobe. This latter includes the primary visual cortex (area V1 or Brodmann’s area 17) that is responsible for receive the inputs of the lateral geniculate nucleous of the thalamus, starting the encoding of visual features like color, luminance, orientation and movement [76].
8 2. The Brain:Anatomy, Physiology and Functional Connectivity
Figure 2.2: Functional divisions of the cerebral cortex. In a) we can see the four main lobes in lateral view of the left hemisphere. Images b) and c) represent a lateral view of the left hemisphere and a medial view of the right hemisphere of the 52 Brodmann areas (one can see they are almost symmetrical). (adapted from [76])
was connected to the right inferior temporal lobe just to cite some examples [40]. More-over, there was a tendency to localize certain abilities in an hemisphere such as music and spatial processing in the right hemisphere and verbal and mathematical capacities in the left. Nowadays, however the general effort is to decentralize the focus on a hemisphere and try to locate sub-components of this higher tasks in specific regions in order to form a comprehensive picture.
2.1.2
Cytology of the Brain
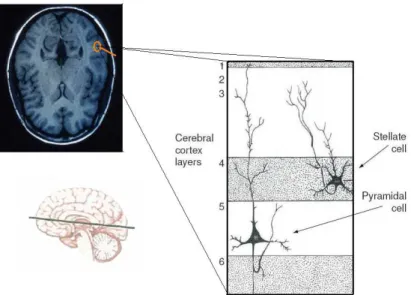
Concerning now the ultrastructure, the neocortex (the evolutionary newest part of the cortex) has a multilayered structure formed by six distinct layers in the major part of the cases (see figure 2.3): the molecular layer (I) is the most superficial portion filled by the dendrites of deeper cells of the cortex; the external granule cell layer (II):
the external pyramidal cell layer (III); the internal granule cell layer (IV); the internal
pyramidal cell layer (V) and the multiform layer (VI) [27]. These layers have different
constitutions and vary accordingly to the zone of the cortex. Of particular relevance are the pyramidal cells of layers III and V - these neurons are the major projection cortical neurons and their apical dendrites are the principal inputs of synaptic activity being in sum, the most expressive contribution for the EEG (see Figure 2.3).
2.1. Anatomy and Physiology of the Brain 9
Figure 2.3: Cortex viewed trough a MRI scan and schematic representation of the its ultrastructure, evidencing the pyramidal cells.
and it is estimated that exist approximately 1011 neurons in the CNS [40]. The neurons
are the units responsible for the integration and transmission of the nerve impulses and, even though the glial cells have important and diversified functions they do not have a direct role in the processing of information on the brain, the only known correlations are: active role in regulation of the extracellularK+which, as we will see below has an
impor-tant role concerning neuronal information transmission and, additionally, their activity as myelin producers.
Figure 2.4: The structure of the neuron.(adapted from [27])
10 2. The Brain:Anatomy, Physiology and Functional Connectivity
itself corresponding to the metabolic and integrator center of the cell, the diametrically opposed to the dendritic zone axon that covers a site where propagated action potentials are generated and is mainly responsible for the conduction of information into the final part - the synaptic endings. These latter are the terminal branches of the neuron com-posed by synaptic knobs where synaptic neurotransmitters are stored and consist in the last differentiated functional area of the neuron, performing the transport of the infor-mation for other neurons or muscles. Many axons are surrounded by a sheath of myelin (a protein-lipid complex that wraps around the axon) interrupted only by zones called nodes of Ranvier, the importance of such myelin coating is its insulating properties that make the current trough practically inexistent, originating the so-called saltatory conduc-tion which is proved to be really efficient as it yields a 50 times faster conducconduc-tion when compared to the fastest unmyelinated neurons.
Concerning the morphology, one neuron may be classified in unipolar, pseudo-unipolar, bipolar or multipolar (see fig. 2.5). Although, the last are commonly the ones found in the nervous system. Moreover, it is in this group in which are present the cortical pyramidal cells, their importance will be emphasized in the next Chapter.
2.2. Neurophysiological Background of the Brain Signals 11
2.2
Neurophysiological Background of the Brain
Sig-nals
First of all, it is well established that the brain has an intrinsic electrical activity consistent with its functions. This electrical activity is rapid and transient and yields the information to be conducted along great distances in the brain. The question is what is the precise origin of this brain’s patterns. Albeit an explicative model was not fully developed, there were made several attempts such as physiological approaches and com-putational modeling of the neural networks.
On a cellular context, this activity has a neuronal origin and is expressed mainly in the generation of action potentials (AP) and postsynaptic potentials (PSP) excitatory and inhibitory. Both are related to changes of potential in the neuronal membrane, being the formers activated when the membrane’s potential surpasses a threshold and the latter in cases a subthreshold is exceeded [26]. The measured EEG is the reflection of these po-tentials in the surface of the cortex and on the surface of the scalp and actually, only the PSP have a significant contribution to the signals obtained in the Electroencephalogram. In a general way, the macroscopic insight provided by EEG can be correlated with the electrical activity of a large amount of dipoles (the electrical field of cell’s mem-brane is approximated to that of a dipole) parallel-oriented and synchronized so, the only cortical cells which obey to that pattern and though supply that information are the pyra-midal cells (see previous section for cortical layer’s information). As it is easily deduced, if the cells bodies and dendrites of the neurons were positioned randomly the global influ-ence of the synaptic currents would be null. Considering instead that some group of cells have a special arrangement, a difference of potential can be generated. These cells, the pyramidal neurons have, as it was said primordially, a behavior approximated to a dipole: the inputs of the synapses of the apical dendritic arborizations cause a depolarization of the dendritic membrane - consequently, a bilateral subthreshold current flow is initiated between the dendrites and the cell body. The two poles correspond to the extracellular medium of the soma -source (+) and the top of the apical dendritic tree -sink (-). On the contrary, the non pyramidal cells do not contribute expressively to the EEG due to the constrained arrangement of their dendritic zones and body cells that form a closed-field situation and as so, at a considerable distance their net potential is zero [126].
12 2. The Brain:Anatomy, Physiology and Functional Connectivity
Figure 2.6: Generated potential field in a pyramidal cell due to a excitatory synaptic input in the dendritic tree, note that for inhibitory stimulation the current flow would spread inversely. (adapted from [126])
why the EEG’s signal corresponds to populations of synchronized neurons is because small contributions of reduced groups of neurons do not construct signals possible to measure in the scalp as the transmembranar currents of the neurons would cancel out and not sum effectively [89].
For a better comprehension of the EEG signals’ origins an introduction of the bases of this potentials is needed. Briefly, they are mainly modulated by the flow of ions in the cell membranes, the principal ions involved are the K+, N a+, Cl−, Ca++ and
other large organic anions, the voltage-gated channels of these ions contribute to form the electrical signals. The neurons resting state usually have a potential of nearly -70 mV [26].
The mechanisms underlying the maintenance of this potential are based in the balance between the passive flow of ions trough non-voltage dependent channels and active ion pumps. The neurons are specially rich in ions likeCa2+, N a+, Cl− which concentrate themselves preferentially in the exterior of the cells and K+ and other organic anions
in the interior. The N a+/K+ pump maintains the intracellular concentration of these
ions. The potential is held in that negative value because recurring to the hydrolysis of a molecular of ATP, for each three ions of N a+ that are transported outwards only two
ions of K+ enter the neuron, causing the difference. Further, this pump contraries the
passive flow of this two ions which is also a factor that contribute for the resting potential due to the greater permeability of the membrane to the K+ that flows to the outside the
cell when compared to the N a+ entering [27].
2.2. Neurophysiological Background of the Brain Signals 13
resting level is achieved, they last ∼ 2 ms but can last between 1-10 ms [27]. In the de-polarization, the point where its rate start to increase is designed firing level or threshold and it is the value minimum for the generation of the action potential [40]. The threshold is dependent of the membrane’s resistance and capacitance and also of the intracellular axial resistance along the axon [27]. The AP are governed by the all-or-none law i.e. they do not occur for subthreshold stimuli and maintain their shape even with stronger stimuli [40]. The existence of AP is regulated basically by the voltage-gatedK+ andN a+
channels. When the depolarization occurs, these channels open and augment the perme-ability of the membrane to the ions, the N a+ voltage-gated channels open first so the
potential increases suddenly, the subsequent repolarization happens due to the open of theK+ voltage-dependent channels and simultaneously closing ofN a+ channels. Finally,
because of the delayed closure of theK+ channels, the efflux ofK+ lasts a while causing
a hyperpolarization before the recovering of the resting potential [40].
The hyperpolarization is also called refractory period, the action potentials are spread in the axons unidirectionally because of the existence of this period. The persistent openness of the K+ voltage-dependent channels after restoration of the resting potential
and the fact N a+ channels have a few milliseconds inactive period after their aperture
make impossible to generate an AP, guaranteeing only one sense of flow.
14 2. The Brain:Anatomy, Physiology and Functional Connectivity
new excitatory postsynaptic potentials (EPSP) in the temporal range before preliminary ones have occurred. The EPSP formed are though not all-or-none responses but show a dependency on the stimuli integrated. The temporal scale which this postsynaptic po-tentials follow is in the millisecond range, indeed all the EPSP and IPSP have at least a delay of ∼ 0.5ms (the minimum delay of a synapse) but, can be longer if there are many synapses on the chain. Moreover, there were reported cases of cortical neurons with latencies situated in a time of 100-500 ms [40].
A diametrically opposed view on the way cortical neurons form its postsynaptic potentials was first introduced in the early eighties with the work of Abeles [2] and it is based in the hypothesis of neurons acting as coincidence detectors instead of being tem-poral integrators. In [89] it is outstanded this vision with a competing character and not replacing at all the classic alternative of neurons as an integrate-and-fire. In their work, Koenig et al, suggests the prevalence of a mode depends on time, indeed if the mean interspike interval is shorter when compared with the time of integration, the coincidence detection would be the main process activated and, on the other hand, if it is longer the process of summing the potentials in a greater window would be preferred. The neuronal transmission would have in the former case a more rapid contour, being lesser than 5 mil-liseconds. Further, it hints the relevance of EEG data on the correlation of synchronized brain patterns and function, standing in the fact that the EEG signal obtained is a glimpse of the synchronization of assemblies of neurons and diverse studies developed with this technique concerning functional states or functional roles of cooperation between various areas in the brain have demonstrated an association between this synchronization and function, giving this idea a great support to the importance of synchronism in neuronal processes and consequently further pertinence to the studies in which this characteristic is highlighted as is the case of the present study. Several subsequent studies support this perspective as though expose some fragilities of it, some examples are the works in [108, 75, 8, 110] and recently [64].
2.3
Brain’s Functional Connectivity
2.3.1
Introduction to Brain Networks
2.3. Brain’s Functional Connectivity 15
Figure 2.7: Brain as a network. (reproduced from [38])
The general idea that the brain works as a single unit composed by a group of dif-ferent specialized centers (functional areas) appeared earlier than the nineteenth century, compounding a theory that was called Holism. However, in the precedent century a lot of studies on brain functions were done having in account the concept of localization in detriment of integration of activity, indeed attention was mostly centered to attribution of functions to specific zones and the primordial idea fell almost completely in oblivion. Controversially, later it was shown that it was right, actually studies based on individual components was proved insufficient for understand brain networks [65]. On such a con-text, the desirable diversity, specificity and adaptability of evolved structures seem to be acquired by the union of two important aspects: a great computational capacity inherent of the extremely large amount of neuronal intermediaries and a precisely designed con-nection network between all brain [99].
Based on that duality, it is easily perceived that for true and full comprehension of the mechanisms beneath higher level brain functions, an in-depth analysis of its global properties is needed. A detailed and profound knowledge of each functional parts sepa-rately is insufficient. Besides that, it was established that our brain’s structure seems to obey to some principles of minimization, indeed the geometry of the brain reflects clearly a reduce of wiring cost and a minimization of global energy consumption simultaneously with the maintenance of maximal communication bandwidth [111].
16 2. The Brain:Anatomy, Physiology and Functional Connectivity
with a precision of the order of millisecond [13].
The concept that synchronization of the neuronal cells can be a phenomenon re-lated to the binding of information on the brain, as we can see, started to be discussed some decades ago and is nowadays an important subject of research. The binding prob-lem, in a neuroscientific cognitive environment, refers to the way the brain proceeds a signal integration, segregated in space and time, causing an experiencing of singularity
i.e. a feeling of perceiving an unique sensation. This crossing of information in the brain networks seems to be yielded with the support of two processes that were already intro-duced: the ”binding by convergence” or ”labeled line coding” and the ”dynamic binding” accordingly to the designations in [104]. The former is related merely with the grouping of information by simple unification of axonal projections (the second designation assents on the fact each intermediary signal always the same conjunction of inputs) and the latter admits that neuronal responses that somehow conjunctively show their saliency in con-trast to others are assumed to be bounded and even though, not linked anatomically they reveal themselves like belonging to the same level in the processing hierarchy.
Chapter 3
Methods of Acquisition of the
Signals of the Brain - EEG
Acquisition
"Porque eu sou do tamanho do que vejo, E n~ao do tamanho da minha altura."
Alberto Caeiro
In the previous section, I exposed some introductory remarks on the human brain, the cerebral cortex, the process of neuronal transmission of information across this highly-elaborated machine. On its turn, this chapter will concern with how we can ex-tract, record and pre-process this extremely complex signal. In a nutshell, the basis of Electroencephalography will be studied, presenting also a brief discussion on the relevance of this technique on the current purposes.
3.1
First Steps and Recent Developments- Brief
Re-view of Electroencephalogram History
Early in the second half of the XIX century, the first measurements of the elec-trical brain of cats and rabbits were made by a scientist named Richard Caton. He used a galvanometer to measure the currents and his work consists in the first approach in the study of the brain potentials, others followed his work namely, Beck in 1890, was the first to report brain rhythmic activity [26].
The first publish on the experiment of a human electroencephalogram was made
18 3. Methods of Acquisition of the Signals of the Brain - EEG Acquisition
in 1929 by the German psychiatrist Hans Berger [10]. The importance of this finding was although limitedly recognized until a British neurophysiologist named Edgar Douglas Adrian showed this new technique with proved validity in the spring of 1934. Since that date, the EEG showed that has capacity to be consider nowadays an important resource in neuroscience clinical and research branches, it contributed expressively for new concepts in the epilepsies knowledge, other pathologies like brain tumor localization and clinical states like brain dead confirmation only to mention some earlier perspectives of utiliza-tion. Until mids of the twentieth century some of the most important research on EEG was concentrated mainly in observing the electrical activity of the brain, exploring the significance of brain waves and developing styles of recording the electroencephalogram [11].
Subsequently, a strong need for automation and the revolution of power compu-tation yielded to the development of EEG quantitative techniques. Initially, these meth-ods relied mainly in a frequency-related analysis. Progressively, in the eighties, nineties decades other concepts started to be applied to EEG analysis such as information theory-based methods and non-linear approaches [116].
Recently, the EEG was utilized also in a background of human-machine interac-tion concretely some brain waves recorded with the EEG (such as the mu rhythm or the P300) were used as channels of communication for those in disabled conditions [54].
Concluding, Electroencephalography opened an intense field for neuroclinical re-search, some examples of application more related with this dissertation will be given in section4.8. An important mark in its history is also its multimodal utilization with fMRI which will be referred in section 3.5.
3.2
EEG Signal
The EEG signal is a temporally well-defined measure of the electrical fields of the brain amplified by a factor sensitively equal to 1000 [61]. The aspect of an EEG signal can be variate, composed by transients, spikes or apparent random events and rhythms.
3.2. EEG Signal 19
The signal can be described basically on the following characteristics: noisy and pseudo-stochastic, highly non-linear and essentially non-stationary (stationarity of a signal is the characteristic of preserving the same statistical properties such as mean, variance and frequency in time [127]).
3.2.1
EEG Rhythms
There were identified several rhythms in the electroencephalogram being related with different cognitive or physiological states of the brain (see Figure 3.1). A lot of studies contributed for the nowadays division of the EEG in the following frequency bands (although it is still somehow arbitrary and not standardized [101]): delta (0.1-4
Hz), theta (4-8 Hz), alpha(8-12 Hz), sensorimotorrhythm SMR - also called mu rhythm
- (normally seen in the range 9-11 Hz in healthy individuals, sometimes mixing with β
frequencies in 20 Hz [28]), beta (15-40 Hz) and gamma for above 40 Hz. Further, beta band can be splitted in smaller bands: beta 1 (12-16 Hz or 15-18 Hz),beta 2 (18-24 Hz) and beta 3 (24-30 or 30-40 Hz) [58].
20 3. Methods of Acquisition of the Signals of the Brain - EEG Acquisition
Figure 3.1: The rhythms δ, θ, α and β of the brain.(adapted from [26])
3.2.2
Variability of EEG
In the context of subject susceptibility, the electroencephalographic signals show significant variability between individuals, also gender, age, handedness and behavioral state of the subject influence the contribution of the different rhythms to the electroen-cephalogram. Factors like neuro-pathological cases, metabolic disorders or influence of drugs, can also constitute alterations to the normal EEG pattern. Differences among sexes were reported [44], namely neuroanatomical differences and a pronounced functional asymmetry in males, also handedness should be taking into account as it influences the lateralization of functional patterns in the brain (see [58] for some examples of studies). The degree of maturation of the EEG, implicated with age is also extremely important when elaborating conclusions because alterations among the human-scale of life and lead to wrong interpretations (see [26] for details on maturation of the EEG).
3.3
Protocols in EEG Acquisition
3.3. Protocols in EEG Acquisition 21
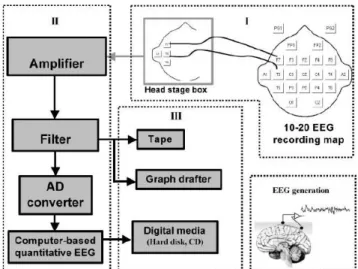
and data storage - I will follow this logical division in my exposition. The figure below illustrates all the phases of the process.
Figure 3.2: Schematic representation of the EEG recording system divided in 3 parts - Electrodes and Head Stage (I), Pre-processing (II) and Data Storage (III). (extracted from [116])
3.3.1
Electrodes and Head Stage
Accordingly with the information provided in the last sections, the electroen-cephalogram reflects the electrical activity of the surface of scalp, it furnishes a measure of the potential difference between two electrodes. A pair of electrodes is connected to a channel amplifier constituting a derivation (see subsequent section), trough a certain montage. This one can bereferential (unipolar) - if the measured difference is always rel-ative to one active electrode situated under the region of the brain we desire to study and the other, the reference electrode situated in a part of the body such as the earlobe, the nose, the mastoid, the chin, the neck or the scalp center and thebipolar recording setup
- this considers the electrodes active and performs the difference between them. Besides these conventional montages, there are others that permits to individualize better the information of each channel, that is the case of the common average reference recording that subtracts to the channels the computed average of all recording electrode signals. With this performing the signal is not subjugated by local contamination although, in-stead is sensitive from artifacts in the whole brain. In fact, the system reference is made by means of connect all the electrodes to a common point trough equal high resistances [126]. Pragmatically, it can be implemented by linking the referential-ears, for using a common usual clinical example [58].
At last, there is a claimed reference-free technique called Source derivation or
Laplacian recording. A more profound review on other strategies as well as the possible
stud-22 3. Methods of Acquisition of the Signals of the Brain - EEG Acquisition
ied better in the development of this thesis regarding problems in coherence identification (see section 4.7).
Electrodes
The scalp electrodes are electrical potential sensors capable of detecting charges in a surface cortical surrounding area of 6 cm2 and as deep as several millimeters [116].
The designation sensor is used for transducers that convert a physical measurand to an electric output [126] and such is this case in which a biopotential is converted in an elec-trical measure.
There are a lot of different types of electrodes such as needle and sphenoid elec-trodes but in clinical routine the ones commonly used due to the not invasive character are the surface electrodes. In order to obtain a meaningful signal is desirable that the connection scalp-electrode maintains an impedance nearly to 5 kOhms [26] so, to opti-mize the results usually the electrodes are cleaned with alcohol and a gel is applied in the contact to augment the conductivity and help electrodes remaining in the right position.
The 10-20 system
3.3. Protocols in EEG Acquisition 23
Figure 3.3: The position of electrodes in the 10-20 system. (adapted from [126] electrodes were also re-labelled, namely T7/8 for T3/4 and P7/8 for T5/6 although this new adoption is not always followed [58].
Besides the electrodes of the 10-20 system usually are utilized also electrodes to monitor eye movement (EOG), electrocardiographic (ECG) and electromiographic (EMG) signals which must be segregated from the electrical activity provenient of the brain and treated as artifacts [26].
It is interesting to observe also the relation between the position of the electrodes and the regions of the brain and the underlying Brodmann areas. The Table 3.4 below resumes this information in an expressive way.
3.3.2
Preprocessing
24 3. Methods of Acquisition of the Signals of the Brain - EEG Acquisition
Figure 3.4: The cortical areas and Brodmann areas underlying each electrode in the 10-20 sys-tem. [58])
mode rejection ratio (typically, between 80 and 120 dB [79]) to minimize the artifacts due to common-mode voltages intrinsic in the utilization of bipolar electrodes, high in-put impedance (at least 10MΩ in modern amplifiers) to avoid excessive loading which would cause distortion, low output impedance relatively to the load impedance in order to maintain maximal fidelity, limited bandwidth to augment the signal-to-noise ratio, high gain (∼1000 or greater) in order to amplify the extremely low voltages of the elec-troencephalografic signal and yield its recording and processing, must have isolation and protection circuitry to protect the patient from microshocks and macroshocks and yield a quick calibration[126, 116]. It is relevant to refer that this necessary amplificatory stage produces the undesirable consequence of adding noise to the signal, filtering the signal and affecting the phase relationship between the diverse frequency components contained in the signal [101].
3.4. EEG in the context of other Brain study techniques 25
Figure 3.5: Different types of ba-sic filters and respective frequency response. (extracted from [79])
3.3.3
Data Storage
In the early days of Electroencephalography, the EEG was recorded on a paper or saved in an analog tape [116]. Nowadays the analog EEG fell in disuse and it was entirely replaced by the digital EEG saved in hard disks or compact disks that is extremely more valuable for a quantitative analysis of the data. Due to the limitations of the computer memory and hardware there is a need to convert the analogue values to digital ones using for the effect a analogue-to-digital converter (ADC). This device is a restraining factor of the resolution of the Electroencephalogram, it is characterized by the amplitude resolution and the rate of digitization (sampling frequency) being the former given in 12 or 16 bits AD-conversion and the latter that being limited to the Nyquist theorem yields a resolution of the inverse of the sampling frequency[101].The ADC is composed by a converter, a clock that imposes the converting rate and the control logic, all bits are converted in parallel using highspeed precision comparators associated with a precision resistor network [79].
3.4
EEG in the context of other Brain study
tech-niques
26 3. Methods of Acquisition of the Signals of the Brain - EEG Acquisition
Single-photon Emission Tomography (SPECT),Positron Emission Tomography (PET),
Magnetoencephalography (MEG), Magnetic Resonance Spectroscopy (MRS),
Hemoen-cephalography(HEG), Transcranial Magnetic Stimulation (TMS), Event-related
Opti-cal Signals(EROS), Near-Infrared Spectroscopy (NIRS) as well as continuous and
event-related Electroencephalography EEG [58][103].
3.4.1
EEG and an overview of the Hemodynamic Response based
techniques
There are a lot of tools in brain imaging concerning principles related to the hemodynamic response, an explanation of each of them is not the goal of this thesis, I will merely focus in the fMRI, PET and TMS which are according with [103] the principal tools which have been used for studying functional connectivity as by means of correlation analysis of data of the formers or by conjunct use of the latter with other neuroimaging methods and though could be alternative solutions to the EEG coherence tool.
EEG and fMRI
Firstly, although the hemodynamic response based techniques seem promissory due to its better spatial resolution and capacity of yield information above the scalp EEG (they can study structures like the cerebellum or the subcortex) still, even if with the ap-proximated resolution of one cubic millimeter of the fMRI which contains a great amount of pyramidal cells, the electrodes in the EEG can reach a total of more neurons [58].
3.4. EEG in the context of other Brain study techniques 27
in a measurement that is subject to the lag of the hemodynamic response [61].
As an extending advantage, the EEG rhythms play a role in information process along the brain and specially the highest information content is correlated with high-frequency rhythms (like gamma) that are originated from small neuron groups which are not so easily accessed by the other imaging techniques.
Further, Electroencephalography sums also others advantages namely, the fact that is by itself and comparing to others absolutely non expensive, its facility and portabil-ity being extremely utile when studying sensible populations like individuals with mental disorders and children that can be easily frightened by the magnetic resonance apparatus [58].
To conclude, EEG is a valuable technique due to its low-cost noninvasive and expedited procedure and portability, high precision in the temporal domain as well as a long story of seventy-five years of research on the maturation of this technique.
Still, there are other recent and not so explored methods for assessment of brain functional connectivity like the correlation analysis of PET or fMRI data or the com-bination of TMS with neuroimaging, although as it argued in [121] for studying brain coordination and self-organizing processes only the methods of EEG and MEG offer suf-ficient temporal resolution.
Towards a multimodal approach
28 3. Methods of Acquisition of the Signals of the Brain - EEG Acquisition
MRI: converging evidence, direct data fusion and computational neural modeling. For an example of application of a simultaneous EEG-fMRI the review in [95] introduces some of the key points of the methodology. Concerning the multi-modal scanning of EEG-PET it yields a lesser extent of artifact problems and it is shown to give consistent results, also the use of TMS combined with other functional neuroimaging technique was shown useful for study functional coupling. In the group of functional imaging, nowadays a re-cent technique is gaining prominence, its name is Diffusion Tensor Tractography (DTT) and yields better resolution above the voxel - based on the diffusivity principles of water molecules it permits to reconstruct the paths of white matter fibers and as though, can provide an insight of functional relation among different areas [103].
Still, considering the predominant role of temporal dynamics in the brain, alone it is natural to benefit from the EEG tool in a study of the functional connectivity of the brain.
3.4.2
EEG and MEG
These two techniques permit to obtain information of brain electrical activity,
i.e. are the electrophysiological methods of mapping the brain. Magnetoencephalography (MEG) is a relatively new technology which is based on measuring the magnetic field generated by the pyramidal neurons. Once this magnetic field is perpendicular to the electric field, the sensors must be positioned tangentially to the apical dendrites. MEG offers above all its advantages the one that it does not require so much knowledge on the geometry of the head and volume conductive properties to modeling the signal. In fact, the head tissues are not magnetic and though have nearly the same magnetic permeability (µ) consequently the magnetic field can merely depend on the locations and orientations of the sources and the sensors. On the other hand, in the EEG there is an attenuation of the signal due to the skull and a distortion due to the so-called ”shunting effect”, phenomenon of a wide distribution of the electrical fields in the head surface caused by the difference in the electrical conductivity between the spinal fluid and the overlying skull [103].
Nevertheless, EEG is sensitive to the tangential and radial sources which is a clear advantage regarding the MEG that only detects electrical information concerning the tangential sources. MEG also implies extremely higher cost and it is more sensible to artifacts produced by head’s movement, characteristics that make the EEG a extremely valuable option.
3.5. EEG Temporal and Frequential Analysis 29
Figure 3.6: Comparison of detection of cortical neuronal activity by EEG, MEG and PET/fMRI. (reproduced from [103])
resolution than EEG conceals but this may not be true. Hence, due to the significant distance between the magnetometer coils and the sources MEG information shows a great extracranial coherence (field spread effects to the sensors), even in the cases the underlying sources are completely non correlated [94].
As a conclusion, both techniques cannot be seen as competitive between each other because in a certain way they salient different aspects of the neocortical dynamics, there are examples of studies that they have showed different aspects (see [103] for review of some) which means they can offer complementary information. In the work of [94] it is concluded that EEG coherence is preferentially sensitive to large-scale source distributions covering a significant part of gyral crowns and MEG coherence to small isolated dipole layers in sulcal walls, being always both affected by volume conduction (MEG in a lesser extent when electrodes are far away from each other), suggesting that the two tools yield information from different sources and that MEG does not cover a so wide field as the EEG. In that context, an important factor when choosing the preferred tool is to understand in what type of cortical sources it is the information we want to study, without knowing that it is difficult to decidea priori what is the best approach [103].
As a conclusion, Electroencephalography is a valuable way of studying brain functional relations and although showing some counterparts, it is a much lesser expensive and more mature technique, extracting information of a great number of sources.
3.5
EEG Temporal and Frequential Analysis
In the earlier days of Electroencephalography, its analysis relied mainly in visual inspection of the recordings made on paper. With the development of technology and the digital EEG this technique was on and on substituted or used with the aid of automatic ways of extract information [26]. Nowadays, this inspection is still a lot used for detection of transient features in an electroencephalogram trace.
classi-30 3. Methods of Acquisition of the Signals of the Brain - EEG Acquisition
fied into linear and nonlinear approaches. The conventional EEG analysis is based on the measure of the spectrum and has naturally, the implication of stationarity of EEG process although, EEG signal is non stationary and nonlinear in the most part of the cases and especially in pathological states of the brain.
Analysis evolved also in a way that provide relevant advantages in the way it can provide fine details on frequency and also where the dynamic changes of frequency occur in a temporal scale. The simplest of these approaches is the Short Time Fourier Transform (STFT) which permits increasing time resolution but not much, for more ac-curate computations it can be used or the Wigner-Ville Distribution (WVD) that is the FT of the autocorrelation function of a given signal with respect to a delay variable and offers a significant upgrade in time and frequency resolution. The Wavelet Transform that utilizes a scalable function instead of a fixed-scale window function provides an adaptive time-frequency analysis method outstanding selectively what we prefer to have more ac-curacy – time precision for transient waves, frequency acac-curacy for slow waveforms. This methods will be more in-depth highlighted in chapter 4.
Considering now the Nonlinear Methods, they assent basically in three sub-divisions: Methods on Information Theory-Based Analysis, Methods on High Order Statistics and Chaotic Measures. All of these consider that EEG signals are random processes and enclosed in the first group exist (for measure of order/disorder of a time se-ries) an extensive study of formalisms for calculation of Entropy Values and, for extracting relations of interdependence between different cortical areas, we may use the computation of Mutual Information. On the topic of High-Order Statistics (HOS) we must salient its importance relatively a first-order statistical analysis (power spectrum) once it provides information also in phase coupling (synchronization), it most commonly used calculations are the bi spectrum (which is the FT of the third-order cumulant) and bi coherence. Afterwards, to conclude the descriptions of Chaotic Measures can include nonlinear dy-namic computations such as dimension estimation ( correlation dimension, information dimension, capacity dimension and multifractal spectrum), Lyapunov exponent spectrum, Poincare maps, Kolmogorov-Sinai Entropy and Approximate Entropy [116].
Chapter 4
Coherence on
Electroencephalography
"The real voyage of discovery consists not in seeking new landscapes but in having new eyes."Marcel Proust
The idea of this chapter is to cover all the basic theoretical details this work involved. Some parts are developed in an extensive way, sometimes with more detail than the absolutely necessary for the experimental work. The main goal was, having in mind that the present project will be continued by others, to give a solid background from which to start from, an ideal framework adapted for the present case-study. The specific theoretical considerations of each chapter are not presented here. Synthetically, the ultimate goal is to make an approach to the coherence tool in EEG applications.
4.1
Brief Historical Remarks on EEG Coherence
Studies on EEG Coherence started to being developed around forty years ago, D. O. Walter (1968) was the first to publish a work on relationships between EEG signals. Before that, studies on the subject were limited by the lack of adequate mathematical algorithms, computational power and software [127]. Consequently, the first full paper was published in 1970 by Gersh and Goddard’s and was referred to studies on coherence and partial coherence for infer the positions of epileptic foci. Since then and specially round ten years later, a lot of coherence applied studies was performed in the clinical field (studies of epilepsy, dementia, multiple sclerosis. . . ) and in the cognitive context (studies
![Figure 2.1: The seven main parts of the Cen- Cen-tral Nervous System. (adapted from [27]) prevalent with a lot of modifications suffered through the years, in Figure 2.2 part b) and c) one can see the division in the 52 distinct areas.](https://thumb-eu.123doks.com/thumbv2/123dok_br/16535726.736525/29.892.129.465.129.459/figure-nervous-adapted-prevalent-modifications-suffered-division-distinct.webp)
![Figure 2.7: Brain as a network. (reproduced from [38])](https://thumb-eu.123doks.com/thumbv2/123dok_br/16535726.736525/37.892.132.797.140.391/figure-brain-network-reproduced.webp)
![Figure 3.1: The rhythms δ, θ, α and β of the brain.(adapted from [26])](https://thumb-eu.123doks.com/thumbv2/123dok_br/16535726.736525/42.892.156.695.127.449/figure-rhythms-δ-θ-α-β-brain-adapted.webp)
![Figure 3.3: The position of electrodes in the 10-20 system. (adapted from [126]](https://thumb-eu.123doks.com/thumbv2/123dok_br/16535726.736525/45.892.185.752.133.518/figure-position-electrodes-adapted.webp)
![Figure 3.5: Different types of ba- ba-sic filters and respective frequency response. (extracted from [79])](https://thumb-eu.123doks.com/thumbv2/123dok_br/16535726.736525/47.892.219.464.131.461/figure-different-types-filters-respective-frequency-response-extracted.webp)