Licenciatura em Ciências de Engenharia Biomédica
Development of a Non-Invasive
Brain-Computer Interface for
Neurorehabilitation
Dissertação para obtenção do Grau de
Mestre em Mestrado Integrado em Engenharia Biomédica
Orientador:
Hugo Ferreira, Prof. Auxiliar, IBEB, FCUL
Júri:
Presidente: Prof. Doutora Carla Quintão Pereira Arguente:
Copyright cRui Dinis Ribeiro da Silva Pinto, Faculdade de Ciências e Tecnologia, Uni-versidade Nova de Lisboa
First and foremost, I want to show my gratitude to my Dissertation adviser for giving me the opportunity to carry out a project in an area for which a have a keen interest: Brain-Computer Interfaces. I would like to thank everyone atIBEBthat has helped me and gladly volunteered to take part of the studies I conducted. I would also like to acknowledge the staff and faculty of my University,Faculdade de Ciências e Tecnologia da Universidade Nova de Lisboafor providing me with the academic tools and expertise to carry out my thesis, and hopefully to build a strong professional career.
Secondly, I want to thank all my friends for providing moral support and inspiration. My university pals,A Centopeiaand my recent friends that have accompanied me through-out a bumpy year. Also, a special thanks to my Erasmus buddies, theWolfpack, who give me the drive to work hard so we can reunite as often as possible. Lastly, I want to thank my good friends from the North, whom I have met the longest, and always provide an escape to the troublesome life in the Capital.
Neurological disorders, in particular Stroke, have an impact on many individuals worldwide. These individuals are often left with residual motor control in their upper limbs. Although conventional therapy can aid in recovery, it is not always accessible, and the procedures are dull for the patient. Novel methods of therapy are being developed, including Brain-Computer Interfaces (BCIs). Although BCI research has been flourishing in the past few years, most rehabilitation applications are not yet suitable for clinical practice. This is due to the fact that BCI reliability and validation has not yet been achieved, and few clinical trials have been done with BCIs. Another crucial factor, is that modern BCIs are often comprised of inconvenient hardware and software. This is a major factor of aversion from both patients and clinicians.
This Master Dissertation introduces theEmotivBCI: an easy to use platform for Elec-troencephalogram acquisition, processing and classification of sensorimotor rhythms with respect to motor action and motor imagery. The acquisition of EEG is done through 8 channels of theEmotiv Epocwireless headset. Signals are pre-processed, and the 2 best combinations of channel/frequency pairs that exhibit the greatest spectral variation be-tween the rest and action conditions are extracted for different time frames. These features are then used to build a feature matrix with 2 sets of attributes and 2 class labels. Finally the resulting feature matrix is used to train 3 different classifiers, in which the best is selected. The EmotivBCI enables users to keep record of their performances, and provides additional features to further examine training sessions. To assess the performance of the EmotivBCI, two studies were conducted with healthy individuals. The first study com-pares classification accuracies between two different training paradigms. The second study evaluates the progress in performance of a group of individuals after several training sessions.
As doenças neurológicas, em particular o acidente vascular cerebral (AVC), têm um impacto em muitos indivíduos por todo o mundo. Alguns indivíduos ficam com controlo residual dos membros superiores. A terapia convencional ajuda a recuperar algum do mo-vimento perdido, mas nem sempre é acessível e os procedimentos são monótonos. Novos métodos de terapia estão a ser desenvolvidos, incluindo Interfaces Cérebro-Computador (BCIs). A Investigação nesta área tem vindo a aumentar nos últimos anos, mas as apli-cações relacionadas com reabilitação ainda não estão adequadas para a prática clínica. As BCIs ainda não alcançaram até à data um nível aceitável de confiança, além de que poucos estudos clínicos foram conduzidos. Outro factor crucial, é que BCIs modernos são compostos por equipamento e programas complexos, causando aversão por parte dos doentes e clínicos.
Esta Dissertação de Mestrado apresenta o EmotivBCI: Uma plataforma prática de aquisição, processamento e classificação de sinais de electroencefalografia (EEG), baseada em ritmos senso-motores com respeito a acção motora e imagética motora. A aquisição de EEG é feita a partir de 8 canais do equipamento wirelessEmotiv Epoc. Os sinais são pré-processados e as duas combinações do par canal/frequência que exibem a maior variação espectral entre a condição de descanso e acção são extraídas em diferentes intervalos temporais. Estas características são depois usadas para construir uma matriz com dois conjuntos de atributos e duas classes. Finalmente, a matriz é usada para treinar três classificadores diferentes, do qual o melhor é seleccionado. O EmotivBCI permite aos utilizadores manter um registo do seu desempenho e tem funções adicionais de análise. Para avaliar o desempenho do EmotivBCI foram conduzidos dois estudos com indivíduos saudáveis: o primeiro estudo compara a precisão de classificações entre dois paradigmas de treino e o segundo estudo avalia o progresso no desempenho de um grupo de indivíduos após várias sessões de treino.
List of Figures xvii
List of Tables xix
Glossary xxi
1 Introduction 1
1.1 Motivation and Context . . . 1
1.1.1 Stroke . . . 1
1.1.2 Conventional Stroke Therapy . . . 2
1.1.3 Outlook of Stroke Therapy . . . 3
1.1.4 BCIs in Rehabilitation . . . 6
1.2 Objectives . . . 8
1.3 Dissertation Overview . . . 9
2 Background 11 2.1 Nervous System and the Brain . . . 11
2.1.1 Cerebral Cortex . . . 12
2.1.2 Neurons . . . 12
2.1.3 Neuroplasticity . . . 13
2.2 Electroencephalogram (EEG) . . . 14
2.2.1 Desynchronization of Sensorimotor Rhythms. . . 15
2.3 Brain-Computer Interface . . . 16
2.3.1 BCI: Synchronous and Asynchronous interfaces . . . 17
2.3.2 BCI: Invasive and non-Invasive . . . 17
2.3.3 Performance of BCI systems. . . 17
2.4 Signal Processing and Feature Extraction . . . 18
2.4.1 Artefact Reduction . . . 19
2.4.2 Power Spectral Density . . . 20
2.5 Classification Algorithms . . . 21
2.5.1 Naïve Bayes . . . 21
2.5.2 Gaussian Support Vector Machine . . . 21
3 Development of EmotivBCI 23
3.1 Overview. . . 23
3.1.1 Materials. . . 24
3.1.2 Getting Started . . . 26
3.2 Training Session . . . 26
3.2.1 Training options . . . 27
3.2.2 Training paradigms. . . 27
3.3 Processing Cascade . . . 27
3.3.1 Signal Processing . . . 28
3.3.2 Feature Extraction . . . 29
3.3.3 Feature Matrix Construction . . . 29
3.3.4 Classification . . . 30
3.4 Other Features . . . 31
3.4.1 Online BCI - Real-time Testing . . . 31
3.4.2 Generate Feature Map . . . 32
3.4.3 Generate Channel PSD . . . 32
3.4.4 Generate Classification Data . . . 32
3.4.5 Miscellaneous . . . 32
3.5 EmotivBCI: Wrap-up . . . 33
4 Assessment of EmotivBCI 35 4.1 Task Formulation . . . 35
4.2 Study 1: Training Paradigm 1 Vs. Training Paradigm 2. . . 36
4.2.1 Motor Action Results and Analysis. . . 36
4.2.2 Motor Imagery Results and Analysis. . . 37
4.3 Study 2: Evolution of Performance with Practice . . . 39
4.4 Miscellaneous Analysis . . . 43
4.5 Discussion . . . 45
5 Conclusion 47 5.1 Future Developments . . . 48
5.1.1 Emotiv headset and Hardware . . . 48
5.1.2 Signal Processing . . . 49
5.1.3 Visual Interface and Visual Stimuli . . . 49
5.1.4 Further tests and validation . . . 50
5.2 Outputs. . . 50
Bibliography 51 A EmotivBCI User Guide 67 A.1 Getting started. . . 67
A.3 New Training Session . . . 67
A.3.1 Training Session Performance . . . 68
A.3.2 Generate Feature Map . . . 68
A.3.3 Generate Channel Power Spectral Density . . . 68
A.3.4 Generate Classifier Data . . . 68
A.3.5 Online BCI. . . 68
A.4 Useful commands . . . 69
B REHAB 2015: Development of a non-invasive Brain Computer Interface for
1.1 Conventional BCI system. . . 8
2.1 Diagrammatic representation of 10–20 electrode settings for 75 electrodes. Adapted from [94]. . . 14
2.2 Block Diagram of a BCI system. . . 16
3.1 Visual representation of the EmotivBCI and the main features it comprises. . 23
3.2 The Emotiv Epoc: hardware and electrode positions. Adapted from [112]. . . 24
3.3 Class diagram of the EmotivBCI. . . 25
3.4 Adjustment of electrodes from the standard Emotiv position. . . 26
3.5 Diagram of the Feature Extraction processing cascade.. . . 28
3.6 Diagram of the Feature Matrix construction. . . 30
3.7 Features of the EmotivBCI.. . . 31
4.1 Study 1: Box plot analysis between TP-1 and TP-2 for Motor Action. . . 37
4.2 Study 1: Box plot analysis between TP-1 and TP-2 for Motor Imagery. . . 39
4.3 Study 2: Motor Action classification accuracies of 4 subjects over 3 training sessions. . . 39
4.4 Study 2: Motor Imagery classification accuracies of 4 subjects over 3 training sessions. . . 40
4.5 Study 2: Average subject performance over the 3 training sessions. . . 40
4.6 Performance with respect to training option for both studies. . . 43
4.7 Performance with respect to mood. . . 43
4.8 Results from survey. . . 44
3.1 Description of functions developed in Matlab . . . 25
3.2 Comparison between TP-1 and TP-2. . . 27
4.1 Study 1: Motor Action Classifications between TP-1 and TP-2 for 4 subjects. . 37
4.2 Study 1: Motor Imagery Classifications between TP-1 and TP-2 for 4 subjects. 38
4.3 Study 2 - Motor Action classification accuracies across 3 training sessions for 4 subjects. . . 42
4.4 Study 2 - Motor Imagery classification accuracies across 3 training sessions for
ALS Amyotrophic Lateral Sclerosis.
BCI Brain-Computer Interface.
CNS Central Nervous System.
DT Decision Tree.
ECoG Electrocorticogram.
EEG Electroencephalogram.
EMG Electromyography.
ERD/ERS Event-Related Desynchronization/ Event-Related Synchronization.
FES Functional Electrical Stimulation.
fMRI Functional Magnetic Resonance Imaging.
MEG Magnetoencephalogram.
NB Naïve Bayes.
PNS Peripheral Nervous System.
PSD Power Spectral Density.
SCI Spinal Chord Injury.
SVM Support Vector Machine.
C
H
A
P
T
1
I
NTRODUCTION
1.1
Motivation and Context
In the past, the idea of carrying actions only through the power of the mind was thought of absurd, even preposterous. However, about fifty years ago, a revolutionary idea was proposed, in which brain signals could be captured to trigger actions [1]. The idea showed promise, but the equipment and technology weren’t appropriate at the time to show conclusive results. It has been in the past twenty years that more attention has been drown to Brain-Computer interfaces and their applications in gaming and entertainment, but above all else in Rehabilitation [2]–[4].
A Brain-Computer Interface (BCI) is a system that enables brain activity to manipulate external devices. The range of applications of BCIs is extraordinarily wide, going all the way from leisure to rehabilitation, with hybrids of both in between [5]–[9]. The scope of this work focuses mainly on neurorehabilitation. There is a significant number of disabled people worldwide that have lost function of one limb, or the ability to walk or speak due to neurological disorders. Amyotrophic Lateral Sclerosis (ALS) and Spinal Chord Injury (SCI) are prime examples of such disorders.
This section, however, will focus on one disorder that has the greatest impact world-wide: Stroke. Moreover, conventional methods of therapy will be discussed followed by a look at the future direction of these methods. Finally, the role of BCIs in stroke rehabilita-tion will be addressed, including what aspects need to be improved in order to make BCIs a legitimate rehabilitation tool in the future.
1.1.1 Stroke
are affected every year [12]. In Portugal, from 2007 to 2011, the record of deceased people due to stroke was over 68500 [13];
Stroke, or cerebro-vascular accident (CVA), is defined as the abrupt onset of a non convulsive and focal neurologic deficit. There is a deep categorization of stroke types, but they fall under two main ones:Ischemicstroke orHemorrhagicstroke. Cerebral ischemia can be caused by reduction in blood flow (hypoperfusion), by blockage of a blood vessel via thrombosis or arterial embolism. In the case of hypoperfusion, when blood flow is finally restored within several seconds to a few minutes then the symptoms are said to be transient. If hypoperfusion lasts more than a few minutes theninfaction, or death of brain tissue, can occur. Cerebral hemorrhage is characterized by the accumulation of blood within neural structures [14].
The occurrence of stroke is characterized by several risk factors, some that are fixed, others that are modified[15], [16]. Examples of fixed risk factors are:
• Old age.
• Diabetes.
• Arterial fibrillation.
Modifiable risk factors include:
• High blood pressure.
• Tobacco smoking.
One of the most common non-hemorrhagic stroke is themiddle cerebral arterystroke, which mainly affects the upper limb. Although available rehabilitation therapies help the limb regain some function, many individuals are still left with chronic hand paralysis [17]– [19]. It can also result in speech formulation or visual impairment due to the malfunction in the brain where the stroke occurred [10], [20]. Treatment to recover lost function is termed Stroke rehabilitation. The following section will discuss some conventional techniques and procedures to rehabilitate lost limb function due to Stroke.
1.1.2 Conventional Stroke Therapy
Recovery from stroke is a rather complex process that is thought to occur through the combination of spontaneous and learning-dependent processes [21], [22]:
• Restitution: Restoration of functionality of damaged neural tissue.
• Substitution: Reorganization of neural pathways to relearn lost functions.
Stroke recovery and treatment depend on the individual, and has to be carefully assessed by specialists. The participation in formal rehabilitative therapy has been shown to improve stroke patients’ ability over time. However, not all patients have access to therapy because of geographic or socio-economic status [23]–[25]. There are different types of strokes that lead to different consequences. Patients that are unable to walk and require more human assistance and are more dependent in other self-care tasks are often admitted in hospitals. If patients have a certain degree of self-care, therapy is carried at home simply to refine the skills that can improve their functional independence at home and community where they live [21]. There are specific therapists for the different skills that need to be improved. Some of these can be physical, occupational and speech therapists [10], [23]. Their role is to promote the practice of specific tasks that are important to the recovery of the patient. They do this by setting realistic goals within the limitations of residual reflexive and voluntary neural control. Moreover, they plan a regimen of daily skills practice of progressive intensity and difficulty [23], [26].
Therapy for upper limb disabilities vary depending on severity [10]. The therapy for the hemiparetic arm or hand involves at an early stage the attempted movement of single joints, and then it proceeds to more complex, multi-joint actions [23]. Finally, the patient engages in task-specific movements, known asshaping, which could be the grasping of a coffee cup [23]. Another popular technique is called constraint-induced movement therapy (CIMT) [27], and it consists of restraining the unaffected limb to promote the use of the affected one. This can ultimately lead to faster and improved movement of the affected limb.
The previous mentioned interventions have shown to be efficient only in patients that have a high enough degree of residual control in their affected limbs. For patients that have very weak hand movement and control, other methods of therapy are applied. These mainly consist of the use of commercially available forearm-hand orthotic devices with functional electric stimulation that can enable the grasping of the hand or finger pinch [23], [28], [29]. Mechanical devices are currently used as a supplement to standard care, and they have shown to be beneficial [30]. However, standard therapies with equivalent intensity can achieve the same outcome, and the use of these devices is more of a luxury, since they are generally expensive [23]. Ongoing research focuses on the use of mechanical devices with other rehabilitative therapies like non-invasive brain stimulation to achieve a higher efficacy in rehabilitation of patients after stroke [23].
1.1.3 Outlook of Stroke Therapy
Ideally, stroke therapy should rely less on therapists, and more on technology to achieve the same end. This is mainly due to the high number of stroke patients in com-parison to the limited number of therapists [23], [24], [31]. Therapy itself should also be more engaging to the patient, instead of the conventional dull exercises. Motivation and engagement have been shown to be an important aspect in recovery success [32]–[34]. Fortunately, new approaches to therapy have surfaced in the last decade that have helped face this challenges.
The following sections will address a few of the new facets of stroke therapy, namely Virtual Reality (VR), Robotics and Functional Electrical Stimulation (FES). Finally, the current, and future, role of BCIs in stroke rehabilitation will be discussed, addressing its advantages and limitations.
1.1.3.1 Virtual Reality
Although Virtual Reality (VR) is often associated with gaming and entertainment, it has shown promise in helping to rehabilitate stroke patients [35], [36]. VR is a computer interface that allows individuals to interact with a three-dimensional (3D) environment by presenting simulated or artificially generated sensory information [37]. This interaction is made possible by the movement of the user/patient, which is captured through proper motion tracking equipment.
There are two main types of VR:ImmersiveandNonimmersive. Immersion VR is char-acterized by the environment being viewed using a head-mounted display (HMD) with tracking systems [37]. This makes the user feel like he is within the virtual enviornment, with all the images being updated according to the movement of the user’s head. Some-times this results in what is calledsimulator sickness. Nonimmersive VR can be viewed in a computer monitor which projects a wide field of view, giving the perception of looking through a window. There are a variety of devices that allow interaction with the VR environment like data gloves, joysticks and force feedback technology [37].
The main focus of a VR rehabilitation system is to simulate real world tasks into a virtual platform so that stroke patients with motor impairments can practice such tasks safely and transfer the performance of the virtual task onto the real world. One example stated by Glendinning et al. [37] consisted of mailing an envelope into a "mailbox slot". The patient did this by matching the hand trajectory that was presented in the virtual environment, performing the delivery. Another forthcoming application involving a VR system is driving simulators. This will allow patients to practice safe driving trips, while the therapist can oversee and grade the task. There are plenty other applications and real-world task related activities being simulated on VR systems [38], [39].
high degree of expertise to develop such programs in a VR environment. Moreover, older people may have some reluctance in utilizing this technology [40]. All of these drawbacks, however, can be overcome in the future after further research and assessment. Ultimately VR can provide a cost-effective way of rehabilitation for patients with motor impairments, being convenient for both the patients and the therapist.
1.1.3.2 Robotics
Robotic systems have an important role in the rehabilitation of patients with stroke. Budget cuts and a limited number of physical therapists have propelled the development of new technologies to provide the same intensity of rehabilitation sessions to stroke patients [31]. Robot training can provide therapists the tools to increase productivity of training sessions, maintaining the same quality of care [41].
There is a deep categorization for upper limb robotic systems. There are robots de-signed for shoulder, elbow, wrist, and hand movement. According to their mechanical characteristics, robotic systems can be classified intoExoskeletonsandEnd-effectors[31].
Exoskeletonshave robot axes aligned with the anatomical axes of the user. They provide direct control of individual joints, which can correct abnormal posture and movement.
End-effectortype devices work by applying mechanical movement to the distal segments of the limbs. Even though they are easy to set-up, they offer limited control of proximal joints of the limb, and can result in abnormal movement patterns [42].
The use of robotic systems for rehabilitation has positively influenced the motor outcome of upper limbs in patients with stroke [41]. Their main advantage is that they can provide therapy for long periods of time, in a very consistent and precise manner. They can be designed to perform almost any type of functional therapy. This is highly beneficial for both the patient and the therapist, who has more time to assist other patients, without jeopardizing their rehabilitation process [31].
Ongoing research of robotic technology for neurorehabititation focus not only on enhancing their efficacy, but also in reducing the cost of these devices [42]. It is unlikely that robotic systems will ever replace therapists, but they have proven to be a useful support in the rehabilitation of stroke patients.
1.1.3.3 Functional Electrical Stimulation
There are several upper extremity FES devices available and the use of these devices have shown to have a positive effect in stroke therapy, specially when administered within the first 6 months after onset [46], [49]. The improvements in motor function due to FES have been attributed to a better ability of patients to voluntarily contract impaired muscles. Reduced spasticity, improved muscle tone in stimulated muscles and increase in joint range of motion were also resulting factors of FES therapy [46].
Besides the discussed functional effects, FES is believed to facilitate neural plasticity by increasing the strength of afferent inputs [49]. FES therapy can be even more advantageous when complemented with other therapies and devices. Particularly, FES used simultane-ously with an EMG sensor as feedback, has shown that it can promote motor learning [49]. Thus, patients can actively participate in intensive and repetitive task-specific train-ing, which is essential for recovery. The neural mechanisms underlying improvement in sensorimotor function by FES are still not fully understood [48].
1.1.4 BCIs in Rehabilitation
The main principle behind the use of BCI as a rehabilitation tool is that it can induce cortical plasticity by training through feedback [50], [51], [67]. When subjects are trained to operate a BCI system, visual or other sensory feedback is presented to subjects in real-time. Over time, subjects improve their performance in controlling the BCI system, and this is correlated with an enhanced modulation of the recorded brain signals. Moreover, there is evidence that combining BCI with functional electrical stimulation (FES) or assistive robotics may aid motor relearning in stroke patients [55], [68].
In particular, some research groups are focused on the feasibility and effectiveness of BCI systems that combine action observation and motor imagery to enhance neuroplas-ticity and facilitate motor recovery of disabled patients [69]–[71]. In essence, both action observation and motor imagery can induce a certain degree of motor cortical activity, even in the absence of actual movement. This way, BCI systems could better optimize their decoding algorithm to extract motor-related information from the patient’s cortical activity, therefore allowing them to intuitively learn how to control and operate the BCI. Ultimately, the enhanced performance of the patient would translate into an improvement in motor function recovery, while keeping the patient engaged through real-time feedback of his or her actions. Additionally, BCI systems can also be used as a monitoring tool. Clinicians can monitor the level of attention directed towards the different tasks and the level of inter-hemispheric balance, which is an indicator of stroke recovery [67].
In spite of the groundbreaking achievements of BCI research, most of the applications are still limited to public demonstrations and laboratory settings [50]. Most studies and gathered data are often from healthy individuals or animals, and studies with disabled people have been limited to a few trials, closely supervised by research personnel. The use of BCI technology in a clinical setting is just beginning.
1.1.4.1 Current Limitations of BCIs in Rehabilitation
Shih et al. [50] clearly elaborates the three major areas that need improvement in order for BCIs to become a legitimate rehabilitation tool in the future. Summarily, they are:
1. Development of comfortable, convenient and stable signal-acquisition hardware;
2. BCI validation and dissemination;
3. Proven BCI reliability and adaptable for different user populations;
electrodes are aligned, they are aesthetically displeasing and mildly uncomfortable. The present dissertation presents a new BCI prototype which tackles some of these drawbacks by using a commercially available wireless EEG headset:Emotiv EPOC. As this prototype undergoes further development, it may potentially become part of a clinical rehabilitation system in the future.
Figure 1.1: Conventional BCI system comprised of wired electrode cap and amplifier. Adapted from [1].
1.2
Objectives
This project has been conducted at the Instituto de Biofísica e Engenharia Biomédica and it consists of aproof-of-concept non-invasive Brain-Computer Interface:EmotivBCI.
The EmotivBCI is a simple, yet robust, BCI platform for EEG acquisition, processing and classification of sensorymotor rhythmical activity in the central to frontal cortex of the brain with respect to motor action and motor imagery of the upper limbs: in particular the Left and Right hands. The signal acquisition is done through the commercially available EEG headset: Emotiv Epoc. Moreover, the EmotivBCI provides additional features to analyse acquired data, and keeps record of users’ performances.
In this Dissertation two studies will be presented to provide a general assessment of the EmotivBCI. The first aims at comparing two different training paradigms, and the second study aims at analysing the evolution in performance of a particular set of users after several sessions of training using the EmotivBCI.
1.3
Dissertation Overview
The present dissertation is structured as follows:
• Chapter 1:Presents the motivation and context behind the topic, followed by the objectives and outline of this dissertation.
• Chapter 2:Provides the general background on the concepts that are closely tied to the scope of this dissertation.
• Chapter 3:Introduces the EmotivBCI and describes the materials and methods used to develop it.
• Chapter 4:Presents two different studies that were conducted to assess the perfor-mance of the EmotivBCI and summarizes relevant results.
C
H
A
P
T
2
B
ACKGROUND
The field of Brain-Computer Interfaces (BCIs) embraces a myriad of different scientific areas ranging from brain physiology to electronic hardware and signal processing al-gorithms. Throughout this chapter, the most relevant concepts surrounding the scope of this dissertation will be reviewed. It will start by introducing the Human Nervous system, the Brain, and one of its most fundamental properties: Neuroplasticity. Next, the most common non-invasive technique to assess brain activity will be discussed, the EEG. Particular attention will be given to sensorimotor rhythms in the cerebral cortex, which is detected by EEG and that is tightly correlated to motor activity and motor planning. Finally, a detailed review of Brain-Computer Interfaces will be provided, as well as Signal Processing, Feature Extraction and Classification techniques which are an integral part of this project.
2.1
Nervous System and the Brain
The nervous system is responsible for communicating and processing information from the various body parts. It is divided into the Central Nervous System (CNS), which consists of the brain and the spinal chord, and the Peripheral Nervous System (PNS), which connects the brain and spinal cord to all the body organs and sensory systems. These systems work closely together since the sensory input from the PNS is processed by the CNS, and the responses are sent back by the PNS to the organs of the body. There is another important distinction within the nervous system based on functionality. The
activity and relaxation respectively [72].
2.1.1 Cerebral Cortex
From all the parts that compose the CNS, the cerebral cortex is by far the most important. Different regions of the cortex are responsible for processing different functions, such as sensation, learning, voluntary movement, speech and perception. The cortex is the outermost layer of the cerebrum and has a thickness of 2-3 mm. The cortical surface is characterized by having multiple ridges and valleys of different sizes that increase the neuronal area, which is comprised of about 10 billion neurons [72].
The cortex is separated by a deep sagittal fissure, called thecentral sulcus, into two symmetrical hemispheres: left and right. Each hemisphere is further divided into four lobes: the frontal, temporal, parietal and occipital lobes [72], [73].
The motor cortex, located in the frontal lobe, is the main responsible for voluntary movement. Sensory information is processed in other parts of the remaining lobes [73].
2.1.2 Neurons
The building block of the nervous system is a specific type of cell calledneuron. Neurons are insulated, supported and nourished by another type of cells, calledGlia[74]. There are many different types of neurons that differ in morphology and function, but the main types aresensory neurons,motor neuronsandinterneurons[72]. These are composed of a body, denominated soma, in which two structures extend: thedendrites and axon. The dendrites are the extension of a nerve cell, in the form of a branch that carries impulses to the cell body. The axon is the long projection of a nerve cell that conducts impulses from the cell body to other cells. The transmission of information from neuron to neuron takes place at the junction where a terminal part of the axon contacts another neuron, the
synapse. The information is passed across neurons in the form of electrical impulses, which propagate along the axon membrane through ion-gated channel mechanisms [74].
2.1.2.1 Mirror neurons
Recently a new and special kind of neurons have been first found in monkeys and later in humans, calledMirror Neurons[75]. These are a particular kind of neurons that discharge not only when an individual performs an action, but also when he or she observes a similar action done by another individual [75]. The existence of mirror neurons was demonstrated in humans using non-invasive methods. It has been shown that other people’s action triggers the activation of several cerebral regions. EEG studies showed that mere observation triggers the desynchronization of cortical motor rhythms, with less intensity than during active movement [76]. The EEG and sensorimotor rhythms will be discussed a few sections below.
patient, meanwhile observing actual movement from another individual or segments of their own body, will promote the recruitment of mirror neurons and cortical reorganization that can reactivate motor neurons, resulting in the subsequent learning of new motor skills [77]. This is still a premature field, but the application of mirror therapies has shown good results when combined with other therapies showing promise in the better recovery of post-stroke patients [77], [78].
This is a key idea for the future of BCI rehabilitation techniques. Although the present project does not yet incorporate visual stimulus, it is a feature that is deemed essential in the future.
2.1.3 Neuroplasticity
The Central Nervous System (CNS) has a fundamental property that is responsible for its normal functioning, and how it responds to injury: Plasticity [79]–[81]. In simple terms, plasticity can be defined as the brain’s capacity to adapt to changing circumstances throughout the lifespan of any individual. More specifically, it comprises all the structural and functional changes in the nervous system that occur due to a myriad of actions and experience of any individual [80].
The nervous system is dynamic, and it is constantly modifying associations among neuronal elements in response to changing stimuli and learning [73]. There are multiple complex mechanisms that mediate plasticity, including changes in synaptic strength, axon sprouting, neurogenesis, unmasking of latent neural assemblies and modulation of inhibitory circuits [49], [82]. All these processes occur in accordance to homoeostatic balance. In neurological disorders, this balance shifts in favour of plastic changes, resulting in the reorganization of network connectivity [49], [80], [83].
Practice is an underlying factor for the acquisition of motor skills. It’s through repetition that movements are executed faster and more accurately [84]. Several animal studies have shown that motor learning leads to neuroplastic changes [81], [85], more specifically to long term potentiation in the primary motor cortex, also referred to as M1 [84]. Through non-invasive techniques, the same kind of neuroplastic changes after motor learning have been suggested in humans [84].
Motor Imagery (MI), can promote motor learning, through mirror neurons, as dis-cussed before. Moreover, recent studies have shown that MI increases M1 excitability, resulting in motor learning by mental practice [84], [86], [87]. In other words, motor learn-ing can be achieved by MI practice, leadlearn-ing to the development of neuroplasticity in the human primary cortex (M1). This knowledge can facilitate the development of pioneering techniques for neurorehabilitation.
stroke patients, however, have shown that there is an optimal time frame of two to three months after injury where neuroplastic changes are more accentuated [85], [88], [89]. Therefore rehabilitation strategies should focus on this time window to capitalize on optimal plasticity recovery.
2.2
Electroencephalogram (EEG)
Electroencephalograms (EEGs) are recordings of electrical potentials produced in the brain with high temporal resolution. The EEG is able to record rhythmic electrical activity from the human scalp, and it is mainly used in clinical settings to detect pathologies and epilepsies. It can also be used in research facilities to quantify and evaluate effects of new pharmacologic agents [90]. In the past, the EEG was analysed visually by a specialized individual, but with the advancement of technology, there are now computerized and more efficient methods of quantifying EEG changes. New methods for analysing EEGs are emerging on a regular basis [91]–[93], resulting in a better understanding of how the brain works.
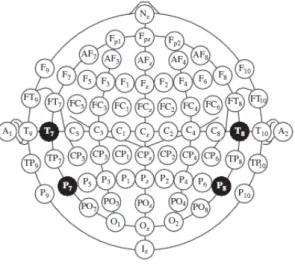
EEG acquisition systems vary in quality and complexity, but a basic system consists of electrodes, amplifiers and respective filters, and lastly a recording device. The signal obtained from the EEG comes from the potential changes over time between a signal electrode and a reference electrode. Unlike other biosignal measurements like the Electro-cardiogram (ECG), the readings from the EEG are relatively more abstract and harder to interpret at the naked eye. This is due to the spontaneous neuronal activity in the brain that is recorded at the level of the scalp. The signal from the EEG is highly dependent on the positioning of the electrodes in the scalp. A slight misplacement may completely fail to detect certain patterns. To establish some consensus between the scientific community, a 10-20 electrode placement (Figure2.1) system was adopted [90].
An EEG is mainly characterized by frequency and amplitude. These are highly diverse and depend mainly on the mental state of the subject [90]. The amplitude of the EEG is related to the degree of synchrony with which the cortical neurons interact, so a high amplitude signal is produced by a synchronous excitation of a group of neurons [74]. The frequency, or the oscillatory rate, of an EEG is partially sustained by the input activity from the thalamus. This part of the brain has neurons which possess pacemaker properties, so they have the ability to generate a self-sustained rhythmic firing pattern. Coordinated interactions between cortical neurons in specific regions of the cortex can also induce a rhythmic behaviour. Rhythms that have a high-frequency and low amplitude reflect an active brain (alertness or dream sleep). Low frequency and large amplitude rhythms are, on the other hand, associated with drowsiness and nondreaming sleep states [74], [90].
2.2.1 Desynchronization of Sensorimotor Rhythms
Two particular rhythms found in the central region of the frontal cortex are associated with sensorimotor activity:Mu rhythm(7-13 Hz) andBeta rhythm(15-30 Hz) [95], [96]. The planning and execution of limb movement has been shown to attenuate the spectral power in these frequencies. This phenomenon is designatedEvent-Related Desynchronization
(ERD). Going from movement back to an idle state, the amplitude of the spectral power in these frequencies increase back to its previous intensity i.e.Event-Related Synchroniza-tion(ERS) [96], [97]. Event-Related Desynchronization/ Event-Related Synchronization (ERD/ERS) phenomena have also been observed during motor imagery and action obser-vation [98], [99].
It has been demonstrated for quite a while that any given limb is mainly controlled by the contralateral hemisphere of the brain. Similarly, ERD/ERS is often stronger in the contralateral hemisphere of the brain as well. There is also some degree of activation on the other hemisphere also i.e. ipsilateral, which can be observed through imaging techniques and ERD/ERS. This knowledge makes it possible to detect the intention of moving each of the limbs, even if one hemisphere of the brain is lesioned.
ERD/ERS of sensorimotor rhythms, caused by motor imagery or actual movement can sometimes be difficult to observe in the EEG due to several factors. In particular, signal processing algorithms have to be efficient at capturing this change, while disregarding possible unwanted artefacts. Also, motor imagery detection depends greatly on the user’s capacity to produce valid signals. Moreover, the brain’s morphology varies slightly from individual to individual, therefore electrode placement may also be a factor preventing a clear detection of ERD/ERS in EEG signals [96].
2.3
Brain-Computer Interface
The human brain is the main organ responsible for coordination and movement, through electric impulses that travel from the brain to the peripheral nerves and back. When movement loss occurs due to stroke or other neurological disorders, the electric impulses are no longer propelled correctly. However, electrical activity of the brain can be acquired through the scalp and processed to trigger actions, through a BCI. A BCI, sometimes also referred as Brain-Machine Interface (BMI), is a set of hardware and software commu-nications system that enables humans to interact with their surroundings, without the involvement of peripheral nerves and muscles, by using control signals generated from the brain’s electric activity [96].
Figure 2.2: Block Diagram of a BCI system. Adapted and modified from [72].
A conventional BCI system is comprised of five consecutive stages:
1. Signal acquisition;
2. Pre-processing or signal enhancement;
3. Feature extraction;
4. Classification;
5. Control interface;
recording. Afterwards, the signal is mapped onto a vector containing effective and discrim-inant features from the observed signals. This feature vector must be of low dimension, so that fast processing can be achieved with acceptable efficiency. The classification stage classifies the signals based on the feature vectors. Finally the control interface is where the classified signals are translated into actions and commands [96]. Figure2.2shows a diagram with the main building blocks of a standard BCI.
2.3.1 BCI: Synchronous and Asynchronous interfaces
A BCI can be generally categorized into two main types:SynchronousandAsynchronous
interfaces. A Synchronous interface analyses EEG evoked potential signal resulting from stimuli received by the user from the system [101]. These can be visual, auditory or tactile stimuli. The processing consists of detecting responses from the brain activity to the stimuli, later transforming them into commands. An Asynchronous interfaces analyses the user voluntary activity in contrast to the user receiving any stimuli. In this case, the system continuously analyses the signals from the user’s brain activity and classifies the mental state periodically [96], [101].
2.3.2 BCI: Invasive and non-Invasive
BCIs are also categorized according to invasiveness [1], [96]. If the electrical activity is acquired from the surface of the scalp using the EEG they are said to benon-invasive.
Invasiveinterfaces require the installation of electrodes inside the skull, like electrocor-ticogram (ECoG) [61], [62], or the implementation of electrodes directly to a neuron [59], [60]. Non-invasive interfaces have a wider range of applications, in spite of being slightly harder to analyse and process EEG data due to the abundance of undesired artefacts and low Signal-to-Noise (SNR) ratio.
2.3.3 Performance of BCI systems
more challenging, because this information reveals itself in the same regions of the brain [102]. BCIs that deal with 2 classes, for example rest condition versus imagined hand movement, classification accuracies should be higher than 70% [107]. State-of-art BCIs, however, can achieve accuracies above 90% for most test subjects with minimal training [63]. BCIs with more than two classes have accuracy ranges between 60% and 80%, with lower chance levels [102]. However, as it was mentioned before, some individuals have a greater ability to generate signals reflective of their motor imagery, therefore they can accomplish better classification accuracies. Consequently individuals that can naturally modulate their mental states can control devices more efficiently.
It’s imperative for any worthy to mention BCI to have a decent acquisition system, be it EEG or any other acquisition techniques mentioned above, and also a meaningful feedback or control interface. However, it’s the signal processing component of a BCI that dictates the overall performance of the BCI, including feature extraction and classification. The following section will discuss the importance of these two stages and give a brief overview of the techniques that are used to develop the current project.
2.4
Signal Processing and Feature Extraction
Signal processing and feature extraction are essential subjects in the field of BCI. As described earlier, the EEG is prone to many unwanted artefacts, and collecting valid information from it can be challenging. To acquire valid data, the equipment has to be proven efficient and the user must carefully follow the paradigms proposed. Besides, signal processing on the computer can take time, therefore analysis on real-time acquisition may be delayed and non-functional. Because of this, feature selection is a way to minimize the time and operations done while processing, by selecting only relevant portions of data. This greatly reduces processing time and makes it possible for real-time BCI applications to work.
Typically, the acquired EEG signals are pre-processed by a bandpass filter in the first stage, to obtain signals in the band of interest. Afterwards there is the feature selection phase in order to represent the vital components of the signal, or thefeatures. The extracted features are then used to train a classifier in an offline phase. During the online phase, the trained classifier can identify the user’s intent and output a command signal [108]. The objective of feature selection is to improve the prediction performance of the predictors, provide faster and more cost-effective predictors, and provide a better understanding of the underlying process that generated the data [109].
training of the user using the BCI. Classification accuracies vary significantly from user to user due to different individual cortical patterns for the same cognitive tasks [110].
There are a myriad of techniques used for processing, depending on the type of BCI and applications to be used on [111]. An extensive review of all of these techniques is beyond the scope of this project, however, all feature selection techniques and algorithms in EEG-based BCI aim at representing the EEG data in feature space, which can be later used to train the classifier [96]. The next subsections will review a few of the techniques and algorithms related to signal processing and feature extraction, which are used for the development of the proposed BCI system, the EmotivBCI.
2.4.1 Artefact Reduction
EEG signals are often contaminated with noise and artefacts. It is necessary to develop methods for detection and objective quantification of signal characteristics to minimize the influence of noise and artefacts to facilitate interpretation of relevant information [72]. One way to reduce artefacts is linear filtering. Linear, time-invariant filtering can be used for reduction of Electromyography (EMG) artefacts, and the 40/60Hzpower-line interference [72]. Filtering also allows to express a EEG signals in the frequency ranges where the relevant information is found. For example, ERD/ERS is observed in theMu
(7-13 Hz) andBeta(15-30 Hz) frequency ranges.
Although filtering can help in minimizing noise and artefacts, it is not bulletproof. Some artefacts due to muscular activity still overlap in EEG spectra.
2.4.1.1 Chebyshev Type 1 Filter
Chebyshev filters are used to separated one band of frequencies from another. The primary attribute of Chebyshev filters is their speed, since they are carried out by recursion. Unlike Butterworth filters, Chebyshev filters can maintain a constant amplitude value at cutoff frequency, which is beneficial to preserve the desired frequency content of the signal. The design of Chebyshev filters is based on a mathematical technique, thez-transform. The Chebyshev Type 1 Filter has the following transfer function:
|Hn(jω)|= 1
r
1+ε2T2
n
ω ω0
. (2.1)
Theεis the ripple factor,ω0is the cutoff frequency, andTnis a Chebbyshev polynomial
of thenth order, which can be defined as:
Tn(x) =
(
cos(ncos−1x) |x| ≤1
2.4.2 Power Spectral Density
Considering the oscillatory behaviour of EEG rhythms, includingMuandBeta, signal decomposition in terms of sine and cosine functions is extremely convenient. TheFourier Transformcorrelates the signal with sines and cosines of different frequencies, and produces a set of coefficients that define thepower spectrum. From this spectrum, any particular frequency band can be readily obtained. The Power Spectral Density (PSD) is a natural quantity for characterizing a stationary signal. Therefore, spectral analysis is generally applicable to EEG signals of short durations (about 10s), i.e. without major temporal changes [72].
2.4.2.1 Discrete Fourier Transform
The Discrete Fourier Transform (DFT) is the equivalent of the continuous Fourier Trans-form for signals known only atNinstants. The discrete-time Fourier transform (DTFT) of a signalxnis:
X(k) = N−1
∑
n=0
xn·e−2
πikn/N
, k∈Z(integers). (2.3)
The simplest power spectral density estimate is the modulus squared of the DFT, known asPeriodogram:
S(k) = 1
N|X(k)|
2=
N−1
∑
n=0
xn·e−2πikn/N
2
, k∈ Z(integers). (2.4)
2.4.2.2 Welch Estimation Method
The periodogram not always produces a consistent estimate of the power spectrum. This is mainly due to the fact that the variance of the periodogram does not decrease with the number of samples. Because of this, modifications have been applied to the periodogram, which consists ofwindowingandaveraging. These techniques aim at reducing the variance of the periodogram [72].
Windowing is an operation in which a rectangular windoww(n)is applied to extract the segment of a signal that extends over a longer interval. There are different designs of windows. The most common areHanning,Hamming, andBlackman. Windowing provides a trade-off between leakage and spectral resolution of the power spectrum estimate.
Variance reduction consists first of separating the signalx(n)intoKnon-overlapping segments of lengthL:
xi(n) =x(n+iL),n=0, ...,L−1,i=0, ...,K−1. (2.5)
Then, the resulting periodograms resulting from each of the segmentsxi(n)is averaged.
TheWelch’s methodis a nonparametric spectrum estimation technique that combines both of the above mentioned techniques: Windowing and averaging:
S(k) = 1
KLU
K−1
∑
i=0
L−1
∑
n=0
xi(n)w(n)·e−2
πikn/KL 2 . (2.6)
Uis a normalization factor related to the characteristics of the windoww(n),
U= 1
L
L−1
∑
n=0
w2(n). (2.7)
2.5
Classification Algorithms
The classification stage is critical to guarantee the efficiency of a BCI system. The aim of the classification step is to recognize the user’s intentions with respect to a feature vector that characterizes the brain activity [96]. Classification algorithms use the features extracted as independent variables that define the boundaries between the different classes in feature space [96].
The feature vector is extracted from training trials, which are then used to train a classifier.
2.5.1 Naïve Bayes
The Naïve Bayes (NB) classifier is a probablistic algorithm based on applying the Bayes’ theorem with naïve independence assumptions. The Naïve Bayes classifier can proba-bilistically predict the class of an unknown trial using the available training trial set to calculate the most probable output. The most probable classCNBof an unknown trial with
the conjunctionA= a1,a2, ...,am is calculated by:
CNB=arg max c∈C
p(c/A). (2.8)
Wheremis the number of discrete-valued features andCis the class.
2.5.2 Gaussian Support Vector Machine
The Support Vector Machine (SVM) classifier performs classification tasks by constructing the best hyperplane in a multidimensional space by finding the maximum possible margin, defined as:
f(x) =w⊤x+b. (2.9)
vector for a given set of dataxby calculating the similarity between thexand another set of datay. One particular kernel function is theGaussiankernel, defined as:
K(x,y) =exp(−kx−yk
2
2·σ2 ). (2.10)
This function takes values between 0 and 1. Ifx = ythenk =1. The parameterσis the
standard deviation, and it controls the width of the kernel function.
2.5.3 Decision Tree
The Decision Tree (DT) algorithm constructs a decision tree with branches and nodes based on a feature vector set. The decision tree begins with a root noder derived from whichever variable in the feature space minimizes a measure of the impurity of the two sibling nodes. The measure of the impurity at noder, denoted byim(r), is defined as follows:
im(r) =−
m
∑
i=1
p(wi/r)logp(wi/r)). (2.11)
wherep(wi/r)is the proportion of patternsxi allocated to classwi at noder. Each
none-terminal node is then divided into two further nodes,r1andr2 such thatp1, p2 are the
proportions of entities passed to new nodesr1, r2 respectively. The most appropriate
division is that which maximizes the difference:
∆im(d,r) =im(r)−p1im(r1)−p2im(r2). (2.12)
The decision tree grows until a phase is reached in which there is no significant decrease in the measure of impurity when a further additional divisiondis implemented. When this phase is reached, the noderis not sub-divided further, and automatically becomes a terminal node. The classwi, associated with the terminal noderis that which maximizes
the conditional probabilityp(wi/r). Eventually, in testing phase, test samples are classified
C
H
A
P
T
3
D
EVELOPMENT OF
E
MOTIV
BCI
The present chapter will cover the development of the project that is the topic of this Master dissertation:EmotivBCI. A full guide of usage will be provided in AppendixA. All the methods and algorithms that are not defined in this section, have been described in the section above.
3.1
Overview
The EmotivBCI (Figure3.1) is a proof-of-concept BCI console platform developed in C# programming language. It acquires EEG signals from 8 electrode channels in the central and frontal cortices of the brain through the commercially available EEG headset:Emotiv Epoc.
Figure 3.1: Visual representation of the EmotivBCI and the main features it comprises.
hands). It also implements real-time testing with the built-in classifiers. The EmotivBCI comes with a number of features, which will be described in the following sections.
3.1.1 Materials
The main core of the EmotivBCI is the software that was developed on the computer. For that, several other programs were used, which will be mentioned below.
3.1.1.1 Emotiv Epoc
TheEmotiv Epocis a wireless headset equipped with 14 sensors, and two reference channels (Figure3.2). Prior to its usage, the electrode pads have to be moisturized with a saline solution. The battery duration is about 12 hours. The raw data from the headset can be accessed from the supplied SDK1[112].
(a) Emotiv Epoc wireless headset. (b) Emotiv Epoc standard electrode placement.
Figure 3.2: The Emotiv Epoc: hardware and electrode positions. Adapted from [112].
The Emotiv Epoc internally samples at a frequency of 2048 Hz, and then it is down-sampled to 128 Hz. Moreover, the data is pre-processed in the hardware, with a low-pass filter with cutoff frequency at 85 Hz, a high-pass filter with cutoff at 0.16 Hz and a notch filter at 50 Hz and 60 Hz. The signal is then available through the API2[113].
3.1.1.2 Visual Studio Community 2013
Visual Studio Community is a freeIntegrated Development Environment(IDE) to create applications in various operating systems [114]. It allows to write and test code in a pleni-tude of languages. The EmotivBCI was developed in C#: An object oriented programming language. The class diagram of the EmotivBCI is illustrated in Figure3.3.
Figure 3.3: Class diagram of the EmotivBCI.
3.1.1.3 Matlab 2015
Matlab is a high-level programming language and interface developed by MathWorks3. Matlab is specially useful to develop signal processing algorithms, since it has imple-mented various functions to meet the users’ needs. It is also extremely convenient to plot data and perform statistical analysis.
Throughout the development of the EmotivBCI, Matlab was an essential tool to de-velop some of the functions used for signal processing. Functions dede-veloped in Matlab were converted to a C# component in the form ofdll(Dynamic Link Library), and then implemented in the main program developed in C#.
Table3.1summarizes the functions developed in Matlab.
Table 3.1: Functions developed in Matlab and used in the EmotivBCI for analysis and processing.
Function Description
CalculatePowerValue Calculates the logarithmic band power value for a
band length of 1 Hz centered at the frequency given, for a single frame.
ExtractFeatures Extracts the two best combinations of
channel/fre-quency that exhibit the greatest action difference be-tween the action and rest states.
GenerateFeatMap Plots the power differences for each channel with
re-spect to the frequency.
ChannelPSD Plots the Periodogram and Welch Power Estimation
for a given channel.
GenerateClassifierData Plots the feature attributes used to build the classifier.
3.1.1.4 Accord.NET Framework
The Accord.NET Framework is a .NET machine-learning framework which is comprised of signal processing and classification libraries written in C# [115].
The classification algorithms used in EmotivBCI were implemented from the Ac-cord.NET libraries. These algorithms yield a classification accuracy based on the respective input data: attributes and classes.
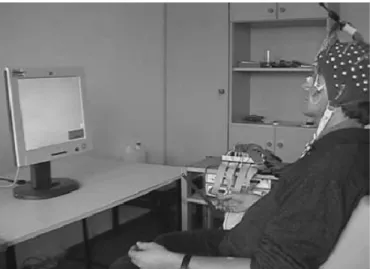
3.1.2 Getting Started
EmotivBCI was developed with the intent of serving as a personal platform, where users can register their personal information, perform tests, and keep track of their own progress. That being the case, a new user first has to register, by providing the name, age, a user-name and a password. After successfully logging in with the created user-user-name and password, the user can perform training sessions, and has at his or her disposition an array of commands to further analyse acquired data. In order to perform BCI tests, the user must be wearing the Emotiv headset. It is advised that the position of the headset is adjusted so the FC5 and FC6 channels are closer to the central cortex of the brain, in the C5 and C6 positions of the 10-20 EEG electrode system (Figure3.4).
Figure 3.4: Adjustment of electrodes from the standard Emotiv position. The red circles mark the original positions, and the green circles mark the adjusted positions. Adapted and modified from [116], [117].
3.2
Training Session
3.2.1 Training options
The EmotivBCI provides four different training options:
1. Left hand motor action: User repeatedly clenches left hand when prompted;
2. Left hand motor action: User repeatedly clenches right hand when prompted;
3. Left hand motor action: User imagines left hand movement when prompted;
4. Left hand motor action: User imagines right hand movement when prompted;
Depending on the selected option, the user will perform the respective action (Action condition) intercalated with an idle state, which from this point forward will be referred to as theRest condition.
3.2.2 Training paradigms
Complementary to the training options, the EmotivBCI also offers two different training paradigms:
1. Training Paradigm 1 - TP-1: 5-second-rest-5-second-action;
2. Training Paradigm 2 - TP-2: 2-second-rest-2-second-action;
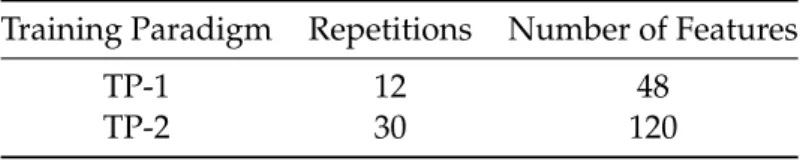
The training paradigm dictates the frequency at which the user is prompted to perform the chosen training option. The total time of the training session does not change (2 minutes). However, the number of repetitions change according to the paradigm. Table3.2
summarizes the the parameters of both training paradigms. Both paradigms come with advantages and disadvantages, but these will be discussed in the next chapter.
Table 3.2: Comparison between TP-1 and TP-2. Repetitions represent the number of times a user has to perform therest conditionandaction conditionduring the 2-minute training session. The number of features represents the total number of values available to train a classifier.
Training Paradigm Repetitions Number of Features
TP-1 12 48
TP-2 30 120
3.3
Processing Cascade
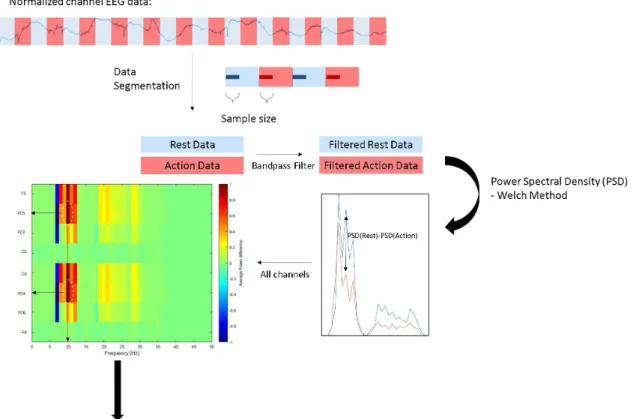
Figure 3.5: Diagram of the Feature Extraction processing cascade. Note that only one channel is represented for simplicity, however, all data from every channel is processed the same way.
3.3.1 Signal Processing
The signal processing is carried out with the support ofMatlabwrapped functions in a non-parametric fashion. Once acquired, signals from each channel are pre-processed with the C# built functions that remove the DC component and normalize the signal for each of the channels. The offset of the signal is removed by subtracting the average over the time domain of the signal. The signalx(k), in whichkis the time instant, is then normalized between[−1, 1]through:
xn(k) =1/max(|x(k)|)∗x(k). (3.1)
Next, each of the channels is separated into therestandactionconditions, but only the initial number of samples is selected, which corresponds to the initial instances of each condition (Figure3.5). The reasoning behind this is further explained later, but essentially the initial instances of each condition are more likely to carry the greatest information value for feature extraction. There are 5 established number of samples that are selected:
• 13 samples ~100 ms;
• 39 samples ~300 ms;
• 69 samples = 500 ms;
• 128 samples = 1 s;
For each number of samples, the feature extraction cascade is the same.
3.3.2 Feature Extraction
After the signal is pre-processed and segmented into two distinct signal vectors: Rest and Action, the EmotivBCI extracts the 2 best combinations of channel/frequency that exhibit the greatest ERD/ERS over the respective number of trials between these two conditions. The first step in the feature extraction cascade involves filtering the signal. The filter used is a 10th-order double bandpass Chebyshev Type 1 filter (refer to2.4.1.1) in the frequency bands that may exhibit ERD/ERS: 7 Hz to 13 Hz (Mu) and 15 Hz to 30 Hz (Beta).
Once filtered, the Power spectrum density (PSD) is estimated using the Welch method (Chapter2.4.2.2) for each of the conditions in every channel:PSD(rest)andPSD(action).
The difference PSD(rest)−PSD(action) is calculated to identify the channel and frequency pairs that show the greatest difference, hence the greatest ERD/ERS.
The two best combinations of channel/frequency are used to build the feature matrix to train the classifier. The best channels may be the same. If so they exhibit ERD/ERS in two distinct frequencies.
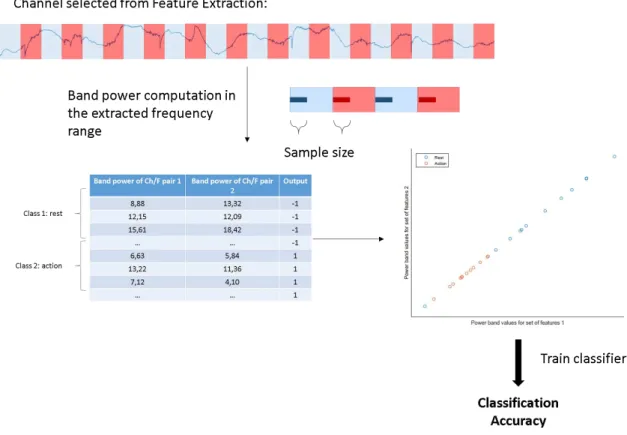
3.3.3 Feature Matrix Construction
The feature matrix is calculated for the best channels, by computing the logarithmic band power centered in the respective best frequency. The band power is computed as follows:
BP|ff+−0.50.5 =10 log
∑
X(k)|f+0.5
f−0.5
2
. (3.2)
In this equation,X(k)is the FFT coefficients between the delimited frequencies.
The data from each of the 2 best channels is again separated into rest and action conditions (this step is now computed in the C# framework), and buffered into frames of the same size as the respective number of samples.
For each frame, the logarithmic band power centered in the best frequency, with the range of 1 Hz, is computed.
The resulting matrix consists of a set of band power values for the rest state, which corresponds to output−1, and a set of band power values for the action state, which corresponds to output+1 (Figure3.6).
Depending on the previously selected training paradigm, the number of values for the classes rest and action are different:
The resulting feature matrix will therefore consist of 2 sets of attributes: band power values for combination channel/frequency number 1, and band power values for combi-nation of channel/frequency number 2.
Figure 3.6: Diagram of the Feature Matrix construction. The features have been extracted prior to this stage. Both channel/frequency pairs go through this processing.
3.3.4 Classification
The feature matrix is used to train 3 different classifiers implemented using the Accord Framework:
• Naïve Bayes
• Gaussian Support Vector Machine
• Decision Tree
The resulting classification accuracy represents the number of correctly classified samples over the total number of samples multiplied by 100%. The random classification accuracy is 50%.
training session, and posteriorly be used for real-time BCI processing. The relevant features extracted (2 best channel/frequency pairs)in respect to the best classification are registered for that training session as well.
3.4
Other Features
The ability to perform training sessions and subsequently classify data is the main feature of theEmotivBCI. It does, however, offer a few more features to round out and come close to a what a real BCI platform should be like (Figure3.7). The next subsections will give a brief overview of such features.
Motor Imagery - Right Hand
Frequency (Hz)
0 5 10 15 20 25 30 35 40 45 50 F3 FC5 FC3 C5 C6 FC4 FC6 F4
Average Power difference
-1 -0.8 -0.6 -0.4 -0.2 0 0.2 0.4 0.6 0.8 1
(a) Feature Map.
Frequency (Hz)
0 5 10 15 20 25 30 35 40 45 50
Amplitude 0 0.1 0.2 0.3 0.4 0.5 0.6 0.7 0.8 0.9 1
Periodogram for channel FC5 Motor Imagery - Right Hand
rest action
(b) Channel PSD: Periodogram.
Frequency (Hz)
0 5 10 15 20 25 30 35 40 45 50
Amplitude 0 0.1 0.2 0.3 0.4 0.5 0.6 0.7 0.8 0.9 1
Welch Power Spectrum for channel FC5 Motor Imagery - Right Hand
rest action
(c) Channel PSD: Welch Method.
Power band values for set of features 1
Power band values for set of features 2
Motor Imagery - Right Hand
Rest Action
(d) Classification Data.
Figure 3.7: Features of the EmotivBCI.
3.4.1 Online BCI - Real-time Testing
so that it can classify incoming data from live acquisition. With classification accuracies above 90% it has yielded acceptable responses. With classification accuracies lower than 90% there seems to be no sufficiently adequate response. The way it is implemented, it computes a band power value (based on the respective features acquired from the training session) every 1 second, or 128 samples. The computed value is then classified as
RestorActionbased on the training set. Because the features are extracted based on the initial samples, usually lower than 128, the data from live acquisition may not be fully compatible. This is an issue which should be addressed in further development of the
EmotivBCI.
3.4.2 Generate Feature Map
Feature maps are density charts that show the activity of the channels with respect to frequency (Figure3.7(a)). It is based on these charts that the features for a given training session are extracted i.e. 2 channel/frequency pairs. The user has the ability to visualize these feature maps and analyse the areas of the brain that showed grater variation between therestandactionconditions. The feature maps are generated according to the processing algorithms described above.
3.4.3 Generate Channel PSD
Although the feature map can show the power variation in all the channels, it is not very detailed. For this reason, the user can visualize the power spectrum of both therestand
actioncondition for any given channel. This command generates 2 power spectrum density plots: Periodogram (Figure3.7(b)) and Welch Method Estimation (Figure3.7(c)). Through these plots it is often possible to observe a clear desynchronization of theactioncondition.
3.4.4 Generate Classification Data
This command plots the attribute values used to train the classifiers in a plane i.e the values from the feature matrix. The y axis consists of the power values of the first chan-nel/frequency pair, and the x axis consists of the second. The colors refer to the condition: blue is rest, and red is action. Through this plot it is possible to predict the accuracy of the classification (Figure3.7(d)).
3.4.5 Miscellaneous
![Figure 2.2: Block Diagram of a BCI system. Adapted and modified from [72].](https://thumb-eu.123doks.com/thumbv2/123dok_br/16537669.736601/38.892.190.664.408.728/figure-block-diagram-bci-adapted-modified.webp)

![Figure 3.2: The Emotiv Epoc: hardware and electrode positions. Adapted from [112].](https://thumb-eu.123doks.com/thumbv2/123dok_br/16537669.736601/46.892.206.653.522.722/figure-emotiv-epoc-hardware-electrode-positions-adapted.webp)