Open Access
R E S E A R C H A R T I C L E
Bio
Med
Central
© 2010 Hippolyte et al; licensee BioMed Central Ltd. This is an Open Access article distributed under the terms of the Creative CommonsAttribution License (http://creativecommons.org/licenses/by/2.0), which permits unrestricted use, distribution, and reproduction in any medium, provided the original work is properly cited.Research article
A saturated SSR/DArT linkage map of Musa
acuminata addressing genome rearrangements
among bananas
Isabelle Hippolyte*
1, Frederic Bakry
1, Marc Seguin
2, Laetitia Gardes
2,3, Ronan Rivallan
2, Ange-Marie Risterucci
2,
Christophe Jenny
4, Xavier Perrier
1, Françoise Carreel
5, Xavier Argout
2, Pietro Piffanelli
2,6, Imtiaz A Khan
7,
Robert NG Miller
8, Georgios J Pappas
9, Didier Mbéguié-A-Mbéguié
10, Takashi Matsumoto
11, Veronique De
Bernardinis
12, Eric Huttner
13, Andrzej Kilian
13, Franc-Christophe Baurens
2, Angélique D'Hont
2, François Cote
14,
Brigitte Courtois
2and Jean-Christophe Glaszmann
2Abstract
Background: The genus Musa is a large species complex which includes cultivars at diploid and triploid levels. These
sterile and vegetatively propagated cultivars are based on the A genome from Musa acuminata, exclusively for sweet bananas such as Cavendish, or associated with the B genome (Musa balbisiana) in cooking bananas such as Plantain varieties. In M. acuminata cultivars, structural heterozygosity is thought to be one of the main causes of sterility, which is essential for obtaining seedless fruits but hampers breeding. Only partial genetic maps are presently available due to chromosomal rearrangements within the parents of the mapping populations. This causes large segregation
distortions inducing pseudo-linkages and difficulties in ordering markers in the linkage groups. The present study aims at producing a saturated linkage map of M. acuminata, taking into account hypotheses on the structural
heterozygosity of the parents.
Results: An F1 progeny of 180 individuals was obtained from a cross between two genetically distant accessions of M.
acuminata, 'Borneo' and 'Pisang Lilin' (P. Lilin). Based on the gametic recombination of each parent, two parental maps
composed of SSR and DArT markers were established. A significant proportion of the markers (21.7%) deviated (p < 0.05) from the expected Mendelian ratios. These skewed markers were distributed in different linkage groups for each parent. To solve some complex ordering of the markers on linkage groups, we associated tools such as tree-like graphic representations, recombination frequency statistics and cytogenetical studies to identify structural rearrangements and build parsimonious linkage group order. An illustration of such an approach is given for the P. Lilin parent.
Conclusions: We propose a synthetic map with 11 linkage groups containing 489 markers (167 SSRs and 322 DArTs)
covering 1197 cM. This first saturated map is proposed as a "reference Musa map" for further analyses. We also propose
two complete parental maps with interpretations of structural rearrangements localized on the linkage groups. The structural heterozygosity in P. Lilin is hypothesized to result from a duplication likely accompanied by an inversion on another chromosome. This paper also illustrates a methodological approach, transferable to other species, to investigate the mapping of structural rearrangements and determine their consequences on marker segregation.
Background
The banana (Musa spp.), including sweet and cooking
bananas, is the number one tropical fruit, with a global
production exceeding 100 million tons in 2006. It is also a staple food for more than 400 million people [1]. Largely due to technological requirements for transportation and agronomic performances, 45% of world consumption relies on a single genotype (cv. Cavendish), which is
sus-ceptible to the main Musa diseases [2]. It is therefore
* Correspondence: isabelle.hippolyte@cirad.fr
1 CIRAD, UR Multiplication Végétative, Av. Agropolis, 34398 Montpellier Cedex 5, France
be cultivated with less pesticide.
Musa is a Monocot with four known genomes (A, B, S and T) and a relatively small genome size of 500-600 Mb
in its haploid state. Two species, M. acuminata (2n = 2× =
22) and M. balbisiana genomes (2n = 2× = 22) participate
to most edible triploid bananas and contain an A and B genome, respectively.
Musa textilis from Australimusa section (2n = 2× = 20) and M. schizocarpa (2n = 2× = 22), carrying T and S genomes respectively, are involved in few edible culti-vars[3,4]. Cultivated triploid clones (AAA such as Caven-dish, AAB such as plantain varieties, and ABB cultivars) are difficult to cross because of sterility, polyploidy, high heterozygosity, interspecificity and low gamete fertility, thus limiting banana improvement [3]. Sterility is gener-ally associated to genome structural heterozygosity. These structural differences likely contribute to crossing
barriers within the species. Consequently, the Musa
acuminata complex has been divided into seven "translo-cation groups" [5].
The most widely distributed type is designated the "standard" or "central" group, because of its broad
distri-bution in the M. acuminata species and in other Musa
species [5]. In M. acuminata, microcarpa subsp., banksii
subsp. and most malaccensis subsp. share this structure. The other six groups (Northern Malayan, Northern 1 and Northern 2, Malayan Highland, Javanese, East African) are defined on the basis of chromosome pairing during meiosis. Within each group, wild accessions share the same chromosome structure and are structural homozy-gotes, in contrast to most cultivated accessions. In previ-ous characterizations, the inversions were not likened to "translocations", even if chromosome segment inversions was suspected [5]. The fertility of all cultivars is altered by their structural heterozygosity and sterility increases with the number of rearrangements/structural differences [5].
Despite the importance of a well established genetic map to sustain banana genetic improvement at diploid and triploid levels, this tool is presently lacking because
of difficulties with Musa in developing a mapping
popu-lation free of any structural rearrangement. The previous efforts [6,7] highlighted the likely presence of rearrange-ments but did not provide an interpretation in terms of the structure of the affected chromosomes.
The first mapping experiment with Musa produced a
non-saturated genetic map [6], which exhibited 15 link-age groups with 77 markers, among which 36% signifi-cantly deviated from Mendelian segregation (p < 0.05). In
that study, the F1 parent, selfed to generate the
segregat-ing progeny, was shown to be heterozygous for two recip-rocal translocations. The second map was drawn from 89
individuals coming from a selfed M. acuminata diploid
"M53". It displayed 11 linkage groups and also distorted
[7]; 59% of the 120 markers were skewed (p < 0.05) and
the F1 hybrid used to generate the F2 population carried at
least two translocations, if not three. Pseudo-linkages could have led to the establishment of oversized linkage groups comprising distorted markers supposed to be involved in the structural rearrangements [9].
A fourth map was to generate a refined M. acuminata
parental map that could serve as a dense reference Musa
genetic map containing the 11 expected linkage groups. Mapping was performed using a F1 population of diploid
Musa acuminata genotypes. The female parent was the
wild M. acuminata 'Borneo', subsp. microcarpa,
sup-posed to be a structural homozygous. The male parent
was the cultivar M. acuminata 'Pisang Lilin', subsp.
mal-accensis, exhibiting a Northern Malayan/Standard heterozygous chromosomic structure [5,10]. Therefore, the structural heterozygosity of the progeny, named Borli population, should be limited to a unique rearrangement. This work was enabled by combining methodological approaches (DArTs and SSRs) with analytical approaches (Neighbor joining trees) to determine the structure or large chromosomal rearrangements and their location in the genetic maps of the parents of the population.
Results
Meiotic configuration
Like many banana cultivars, the male parent M.
acumi-nata 'P. Lilin' contained structural chromosome
rear-rangements, while the wild female parent M. acuminata
Borneo, is supposed to be free of any.
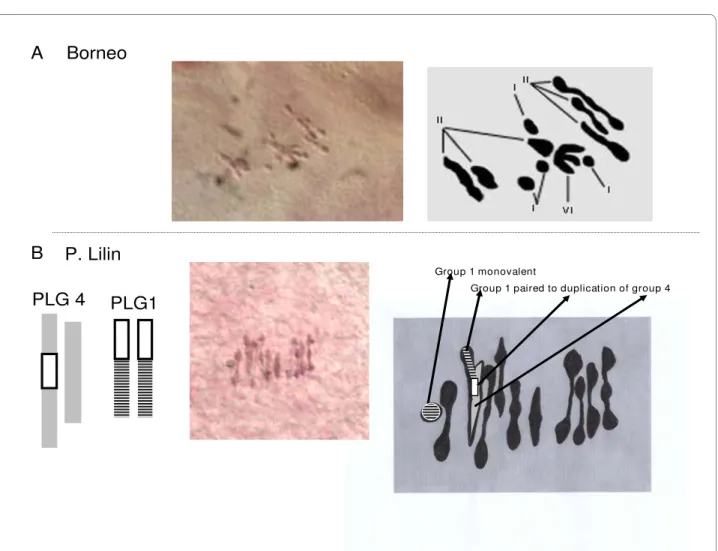
Meiotic preparations of Borneo and P. Lilin were ana-lyzed. They both displayed some Pollen Mother Cells (PMC) with normal chromosome pairing forming 11 bivalents (Table 1 configuration A) and some PMCs showing some degree of multivalent pairing. Borneo showed one cell displaying one trivalent and one tetrava-lent (configuration H), one cell displaying one pentava-lent (Table 1 configuration G) and one cell displaying a hexavalent (Table 1 configuration F and Figure 1-A). On this basis, we infer that Borneo has at least two structural polymorphisms linking three pairs of chromosomes. This was not expected because Borneo, which is a seeded wild accession with good male and female fertility, was described as structurally homozygous [5].
tetravalent" was observed in these preparations. There-fore, it is not possible to establish the presence of a true translocation across chromosomes. The meiosis observa-tions on P. Lilin are consistent with previous work [10,11] on this same clone that also drew the conclusion of an inversion.
Marker polymorphism
SSR markers
The SSR marker polymorphism in parents was tested for
the 395 primer pairs selected (357 from M. acuminata
and M. balbisiana genomic SSRs, and 38 from ESTs). Two hundred and fifty-six primer pairs generated PCR amplicons, among which 181 had polymorphism detected, and exhibited clear and unambiguous single-locus amplification on the parents.
Of these 395 SSR markers tested, the 29 SSR markers
defined on M. acuminata "Gobusik" have been
exten-sively used in mapping [6,12] and diversity analysis [13-15]. The other ones are newly defined. This may explain that 76% of the former were mapped, while only 43% of the latter were usable.
Borneo was less heterozygous than P. Lilin. Of the 174 mapped SSR, Borneo displayed 126 heterozygous pat-terns (72%) as opposed to 151 for P. Lilin (87%); 103 of the segregating markers segregated in both parents (59%), while 23 SSR markers segregated only in Borneo and 48 SSR markers in P. Lilin. Genotyping data are available on GCP registry http://gcpcr.grinfo.net/index.php?app=data sets&inc=files_list.
DArT markers
The two parents and 92 progenies were hybridized on DArT array. Four hundred and eighty-five markers were found to be polymorphic out of the 11520 present on the array (4%). Among the 485 markers, 59 could be attrib-uted to a linkage group but were impossible to map (inability to define phases, generation of negative dis-tances and high value of marker mean square contribu-tion ...). Among the 426 DArTs markers that were mapped, 144 (34%) were contributed by Borneo only, 228 (53%) were contributed by P. Lilin only, while 54 (13%) were contributed by both parents. In the reference map, 62 fully identical markers, probably resulting from redun-dancy, were discarded. Genotyping data are available on the GCP registry http://gcpcr.grinfo.net/index.php?app= datasets&inc=files_list.
Anchorage between parental maps
The attribution of markers to one of the two parents enabled development of two parental maps. As a first step towards a tentative synthetic map avoiding parent-spe-cific pseudolinkages, the two parental maps were com-pared at different LOD scores using 133 common markers (79 SSRs and 54 DArTs markers) serving as anchors. The congruence between parental linkage groups was best at LOD 3.5 for Borneo and LOD 5 for P. Lilin (Figure 2). Five consensus linkage groups (i.e. LG 3, LG 5, LG 7, LG 9 and LG 11) were identified on the basis of the full co-linearity of the anchor markers. For the other groups, marker alignments or groupings differed
Table 1: Meiotic configurations at metaphase-I and anaphase-I in the parents of the Borli population.
Number of PMCs scored
Metaphase-I configurations Cell configuration M. acuminata 'Borneo' M. acuminata 'P. Lilin'
A 11 II 13 4
B 10 II + 2 I 1 3
C 9 II + 1 III + 1I - 9
D 9 II + 1 IV (open) 1* 1**
E 8 II + 2 III 3
-F 8 II + 1 VI 1
-G 8 II + 1 I + 1 V 1
-H 7 II + 1 I + 1 III + 1 IV 1
-Anaphase-I configurations
I 11/11 chromosomes 2
-J 10/10 chromosomes + 1 bridge - 1
Total no. of cells scored 21 17
between the parental maps. At LOD 5, the Borneo mark-ers homologous to markmark-ers of PLG6 split into two groups. They still split at LOD 3.5, but some of them aggregated with markers homologous to those of PLG 8. The groups BLG1, BLG2 and BLG 4 in the Borneo map built at LOD 3.5 lump into a major group in the P. Lilin map (PLG1+2+4) even up to LOD 8. At LOD 9, the P. Lilin map exhibited 14 linkage groups and the grouping was no longer consistent with the Borneo representation. The map based on Borneo female parent had 11 linkage groups that were delineated at LOD 3.5 with 261 markers (125 SSRs and 136 DArTs) (Additional file 1). The map spanned about 920 cM, with an average marker spacing of 3.8 cM. The largest linkage group comprised 59 mark-ers whereas the smallest encompassed 9 markmark-ers. Of the 278 segregating markers initially tested, 8 DArTs remained ungrouped and mMaCir 120 was removed.
Regarding the P. Lilin parent, the map obtained at LOD 5 comprised 359 markers of the 379 initially tested (147 SSRs and 212 DArTs), distributed in 9 main linkage groups (PLG) (Additional file 2). The map spanned about 1081 cM with an average marker spacing of about 2.9 cM. The markers were not uniformly distributed, one major group (PLG 1+2+4) comprising 113 markers. Sixteen markers remained ungrouped, including 4 SSRs and 12 DArTs. Four more DArT markers (292027, 292284,292234 and 295644) were removed because they disrupted the order of the linkage groups (negative dis-tances; suspect double recombinants).
Segregation distortions
Twelve percent of the markers deviated from the
expected Mendelian ratio (χ2 test, significance p < 0.005)
on the Borneo female parent (31/269), whereas this per-centage reached 24% with the P. Lilin male parent (89/ 375). So, Borneo exhibited half the rate of highly
dis-Figure 1 Views of chromosome pairing during meiosis (metaphase I) and their diagrammatic illustration. A - Borneo: the plate represents 4
monovalents (I), 6 bivalents (II) and one hexavalent (VI). The hexavalent is the result of association of three bivalents likely by their distal segments. B - P. Lilin: The plate shows 1 monovalent, 9 bivalents and 1 trivalent displaying a Y shape. This pattern suggests a connection point located in the prox-imal position.
Borneo
Group 1 monovalent
Group 1 paired to duplication of group 4
A
B
PLG1
PLG 4
torted markers of P. Lilin. The distortions were of the same order of magnitude for SSR and DArT markers.
Skewed segregations affected different linkage group segments of the parental maps. For example, markers seg-regated without any distortion on BLG 1, BLG 2 and BLG 4, whereas half of the markers were highly distorted on PLG 1+2+4. Similarly, markers on the homologous Bor-neo group followed Mendelian ratio (1:1) while one seg-ment on PLG 3 showed strongly skewed marker segregations (Cir20 to ECIR633, Figure 2). Conversely, Borneo was affected by highly skewed markers on the segmented BLG 6 while the corresponding loci on P. Lilin exhibited weaker distortions (Figure 2). Among the most highly significant distorted segments (i.e. p < 0.0005), allelic ratios of the markers varied from 1:2 to 1:5 depend-ing on the linkage group and sometimes on the location within a linkage group.
Linkage group tree representations
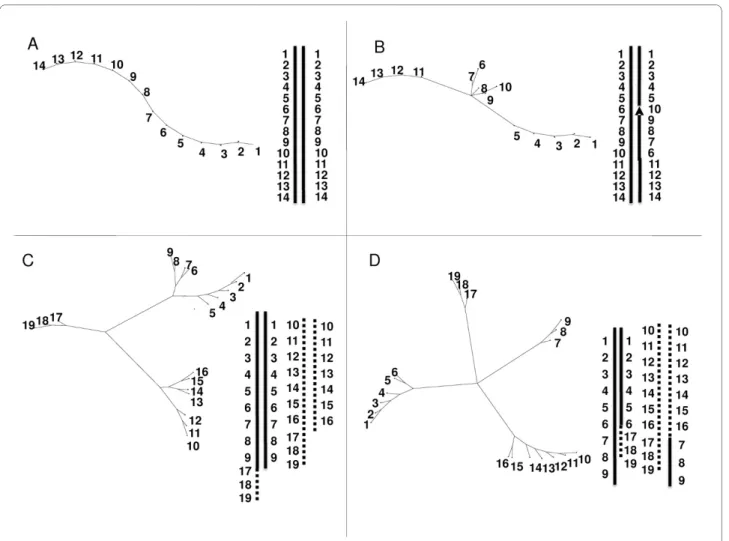
Adapted tree analyses provide an alternative representa-tion of linkage groups. Trees have been drawn from simu-lated data of different features of chromosomal rearrangements (Figure 3 and methods). It was applied to
all P. Lilin parental linkage groups defined by JoinMap® 4
at LOD 5. Figure 4 summarizes the different patterns obtained from the observed data. Most of the P. Lilin linkage groups displayed figures of homologous chromo-somes (Figure 4-A) with alignment of markers along the NJ tree similar to that of Figure 3-A, even for PLG 3 (Fig-ure 4-B) which displayed skewed segregations. Two atypi-cal NJ trees were observed for PLG 10 (Figure 4-C) and PLG 1 + 2 + 4 (Figure 4-D).
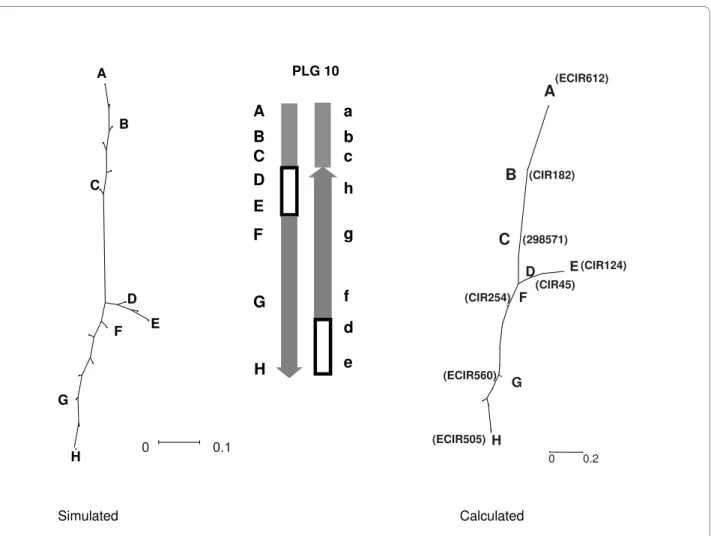
Concerning PLG 10, we propose that a nested inversion pattern differentiates the two homologous chromosomes (Figure 5). This inversion should fit the observed
cytoge-Figure 2 Map of parents of the F1 Borli population. Linkage group representation displays only anchor markers. Borneo linkage groups (BLG) were
defined at LOD3.5 while P. lilin linkage groups (PLG) were defined at LOD 5. For Borneo molecular marker names are on the right side of each linkage group and genetic distances are on the left (cM Kosambi), whereas the marker names are on the left side and genetic distances on the right side of the linkages groups for P. lilin.
Loci labeled with asterisks showed distorted segregation (1* P < 0.05, 2* P < 0.01, 3* P < 0.005, 4* P < 0.001, 5* P < 0.0005, 6* P < 0.0001, 7* P < 0.00005). Brackets] indicate segments with highly distorted markers (P < 0.0001). In SSR names, mMaCIR has been abbreviated to CIR, mMECIR to ECIR.
BLG 8 +6
0.0 11.1 47.6 51.4 52.6 92.7 93.3 101.0 101.7 106.9 109.0 112.5 113.7 119.9 121.2 123.1 133.9 164.2 164.4 164.7 165.7 130.2 Ma3 CIR111 CIR18 ECIR525 ECIR502 BLG 9 0.0 4.4 8.0 8.9 25.5 44.3 CIR115 ECIR509-1* CIR272 ECIR0500 ECIR538 CIR157 CIR297 54.4 BLG 11 CIR180 5.8 CIR167 7.5 CIR163 12.2 ECIR546 22.0 ECIR519 39.3 CIR172 51.3 CIR03 65.8 CIR07 66.4 CIR08 67.1 BLG 1 BLG 2 BLG 4 10.5 19.2 25.7 32.2 43.3 59.8 CIR189 Ma1 -17 CIR174 CIR285 CIR28 CIR29 CIR01 ECIR584 65.8 JARRET1_32 0.0 Ma1 - 32 2.9
CIR156 23.8 CIR109 42.1 CIR154 50.6 ECIR516 61.2 CIR252 61.3 CIR280 108.5 ECIR599 20.4 PLG 1+2+4
Ma1 - 32 7.1
JARRET1_32 8.5
CIR189 - 2* 14.4 CIR280 23.3 Ma1 -17* 30.7 CIR156 35.0 CIR174 -2* 39.6
CIR285 - 3* 49.8 CIR109 54.8 CIR28* 56.1 ECIR584 64.8 CIR29 67.3 CIR01 67.6 CIR154 -1* 81.6 ECIR516-7* 92.1 CIR252 -6* 92.2 299512* 94.0 ECIR519-7* 95.7 CIR180 -5* 97.5
ECIR546- 7* 97.8 CIR167 -7* 97.9 CIR163 -7* 98.1 CIR172 -7* 107.7 CIR03 -1* 120.7 CIR07 -6* 122.1 CIR08 -1* 145.8 ECIR599-7* 97.0 CIR195 5.4 CIR228 15.9 CIR139 16.5 CIR277 24.0 ECIR602 53.0 CIR274 61.9 CIR17 69.7 BLG 5 107 BLG 3 CIR20 3.4 CIR301 9.4 ECIR504 24.1 ECIR633 40.1 CIR102 43.0 CIR261 44.3 CIR105 44.4
- 90 -1* 46.0
CIR21 -1* 46.6
CIR13 -1* 46.7 -2* 65.9
PLG 3
CIR20 - 7* 0.0
CIR301 -7* 3.0
ECIR504- 7* 10.3
ECIR633- 6* 33.8 CIR102 -1* 39.8 CIR261 -1* 52.1 CIR105 -1* 57.3
Ma3 - 90 -1* 61.1
CIR21 64.9
CIR13 - 1* 65.1
CIR111 -2* 86.9
PLG 5
CIR195 - 2* 7.6 CIR228 22.9 CIR139 23.5 CIR277 33.8 ECIR602 50.7 CIR274 90.1 CIR17 102.9 CIR170 CIR192 CIR150 CIR27 CIR44 ECIR620 CIR40 ECIR570 CIR168 ECIR518 CIR229 CIR119 - 1* CIR113 - 1*
CIR294 ECIR547 ECIR631-1* CIR25* CIR151* CIR42 - 6* CIR241* ECIR634-6* ECIR533-7* CIR24 - 7* CIR188 - 7* CIR305 - 7* ECIR578-7* CIR138 - 7*
27.5 53.0 100.3 ECIR502 114.0 BLG 6 - 7* -7* -7* - 7* 0.0 8.6 13.7 14.5 PLG 9 CIR18 -7* 0.0 ECIR525 35.3 PLG 6 CIR25 -2* 14.5 CIR151 -2* 17.4 CIR42 -2* 28.2 CIR241 30.3
ECIR533- 3* 38.8 CIR24 -3* 41.0 CIR188 -2* 62.0 CIR305 -1* 64.0
ECIR578- 1* 65.9 CIR138 68.9 CIR170 124.1 CIR192 145.0 CIR150 153.5 CIR27 155.0
ECIR634- 2* 33.1 CIR40 -2* 0.0 ECIR570 7.9 CIR168 -2* 12.5 CIR229 50.0 ECIR518 50.3 CIR294 -2* 64.6 CIR119 -3* 65.0 CIR113 -3* 65.5 ECIR547-1* 75.3 ECIR631 79.2 CIR44 -7* 0.0 ECIR620-7* 11.2 PLG 8 BLG 10 ECIR560-7* CIR124 -5* CIR273 -5* CIR45 -5* CIR182 -1* CIR282 -1* ECIR612 24.2 45.2 54.9 60.2 73.3 74.4 80.8 CIR210 6.3 CIR112 32.5 CIR122 32.9 ECIR573 45.8 ECIR555 55.6 CIR117 56.9 ECIR601 64.6 CIR02 76.7
BLG 7 PLG 7
netical inversion features. When this possibility was sub-jected to NJ tree analysis, we observed a good homology between the observed and simulated trees (Figure 5).
The representation of PLG 1+2+4 (Figure 4-D) is more complex. The homologs of the anchor markers from BLG 1 and BLG 4 are tightly linked, while the homolog mark-ers of BLG 2 are loosely linked to those of BLG 1 and BLG 4. Actually, the aggregation of PLG 2 (Figure 4-D) looked very similar to those of independent groups artificially grouped at LOD 1(Figure 4-E), probably indicating a pseudo-linkage due to skewed markers [16], and PLG 2 is independent from PLG 1 and PLG 4.
In contrast, the pattern of markers from PLG 1 and PLG 4 suggests a "translocation" of markers from PLG 1 into PLG 4 in proximal location. The rearrangement is non-reciprocal as the NJ tree (Figure 4-D) would display three arms instead of four in case of reciprocity as
observed in Prunus [17] and derived from a simulation as
shown in Figure 3-D. Furthermore it looks like the typical Y image of Figure 3-C. The best hypothesis would be the existence of a duplication, as suggested by Wilson [11], of a segment of PLG 1 into PLG 4 (Figure 6), but not a true translocation [10] as we neither observed the segregation ratio nor the genotyping profiles expected with a translo-cation. This hypothesis of segment duplication, associ-ated with lethality of the type of gamete containing the duplicated segment in heterozygous configuration (Fig-ure 6) is also consistent with the observed allelic pattern and allelic frequencies and is in agreement with meiosis configurations (Figure 1-B). The expected Mendelian seg-regation (i.e. 1:1) observed at the ends of PLG 4 and PLG 1 might result from higher recombination rates in telo-meric segments [18] associated with the progressively decreasing rearrangement effect on segregation ratios with increasing distance from the inserted segment. Fur-thermore, the genetic distance observed between
mark-Figure 3 Graphic representations of structural rearrangements on simulated data. A: one structurally homozygous linkage group with 14
ers within this duplicated segment is low, as found in other studies [19]; [20]. Taking into account this low recombination frequency in the duplicated segment and the increasing frequencies of recombination from the inserted segment to the chromosome ends, the theoreti-cal and observed NJ trees (Figure 6) are very similar.
On PLG 3, we observed highly skewed markers (P < 0.0005) especially at the end of the linkage group, while corresponding markers on the same Borneo group are not distorted (Figure 2). These distortions are located in
segments that are collinear when mapping with JoinMap®
4 and that also align along the NJ tree representation (Fig-ure 4-B). Therefore we propose as a hypothesis that this region may be subjected to gene selection, meiotic drive or epigenetic effect rather than affected by structural rearrangements.
Overall, based on NJ tree analysis, allele segregations and cytogenetical studies, we propose the presence of
two structural rearrangement events for P. Lilin. The first is assumed to be a segment duplication of PLG 1 into PLG 4 (Figure 4-D and Figure 6), instead of a transloca-tion. The second can be a translocation of a PLG 10 seg-ment into itself (Figure 5). Figure 7 presents a putative map of P. Lilin integrating these structural rearrange-ments.
For Borneo, at LOD 3.5, representations given by the NJ tree seem to indicate a translocated segment from BLG 6 to BLG 8 (Additional file 3). To reproduce the pen-tavalent or hexavalent pairing features (specific to rear-rangement events involving 3 chromosomes) observed on meiosis plates (Figure 1-A), we need to decrease the grouping LOD score down to 2.9. In this case, parts of BLG 6, BLG 7 and BLG 8 are associated. Nevertheless, even in this case, we did not find any chromosome rear-rangement model that could explain the very high distor-tions (P < 0.0005) observed on homolog markers of PLG
Figure 4 Neighbor-joining trees designed from different linkage group data of P. Lilin. A: PLG 5 showing perfect alignment of markers, B: PLG
3, C: PLG 10 showing inverted segment; D: PLG 1+2+4 showing anchor markers belonging to BLG 1 (- -), BLG 4 (--), BLG 2 (- · · -) on Borneo, E: example of artificial grouping of the independent PLG 7 (- · · -) and PLG 11 (--) at LOD 1. Markers on linkage groups are anchor markers, except underlined ones which are P. Lilin markers.
CIR261 -1*
CIR139
CIR17 CIR228
CIR247
CIR274
CIR277
ECIR506 -2*
ECIR602 CIR195 -2*
ECIR515
A
D
C
Observed segregation
1:4 1:3 1:1 1:1
1:2
Ma1 -17 -3*
291371CIR109
CIR137
CIR156
CIR189 CIR28 -3* CIR280
CIR285 2* -CIR29
CIR39 -1*
ECIR551 -2* ECIR583 -2* ECIR584
ECIR617
JARRET1_32 ECIR575 -6*
CIR152 -5*
CIR03 -1*
CIR07 -6* CIR08 -1*
CIR154 CIR163 -7*
CIR172 -7*
ECIR599 - 7*
CIR252*
292284* CIR102 -1*
CIR13 -1* CIR20 - 7*
CIR301 -7*
ECIR504 -7*
Ma3 -90 -1* ECIR633 - 6* B
CIR21
CIR02 -2* CIR112
CIR115 - 2*
CIR117* CIR122
CIR157
CIR210
ECIR0500 ECIR509
ECIR536
ECIR538
ECIR555 -2*
ECIR573 - 2* ECIR601 -2*
E
0 0.2
0 1. 0 1.
0 0.2
CIR124
CIR182
CIR273
CIR282
Ecir505 -7* Ecir508 -7*
Ecir560 -7* Ecir612
CIR45 - 2*
0 0.5
6, while BLG 7 and BLG 8 did not display any. Further-more, all homologous markers of PLG 6 only aggregate at LOD 1. The third group indicated by cytogenetical stud-ies is still not clearly found, nor is the kind of rearrange-ment that can lead to such a feature.
Synthetic map
A final synthetic map was constructed at LOD 5 (Figure 8). It was first established from the aligned parental link-age groups described above (i.e. LG 3, LG 5, LG 7, LG 9 and LG 11). For the remaining linkage groups, the group-ing and the marker alignments kept as skeleton were cho-sen from the parent assumed to be free from any structural rearrangement on the considered linkage group. The absence or presence of putative structural rearrangements was assessed with NJ tree representation and segregation analysis. Priority was given to linkage groups exhibiting a linear NJ tree and Mendelian segrega-tions. A few cases of linear NJ tree with limited distorted segregation were also retained.
From the 426 initial DArT markers, 62 fully identical markers were discarded and 8 DArT markers remained ungrouped. Five SSR markers and 34 DArTs associated with structural rearrangements in one parent were dis-carded from this reference map because they disrupted its construction (i.e. negative distances, suspect double recombinants, high mean square contribution...). There-fore, some markers present in the parental maps are absent from the reference map. The observed recombina-tion frequency between two markers, one located in the structural rearrangement and one outside, aggregates the results of two different situations: one is linkage, the other one is independency. In practice, the recombina-tion frequency is the mean of recombinarecombina-tion of linked markers (REC < 0.4) and of independent markers (≥0.4) in the reference map. Consequently, these markers dis-rupt both the calculation distances between markers and the ordering when compared to data obtained from the non-rearranged parent.
Figure 5 Putative rearrangement event on PLG 10. The figure presents the Neighbor-joining tree designed from Kosambi distance calculation, the
putative scheme of the rearrangement, and the simulated Neighbor-joining tree obtained with this kind of rearrangement. In SSR names, mMaCIR has been abbreviated to CIR, mMECIR to ECIR.
0 0.1
A
B
C
D
E F
G
H
A
C B
D
E
F
G
H
PLG 10
a
c b
h
g
f
d
e
0 0.2
(CIR124) (CIR182)
(CIR254)
(CIR45)
(ECIR505) (ECIR560)
(ECIR612)
H G
F
D E
A
C B
(298571)
Altogether, this synthetic map includes 489 markers (167 SSRs, 322 DArTs) among which 132 are anchor markers. It is divided into 11 linkage groups covering 1197 cM. The markers are distributed with a mean of 38 markers per linkage group and an average marker spacing of 2.8 cM.
Discussion
This study reports an important effort in marker develop-ment and linkage analysis. SSRs provide co-dominant, multi-allelic, locus-specific markers which simplify both the construction of each parental genetic map and the comparison between the two parental maps. DArT pro-vide dominant markers which are generally well-distrib-uted in the genome and very cost-effective [21,22]. They efficiently contribute to map saturation and they consti-tute an asset that can easily be used for other materials in the future. The main difficulty of our study was the
gen-eral occurrence of segregation distortions and the risk of pseudolinkages.
Distortions from expected Mendelian segregation have been observed in both inter-specific and intra-specific derivatives with different magnitudes. They can have multiple origins, including structural rearrangements [6,17,19,23-29].
In the genus Lens, for example, distorted markers were
observed in different linkage groups, but only one trans-location was detected by cytogenetical studies and pollen viability analysis; its location was defined on the basis of
marker locations in different crosses [23]. In Helianthus,
[26], reciprocal translocations were described by conju-gating observations of abnormal pairing in meiosis, stud-ies on pollen viability and mapping data. The latter revealed an abnormally large linkage group covering close to half of the map. Nevertheless, the causes of the observed segregation distortions often remained unclear.
Figure 6 Putative rearrangement event between PLG 4 and PLG 1 in P. Lilin. The observed segregations are given along the linkage groups. Loci
labeled with asterisks showed distorted segregation (1* P < 0.05, 2* P < 0.01, 3* P < 0.005, 4* P < 0.001, 5* P < 0.0005, 6* P < 0.0001, 7* P < 0.00005). Main gametes do not take into account the different allelic combination generated by recombination between homologous segments. Underlined loci are anchor markers. The solid grey line corresponds to PLG 4 and the dotted lines to PLG 1. In SSR names, mMaCIR has been abbreviated to CIR, and mMECIR to ECIR.
LG 4
E F G H
LG 1
e f g h a A
D C F E
d B
b
c
0 1.
F G (CIR11)
A B C D
G (CIR172)
I (CIR08)
(CIR280) (CIR256) Ma1-32
(ECIR 554) (Ecir556)
Simulated Calculated
Gametes
1:2 A:a 1:2 B:b 1:2 C:c 1:2 d:D 1:2 e:E 1:2 f:F 1:2 g:G 1:2 h:H 1:2 i:I
Neighbour joining Putative structure Observed
segregation Theoretical
segregation
1:1 A:a
1:2 D:d 1:2 G:g 1:2 F:f 1:2 C:c
0 0.1
I i
G
A
D C F E B G
e f g h
i
E F G H
I
e f g h
i
E F G H
I A
D C F E B G
a b
c
d
a b
c
d
A
D C F E B G
e f g h
i
1:2 E:e 1:2 B:b
1:2 E:e 1:2 G:g
1:2 H:h
1:1 I:i 1:2 F:f
I
H
A B C D
E F
G
E(CIR 163)
CIR280 CIR137
ECIR575-6* CIR152-5* CIR249-6* CIR252* ECIR516-5* CIR256-7* CIR11-7* ECIR609-7* ECIR599-7* ECIR546* CIR167-7* ECIR554-7* CIR180-3* CIR163-7* ECIR556-7* CIR215-7* CIR154
CIR109 CIR156 JARRET1_32 Ma1-32
CIR163-7* CIR180-3* ECIR554-7* CIR167-7* ECIR546* ECIR599-7* ECIR609-7* CIR11-7* ECIR519-7* CIR172-6* CIR03-1* CIR07* ECIR0499-7*
CIR08
In Prunus inter-specific crosses skewed markers were located on a reciprocal translocation [17]. The hypothesis was validated by studying pollen fertility in the segregat-ing progeny and by cytogenetical observations dursegregat-ing meiosis. Most examples show that an array of methods is generally needed to differentiate between the different causes of segregation distortion.
In Musa, earlier studies did not determine the causes of
segregation distortion [6,12]. Our use of NJ tree repre-sentations helped sort between the segregation distor-tions linked to structural rearrangements and those due to other phenomena such as gene selection, meiotic drive or epigenetic transmission effects. This use led to identi-fication of one likely case of local direct selection on PLG3 and a couple of likely structural rearrangements.
Earlier cytogenetic studies of meiosis in P. Lilin [10,30] described this cultivar as a structural heterozygote featur-ing one translocation and at least one inversion on the
basis of trivalents and bridges. In subsequent observa-tions, Dodds and Simmonds [30] and Shepherd [5] sug-gested that one of the exchanged segments contains a small sub-terminal inversion, but Wilson [11] stressed that no closed tetravalent was observed and suggested a duplication rather than a translocation. Our interpreta-tion features a duplicainterpreta-tion between PLG 1 and PLG 4 and an inversion within PLG 10; it is therefore fully in line with earlier inferences.
The structural status of Borneo is less clear. Early cyto-genetical studies described Borneo as a structural homozygote [5], in consistency with its full fertility; yet some rearrangements are suspected as well as the pres-ence of a unit with "one of both arms rather short" [5] Our cytogenetic observations suggested that it is heterozygous for at least two rearrangements involving three linkage groups. Some BAC-FISH experiments
should be undertaken, as was done for M. acuminata
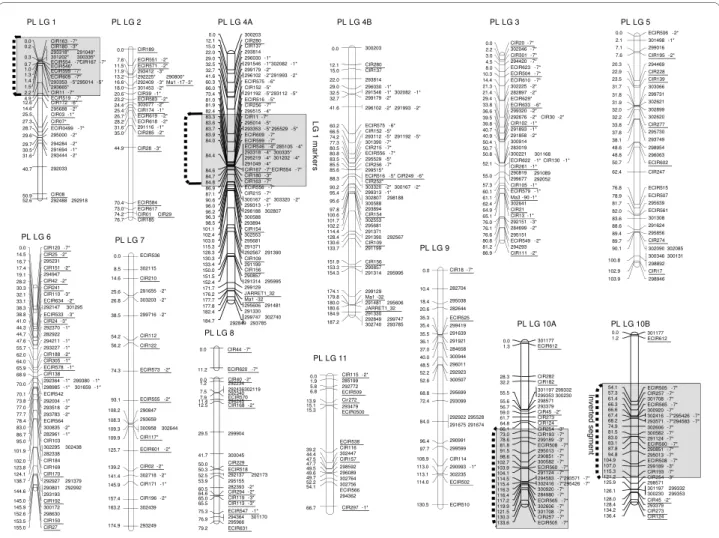
Figure 7 Putative P. Lilin map built at LOD 5. Molecular marker names are on the right side of each linkage group whereas genetic distances are
on the left (cM; Kosambi mapping function). Loci labeled with asterisks showed distorted segregation (1* P < 0.05, 2* P < 0.01, 3* P < 0.005, 4* P < 0.001, 5* P < 0.0005, 6* P < 0.0001, 7* P < 0.00005). Anchor markers are underlined. The 4A and 4B linkage groups represent both chromosomes of the structural heterozygous pair of the chromosome 4. The linkage groups 10A and 10 B represent the both chromosomes of the structural heterozygous pair of the chromosome 10. In SSR names, mMaCIR has been abbreviated to CIR, and mMECIR to ECIR.
I mpossible d'afficher l'image. Votre ordinateur manque peut-être de mémoire pour ouv rir l'image ou l'image est endommagée. Redémarrez l'ordinateur, puis ouv rez à nouv eau le fichier. Si le x rouge est toujours affiché, v ous dev rez peut-être supprimer l'image av ant de la réinsérer.
I mpossible d'afficher l'image. Votre ordinateur manque peut-être de mémoire pour ouv rir l'image ou l'image est endommagée. Redémarrez l'ordinateur, puis ouv rez à nouv eau le fichier. Si le x rouge est toujours affiché, v ous dev rez peut-être supprimer l'image av ant de la réinsérer. I mpossible d'afficher l'image. Votre ordinateur manque peut-être de mémoire pour ouv rir l'image ou l'image est endommagée. Redémarrez l'ordinateur, puis ouv rez à nouv eau le fichier. Si le x rouge est toujours affiché, v ous dev rez peut-être supprimer l'image av ant de la réinsérer.
CIR40 -2* 0.0 292234 1.2 292436302119 292340 7.5 ECIR570 7.9 294245 11.4 CIR168 -2* 12.5 299904 29.5 300045 41.7 CIR229 50.0 ECIR518 50.3 292137 292173 52.5 295155 53.9 282393 -2* 60.5 CIR294 -2* 64.6 CIR119 -3* 65.0 CIR113 -3* 65.5 ECIR547 -1* 75.3 294364 301170 295966 76.9 ECIR631 79.2 CIR44 -7* 0.0 ECIR620 -7* 11.2
PL LG 6
PL LG 8 PL LG 7
PL LG 9
PL LG 11
CIR20 -7* 0.0 302046 -7* 2.2 CIR301 -7* 3.0 294420 -7* 4.5 ECIR623 -7* 8.0 ECIR504 -7* 10.3 ECIR610 -7* 14.4 302225 -2* 21.3 282897 -2* 21.4 ECIR629* 29.4 ECIR633 -6* 33.8 299320 -2* 36.6
292676 -2* CIR30 -2* 39.5 CIR102 -1* 39.8 291893 -1* 40.7 291858 -2* 40.9 300914 50.4 283019 50.7 300221 301168 50.8
ECIR622 -1* CIR130 -1* CIR261 -1* 52.1 290819 291089 299677 292052 55.0 CIR105 -1* 57.3 ECIR579 -1* 60.1
Ma3 -90 -1* 61.1 302641 62.4 CIR21 64.9 CIR13 -1* 65.1 292151 -3* 76.0 284699 -2* 76.1 295151 76.6 ECIR549 -2* 80.8 294293 81.2 CIR111 -2* 86.9 CIR18 -7* 0.0 282704 10.4 295038 18.4 282644 20.6 ECIR525 35.3 299419 35.4 291639 35.5 291921 36.1 284658 37.0 300944 40.0 296011 48.5 292923 52.2 300507 52.6 295699 68.8 293099 72.4 292922 295528 291675 291674 84.0 290991 96.4 299599 97.7 CIR114 108.9 290993 -1* 113.0 302235 113.1 ECIR502 114.0 ECIR510 130.5 CIR120 -7* 0.0 CIR25 -2* 14.5 295231 16.7 17.4 294947 19.1 CIR42 -2* 28.2 CIR241 30.3 CIR110 -3* 32.1 ECIR634 -2* 33.1 292147 301295 38.3 ECIR533 -3* 38.8 CIR24 -3* 41.0 292370 -1* 44.3 282922 44.7 294211 -1* 47.6 293227 -1* 55.7 CIR188 -2* 62.0 CIR305 -1* 64.0 ECIR578 -1* 65.9 CIR138 68.9
292364 -1* 299380 -1* 298985 -1*301659 -1* 70.0 ECIR542 70.1 292004 -1* 73.8 293518 -2* 77.0 293783 -2* 77.7 ECIR564 78.4 300835 -2* 83.0 282961 -1* 86.7 CIR103 95.0 302295302438 282338 101.9 CIR184 102.0 CIR169 123.8 CIR170 124.1 292927291379 138.7 290801292992 293193 144.6 CIR192 145.0 300172 145.9 298630 152.6 CIR150 153.5 CIR27 155.0 CIR115 -2* 0.0 285199 1.9 292772 5.8 ECIR509 6.8 Cir272 13.9 293479 15.1 ECIR0500 15.3 ECIR538 39.2 CIR116 44.4 302447 47.5 CIR157 47.7 298592 296089 49.5 302764 49.6 302756 49.7 ECIR566 52.2 294362 54.1 CIR297 -1* 66.7 ECIR536 0.0 302115 8.5 CIR210 14.6 291655 -2* 25.6 303203 -2* 26.8 299716 -2* 38.5 CIR112 54.2 CIR122 56.2 ECIR573 -2* 74.3 ECIR555 -2* 93.1 290847 108.2 293659 108.3 300958 302644 109.3 CIR117* 109.9 ECIR601 -2* 125.7 CIR02 -2* 139.2 302718 -2* 141.4 CIR171 -1* 145.9 CIR196 -2* 157.4 302439 163.2 293249 174.9 ECIR506 -2* 0.0 301498 -1* 2.1 299016 7.1 CIR195 -2* 7.6 294469 20.3 CIR228 22.9 CIR139 23.5 303066 31.7 299731 31.8 302621 31.9 302899 32.0 302620 32.2 CIR277 33.8 295730 37.8 293749 38.1 298954 48.6 296063 48.8 ECIR602 50.7 CIR247 62.4 ECIR515 76.8 ECIR507 78.9 295639 81.7 ECIR561 82.0 301308 83.6 291624 88.6 295856 89.4 CIR274 89.7 302090 302085 90.1 300346 300131 298892 100.8 CIR17 102.9 298946 103.9
PL LG 10B PL LG 10A
LG 1 ma rke rs CIR189 0.0 ECIR551 -2* 7.6 ECIR571 -2* 11.5 293412 -3* 11.9 292225* 290800* 13.2
292409 -3* Ma1 -17 -3* 16.6 301453 -2* 18.0 CIR39 -1* 20.6 ECIR583 -2* 23.2 303077 -2* 24.4 CIR174 -1* 25.4 ECIR619 -2* 26.7 ECIR618 -2* 28.2 291116 -1* 31.6 CIR285 -2* 35.0 CIR28 -3* 44.9 ECIR584 70.4 ECIR617 73.0 CIR01 CIR29 74.2 CIR185 76.7
I mpossible d'afficher l'image. Votre ordinateur manque peut-être de mémoire pour ouv rir l'image ou l'image est endommagée. Redémarrez l'ordinateur, puis ouv rez à nouv eau le fichier. Si le x rouge est toujours affiché, v ous dev rez peut-être supprimer l'image av ant de la réinsérer.
CIR151 -2* CIR163 -7* CIR180 -3* 293318* 291049* 301202* 300335* ECIR554 -7*CIR167 -7* ECIR546* ECIR599 -7* ECIR609 -7* 293353 -5*295014 -5* 293665* CIR11 -7* ECIR519 -7* CIR172 -6* 295688 -2* CIR03 -1* CIR07* ECIR0499 -7* 295000 -2* 294284 -2* 291694 -1* 293444 -2* 292033 CIR08 292488 292918 0.0 0.2 0.3 0.7 1.0 1.3 1.4 1.5 2.2 4.9 12.6 14.6 25.5 27.3 28.7 29.6 29.7 30.5 31.6 40.7 50.9 52.6 300203 CIR280 CIR137 293814 296030 -1* 291546 -1* 302082 -1* 299179 -2* 296102 -2* 291993 -2*
ECIR575 -6* CIR152 -5* 293112 -5* 291192 -5* 301390 -7* CIR215 -7* ECIR556 -7* 295529 -5* CIR256 -7* 299515* ECIR516 -5* CIR249 -6* CIR252* 303320 -2* 300167 -2* 299313 -1* 302807 298188 300588 293894 CIR154 302553 295681 291371 291390 292567 CIR109 291199 CIR156 290857 291314 295995 299129 Ma1 -32 291481 295606 JARRET1_32 291330 292849 299747 302740 293785 0.0 12.1 15.0 22.0 29.0 32.5 32.7 41.6 60.2 66.5 74.2 77.3 80.5 80.8 83.5 85.5 85.6 88.3 90.2 95.4 95.6 97.8 100.6 101.7 102.2 114.4 128.4 130.6 133.7 151.9 153.3 154.3 174.1 179.8 180.0 180.6 184.9 187.2 0.0 1.2 54.1 57.3 61.4 66.3 66.6 67.4 68.2 74.9 81.5 83.0 83.1 87.8 94.8 104.9 107.0 115.3 121.2 125.9 126.1 128.0 128.4 134.2 136.4 301177 ECIR612 ECIR505 -7* CIR257 -7* 301708 -7* ECIR565 -7* 300920 -7* 302416 -7*295426 -7* 293571 -7*294583 -7* 302606 -7* 300582 -7* 291124 -7* ECIR560 -7* 290851 -7* 295013 -7* ECIR508 -7* 299189 -3* CIR193 -7* CIR254 -3* 298571 301197 299332 300230 299353 CIR45 -2* 293379 CIR273 CIR124 Inverted segment 301177 ECIR612 CIR282 CIR182 301197 299332 299353 300230 298571 293379 CIR45 -2* CIR273 CIR124 CIR254 -3* CIR193 -7* 299189 -3* ECIR508 -7* 295013 -7* 290851 -7* 300582 -7* ECIR560 -7* 291124 -7* 294583 -7*293571 -7* 302416 -7*295426 -7* 300920 -7* 284980 -7* ECIR565 -7* 302606 -7* 301708 -7* CIR257 -7* ECIR505 -7* 0.0 1.3 28.3 32.2 55.5 55.6 56.7 59.0 61.7 64.8 66.1 73.0 78.6 81.8 91.5 98.6 102.7 103.9 104.1 114.5 115.4 116.3 116.4 117.2 119.9 121.5 130.3 133.6 300203 0.0 CIR280 12.1 CIR137 15.0 293814 22.0 296030 -1* 29.0
291546 -1*302082 -1* 32.5
299179 -2* 32.7
296102 -2*291993 -2* 41.6
ECIR575 -6* 60.3
CIR152 -5* 66.0
291192 -5*293112 -5* 73.4 ECIR516 -5* 81.0 CIR256 -7* 81.9 299515 -4* 82.4 CIR11 -7* 83.3 295014 -5* 83.6
293353 -5* 295529 -5* 83.7
ECIR609 -7* 83.9
ECIR599 -7* 84.0
ECIR546 -4* 285105 -4* 293318 -4* 300335* 295219 -4* 301202 -4* 291049 -4* 84.4
CIR167 -7* ECIR554 -7* 84.6 CIR180 -3* 84.7 CIR163 -7* 84.8 ECIR556 -7* 86.9 CIR215 -7* 87.1
[31], among the parents of an F2 mapping population 'Calcutta 4' and 'Madang' [7] in order to physically assess the nature of the rearrangements. Based on our results, the investigations should focus first some of the linkage groups highlighted above: PLG1, PLG4, BLG 6, BLG 7 and BLG 8. This is possible with the availability of several BAC libraries [32,33].
In our effort to produce a saturated map of Musa, we
initially meant to study a progeny involving one structur-ally homozygous parent. The unexpected structural heterozygosity of Borneo induced additional complexity; yet it is likely that the rearrangement patterns involved different chromosomes and did not overlap in the two parents. Thus, we think our synthetic map can be a
valu-able reference for a M. acuminata genetic map. Whether
this map corresponds to a "standard structure" [5] repre-sentative of the ancestral state requires confirmation with other mapping studies involving other germplasm com-partments. The finding of structural heterozygosity in the "wild" Borneo challenges the idea that the wild forms
have developed several genome arrangements in distinct populations, identified as subspecies, which then cause sterility and favor domestication among hybrids. Borneo belongs to the Microcarpa subspecies and has been found recently [34] to include some Bansksii subsp. alleles, indi-cating probably an intersubspecific origin. The structural heterozygosity in this case should be sufficiently limited to not affect fertility.
It may be difficult to establish the ancestral configura-tion by comparing only A genome forms; the use of a B genome representative as an outgroup will certainly be helpful.
The case of the relation between linkage groups 1 and 4 in P. Lilin sheds light on particular aspects of structural polymorphisms in banana. Our current interpretation is the duplication of a segment featuring at least fifteen markers, including eight SSR loci, even if the breakpoint on PLG1 should be refined more precisely. Coding the markers/alleles as co-dominant (forcing a single locus) or as dominant (allowing two loci) in the segregation data
Figure 8 Reference Musa map built from M. acuminata P. Lilin and M. acuminata Borneo maps. The map has been built using JoinMap® 4
soft-ware, Kosambi distance calculation. Molecular marker names are on the right side of each linkage group whereas genetic distances are on the left (cM, Kosambi mapping function). Anchor markers are in bold and underlined, markers polymorphic only on Borneo are in italic; those polymorphic only on P. Lilin are in bold. In SSR names, mMaCIR has been abbreviated to CIR, and mMECIR to ECIR.
299809 0.0 CIR20-7* 3.5 302046-7* 5.6 294420-7* 7.1 CIR301-7* 8.0 ECIR623-7* 12.2 294224 12.7 ECIR610-7* 16.3 284666-2* 17.5 295291-2* 17.6 ECIR504-7* 19.2 302225-2*282897-2* 22.2 291757 28.8 ECIR629-4* 29.1 299320-2* 33.7 CIR30-2* 35.8 292676-2* 35.9 291893-1* 36.7 291858-2* 36.8 ECIR633-5* 38.8 CIR102-1* 40.2 298545-1*302454 301356298729 299796-1* 44.0 298692303341 301610282859-1* 44.1
299555-2*300679-2*
44.4 300914 45.7 283019300221 46.0 301168 46.1 ECIR622-1* 46.8 CIR130-1* 47.1 295835-1* 47.5 CIR261-1* 47.8 290819 50.0
295850-2*290809-2*
50.5 CIR105-1* 50.7 Ma3-90 52.8 CIR21 54.5 CIR13 54.6 ECIR579-1* 55.8 302641 58.6 295017-1* 68.6 292151-3* 68.9 284699-2* 69.2 295151 69.5 CIR111-4* 71.9 ECIR549-2* 74.7 294293 75.1 292284-4* 97.7 292027-3* 98.9 LG3 293785302740 292849299747 0.0 JARRET1_32 6.0 291481295606 7.2 Ma1-32 7.9 299129 13.0 290857 31.0 291314295995 31.8 CIR156 34.2 293128 44.8 291199 48.7 CIR109 53.6 291371 58.8 295681 70.2 302553 70.7 CIR154 71.9 293894 74.4 300588 76.6 302807298188 76.7 299313-1* 76.9 303320-2* 300167-2* 81.9 ECIR516-5* 83.3 CIR252-4* 83.4 CIR249-6* 83.7 295529-5* 88.6 CIR256-7* 89.6 CIR215-7* 91.5 ECIR556-7* 92.1 ECIR0496-7* 92.7 301390-7* 95.4 284911 97.2 293112-5* 291192-5* 98.5 302413293523 100.7 ECIR539 102.5 CIR264-2* 104.0 299191 105.4 CIR152-5* 108.3 292163 113.9 ECIR575-6* 114.7 293669296127 115.1 301169 122.6 CIR280 130.7 CIR137 133.3 293814 138.7 296030-1* 145.3 299179-2* 291546-1* 302082-1* 148.7 300203 152.1 LG4 298630 0.0 ECIR513-6* 0.9 CIR27-6* 1.7
295025-1* 291737-1*
2.9 291055-2* 3.0 CIR150-6* 3.5 CIR192-7* 9.6 293193 290801 9.7 299671-4* 9.9 295552 10.5 291379 15.1 295320 20.3 CIR170-7* 25.0 CIR169 26.1 302733-7* 27.9 292499-7* 34.3 282338 302438 47.3 302295 CIR184 47.4 CIR103 54.3 282961-1* 62.4 300835-2* 66.1 ECIR564 70.7 293783-2* 71.6 293518-2* 72.1 292004-1* 75.4 301659-1* 79.0 292364-1* 79.1 ECIR542 79.7 CIR138-7* 81.1 CIR289-7* 82.5 ECIR578-7* 83.4
298351-7* 300528-7*
83.6 CIR305-7* 85.0 CIR188-7* 86.3 302613-7* 90.1 293227-1* 94.1 ECIR562-7* 96.1 294211-1* 102.7 293645-5* 104.5 282922 105.7 292370-1* 106.1 ECIR521-7* 107.8 CIR24-7* 109.5 292147 112.0 ECIR533-3* 112.7 CIR110-3* 117.8 ECIR634-6* 119.2 CIR241-4* 121.4 CIR42-7* 122.7 CIR248-2* 123.3 295482 123.4 294947 130.8 CIR151-6* 131.5 295231 133.0 CIR25-7* 133.8 LG6 LG1 292918292488 0.0 CIR08 3.7 292033 9.5 CIR07-4* 14.2 CIR03* 16.4 291694* 19.2 293444-2* 20.3 ECIR0499-7* 20.9 294284-2* 21.9 295000-2* 22.0 295703 28.1 CIR172-6* 32.1 295688-2* 36.7 298410 37.0 ECIR519-7* 40.9 ECIR599-7* 48.4 CIR11-7* 49.2 ECIR546-4* 49.5 293665-4* 49.8 295014-5* 293353-5* 49.9 ECIR609-7* 50.7 ECIR554-7* 51.2 301919285105-4* 51.4 30166 52.0 CIR163-7* 53.0 302647301793 53.7 CIR167-7* 55.1 CIR180-3* 55.9 300831 65.9 LG2 300487 0.0 294264 3.2 291415 3.6 302676 4.8 CIR189 7.2 ECIR535 9.8 301679 10.9 ECIR551-2* 12.5 298606 13.5 ECIR571-2* 15.0 293412-3* 15.5 290800-4* 16.6 292409-3* 19.9 Ma1-17 20.2 301453-2* 21.3 CIR39-1* 23.7 ECIR583-2* 25.5 303077-2* 27.4 CIR174-1* 28.0 ECIR619-2* 29.4 ECIR618-2* 30.9 291116-1* 34.3 CIR285-2* 36.0 CIR28-3* 45.9 CIR108 46.5 CIR235 53.7 292320 61.0 303145 61.9 300186 62.3 ECIR584 64.7 292935 64.8 292810 65.9 284900 66.0 CIR29 66.4 CIR01 66.5 ECIR617 68.2 CIR185 70.5 LG5 299355 0.0 291394 1.1 ECIR544 12.6 295909 17.7 298946 30.2 298892 32.5 CIR17 34.3 284904 36.0 295671 37.7 295674 37.8 294576 41.2 302085 42.8 302090 42.9 295856 43.7 298719CIR274 44.3 291624 44.6 301308 49.1 ECIR561298171 50.2 295639 50.8 ECIR507 53.0 293338 54.8 ECIR515 55.0 CIR247 64.2 282588 67.1 ECIR602 68.1 296063 72.1 298954 72.3 293749 82.8 295730 83.1 293074 83.2 302620 87.9 302899 88.3 302621 88.5 303066299731 88.6 CIR277 89.4 294553 95.0 CIR129 96.5 CIR139 97.5 CIR228 98.1 294469 100.3 294204 105.0 CIR195 111.1 299016 112.3 302586 114.4 301498-1* 117.3 ECIR506-2* 119.2 ECIR536 0.0 302115 6.6 293987 12.9 303203-2* 14.8 291655-2* 15.5 CIR210 18.2 300961 23.7 299716-2* 28.5 302000 32.4 285318 33.7 299563 34.3 CIR112 44.9 CIR122 46.1 291803 47.0 300329 54.4 ECIR573 59.9 ECIR555-2* 72.0 294988 77.9 CIR117-2* 78.4 299273 78.8 300671 78.9 284953 79.0 302644 79.1 293659290847 80.2 291606 87.5 ECIR601 89.1 292804-2* 90.9 290922 94.4 CIR02-2* 100.7 302718-2* 103.7 CIR171-1* 108.1 CIR196-2* 119.5 302439 125.3 293249 137.0 LG7 LG8 CIR44-7* 0.0 294530 8.6 ECIR620-7* 11.2 291849 26.8 300238299259 28.2 298297 33.0 291015 33.5 292234CIR40 45.5 292336 46.1 CIR287 47.3 292754 48.5 301035 48.6 294245 49.9 CIR168-2* 50.7 292114 51.2 303087 54.9 ECIR570 56.5 292340302119 292436 56.8 299904 75.6 300045 86.3 292137 94.9 295155 97.2 ECIR518 98.4 301020 98.9 CIR229 99.3 302391-3* 102.9 295675-1* 103.7 303229 104.7
markers span on about 1 cM in P. Lilin. In contrast, they span on about 15 cM in Borneo.
If the cause for the distortions and the pseudolinkages is indeed this duplication, it implies that P. Lilin has three copies of the loci involved in the duplication. Yet no case was found where one of these loci displayed three distinct alleles, meaning that the duplication features a haplotype that is conserved along a segment which spans 15 cM in the Borneo configuration. This would mean that this duplication is recent enough for bearing no trace of SSR mutation nor of recombination with other haplotypes. P. Lilin is clearly incompletely fertile, but it was sufficiently fertile to produce the large number of progeny that we analyzed. We cannot exclude that this configuration is unique to P. Lilin, neither can we exclude it from a wider group of wild accessions that exchange genetic material. This leads to the question of the population dynamics of structural heterozygosity: if a heterozygous configuration leads to genetic map constrictions, and if it does not ham-per reproduction, a fraction of the progeny that is again heterozygous should display the same genetic constric-tion. This could induce specific linkage disequilibrium in the area of rearrangement. Therefore, it can be worth testing whether this type of evidence, namely linkage dis-equilibrium among stretches of markers, can help infer the distribution of structural rearrangements in the whole species.
As a more direct route, strong segregation distortions induced by structural rearrangements can also be moni-tored using small-sized progenies (30-50 individuals) and be subjected to the neighbor joining approach that we have used.
Conclusions
We present here the first dense genetic map of M.
acumi-nata with the expected eleven linkage groups, on the basis of a synthesis between two parental maps featuring distinct patterns of segregation distortions. This map can serve as a tentative reference for further studies. It dis-plays 167 SSR and 322 DArT loci, covering 1197 cM with an average density of one marker for 2.8 cM.
It will be central in further analysis of the genome of
Musa. Current projects plan a complete sequencing of
the A genome of a particular doubled haploid derived from Pahang, a Malaccensis genotype. In that project, density of the genetic map will be further increased.
This synthetic map is also accompanied with hypothe-ses for structural rearrangements and selection pressures which occur in the two parents, with more precision in P. Lilin. Our understanding of these rearrangements is not complete, but our findings do provide testable hypothe-ses for molecular cytogenetic studies for visualizing structural polymorphisms. It is clear that more genome
terns in the A genome, which are very important for breeding activities. The SSR markers provide a frame-work for selecting polymorphic markers for new mapping studies, whereas the DArT markers will efficiently com-plement a loose SSR selection for efficiently filling poten-tial gaps. Therefore, new maps can be quickly generated
when new progenies are available. A complementary ad
hoc effort could also be needed to develop co-dominant
markers which can reveal dosage effect in order to help resolve patterns which involve structural rearrangements.
Methods
Material
The segregating population, named "Borli" in this paper, was obtained from the intraspecific cross of two
heterozygous diploid accessions [M. acuminata 'Borneo'
x M. acuminata cv. 'Pisang Lilin']. The parents were cho-sen based on a combination of different criteria such as genetic distance (0.8 from simple matching distance based on 20 SSR markers, data not shown), allelic heterozygosity (>60% for each parent on the basis of 20 SSR study, data not shown) and putative structural
heterozygosity. The M. acuminata 'Borneo' female parent
belongs to subsp. microcarpa and is a "wild" seeded
acces-sion originated from Indonesia. It was shown as a struc-tural homozygote belonging to the "standard group" [5]. The M. acuminata 'P. Lilin' variety is a male fertile M. acuminata subsp. malaccensis derivative originating from Malaysia, and supposedly heterozygous for one translo-cation as a hybrid from Central and North Malayan trans-location groups [5,10].
The cross was made in Guadeloupe (French West
Indies). The F1 hybrids were germinated in vitro [35] and
the 268 plantlets then transferred to a greenhouse in Montpellier. The ploidy level of all individuals was assessed by flow cytometry and chromosome counts; one case of triploidy was observed and the corresponding individual was removed. One hundred and eighty ran-domly chosen individuals were genotyped for segregation analysis.
DNA isolation
Leaves were harvested for DNA extraction 2 months after plant transfer to the greenhouse. 3 g of frozen material was ground with liquid nitrogen with a mortar and pestle following the modified Matab method [36]. The DNA was re-suspended in PCR grade water after isopropanol evaporation.
Ploidy level
cytome-try. Nucleus extraction and staining were prepared with a CyStain UV ploidy kit (Partec CyStain UV ploidy kit, Partec GmbH, Münster, Germany). The analyses were performed with a PAS flow cytometer (Partec) equipped with an HBO lamp for UV excitation. A leaf sample of each individual plant was chopped together with leaf
tis-sue of M. acuminata cv. Cavendish clone (2N = 3× = 33)
as an internal reference. Each plant underwent two inde-pendent measurements.
As a cross reference, chromosome counts on root tip squashes [39] were also performed on a sample of 20 indi-viduals.
Cytogenetic analysis
Immature anthers were excised from male flower buds of both Borneo and P. Lilin clones from 28 to 33 days before anthesis, and fixed overnight in a 1:3 acetic acid: ethanol solution saturated with ferric acetate. They were then transferred into 70% ethanol and stored at 8°C in this solution.
Meiotic chromosomes were studied in pollen mother cells (PMCs) squashed in aceto-carmine staining solu-tion. Observations were performed on metaphases I con-taining enough well flattened cells to complete bright-field analysis at ×1000 magnification or differential inter-ferential contrast analysis. An average of 15 PMCs per clone were scored for chromosome rearrangements.
SSR markers
We tested 38 SSR markers from a SSR enriched library
constructed from M. acuminata 'Gobusik' (mMaCir01 to
mMaCir 45 [40], Jarret 03 to Jarret 1_32 and Ma1_17 to Ma 3_90 [41] and 205 SSR markers from another SSR enriched library for (CA)n and (CT)n microsatellite and
constructed from M. acuminata 'Calcutta 4' and M.
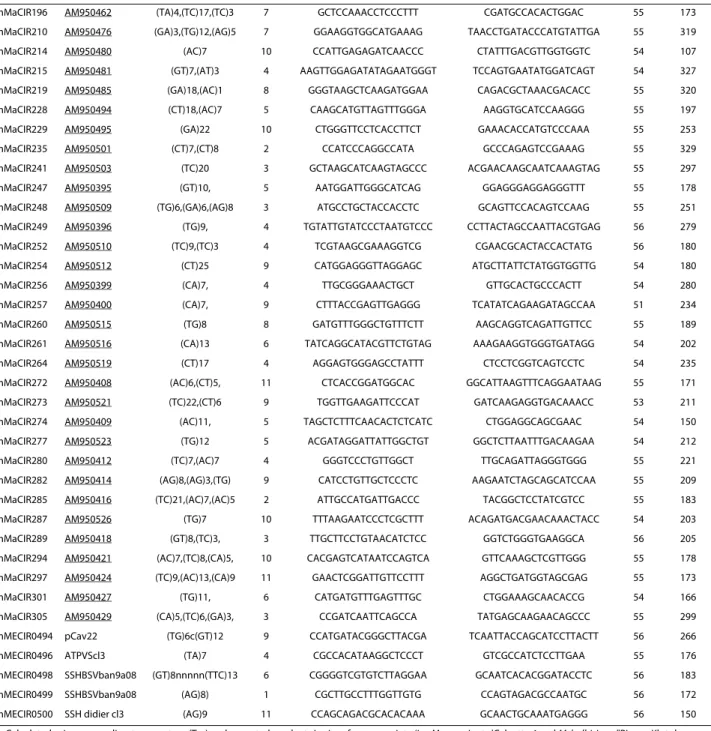
bal-bisiana 'Pisang Klutuk Wulung' (mMaCir101-EMBL AM950326 to mMaCir307 -EMBL AM950533). The SSR markers with their primer pairs are presented in Table 2.
We also used 143 markers from a M. acuminata 'Calcutta
4' EST library (mMECir501-EMBL FM878660 to mMeCir642-EMBL878794). The other SSR markers came from other EST sequences (mMECIR491 to
mMECir500; Table 2 and [42]) from M. acuminata
"Cav-endish".
For a given SSR locus, the forward primer was designed with a 5'-end M13 extension (5'-CACGACGTTG-TAAAACGAC-3') in order to generate fluorescent ampli-cons after fluorescent dye hybridization. Primer pair tests were performed on a 96 well PTC 100 thermocycler using the same protocol and reaction mixture as described below, in a final volume of 20 μl.
The PCR amplification was performed in a 384 well
Eppendorf mastercycler with 10 ng of Musa DNA in a 10
μl final volume of buffer (10 mM Tris-HCl (pH 8), 100
mM KCl, 0.05% w/v gelatin, and 2.0 mM MgCl2) contain-ing 0.08 μM of the M13-labelled primer, 0.1 μM of the other primer, 160 μM of dNTP, 1 U of Taq DNA poly-merase (Life Technologies, U.S.A.) and 0.06 μM of M13 primer-fluorescent dye IR700 or IR800 (Biolegio, Nether-lands).
The SSRs were amplified by couples. Two SSR markers were amplified at the same time in a 384 well plate under touchdown PCR conditions: initial denaturation at 94°C for 60 s; touchdown cycles were performed at a rate of -1°C/cycle. The first cycle was conducted at the highest primer melting temperature (TM), and the last cycle of the touchdown program was conducted at the lowest primer pair TM. These initial cycles were followed by 35 cycles at 94°C for 30 s, [lowest TM -1°C] for 60 s, and 72°C for 120 s; and a final elongation step at 72°C for 5 min. For example, if the TM of the first pair was 58°C and the TM of the second pair was 53°C, we performed the first cycle at 59°C; the 7 following cycles were performed in touchdown at 53°C. PCR was achieved with 35 more cycles at 52°C.
IR700 or IR800-labeled PCR products were diluted 8-fold and 5-8-fold respectively, subjected to electrophoresis in a 6.5% polyacrylamide gel and then sized by the IR flu-orescence scanning system of the sequencer. For each run, a ladder (range 71 to 367 bp) was added at the edges of the gel. The gel pictures were analyzed using AFLP-quantar Pro software [43] with two independent read-ings.
DArT markers
DArT arrays were produced from individualized clones
of libraries prepared from PstI-based genomic
represen-tations [44]. Two genomic represenrepresen-tations comprising
11520 DArT markers were generated from 53 Musa
gen-otypes ([45]). A random sample of 92 plants, out of the 180 analyzed with SSRs, was analyzed on each represen-tation. The DArT markers heterozygous on one parent only were scored as co-dominant (segregation ratio 1:1), whereas the DArT markers polymorphic on both parents were scored as dominant (segregation ratio 1:3).
Segregation distortion
sequences (mMECIR0494 to mMECIR0500).
SSR EMBL motif LG forward primer reverse primer Ann (°C) Size (bp)
mMaCIR102 AM950328 (AG)10,(TG)5 6 TGTTGGATTGGCTTCATC CTTCGTTCAATGGTCTCCT 55 220
mMaCIR103 AM950329 (CT)14, 3 CCTCTTCTCCCTGTGTTG CGGTTTAACATACCTATTCTTG 54 179
mMaCIR105 AM950331 (CA)8,(CT)15 6 CATCCACTTGCTTTTCCA CTTCACGGCTTCCACA 56 264
mMaCIR108 AM950334 (CA)7,(CA)4, 2 ACGCATGGTAAAGTGGAA ACATTCAAATCACGTTGCT 55 111
mMaCIR109 AM950335 (CA)13, 4 ACTCTAGTTCCAGAATAACTCCA CAATCTTCATTAGCCAGTTGT 55 204
mMaCIR110 AM950336 (AC)7,(GA)6, 3 GGTGAACTGATGTGCGA TCTTTCAACGGAATAAGCA 55 244
mMaCIR111 AM950337 (CA)8, 6 TCGTATGGAACAACAGTCC CTTTCACCTTCAAACAGCA 55 137
mMaCIR112 AM950338 (CA)5,(CA)15 7 GTTCGGCTGGAGGTAGTT AAGAACACGAAGGCAGG 55 330
mMaCIR113 AM950339 (CA)10, 10 TCAAGTATTTCACCGTATTGC TTACCACCCTGTCATCTTTC 55 207
mMaCIR114 AM950340 (AC)7,(CT)28 8 GCAAGCCAAAGGGAA ACCAACAAAGAATGGTGTAA 54 222
mMaCIR115 AM950341 (CA)2, 11 CAAGAGACTACCACCGAAGA TGATTCTCACGACGTATGG 55 114
mMaCIR116 AM950342 (TC)2,(TC)20 11 ACACAAAGAAACCAGCCA CGTCCCATCGTCTCCT 55 202
mMaCIR117 AM950343 (TC)20, 7 GTTTGTGGAATAAGTGGGAA ATGAGGGAGTTAGTGGTGG 55 214
mMaCIR119 AM950345 (CA)9,(TA)6,(CA)5, 10 TGAAAAGCAATCCAACCT ACCCTGAAATGTTTGTCTTT 54 395
mMaCIR122 AM950348 (GT)8, 7 CGGTGACACTGGAAGGT CAACTGAAGAACTGCCACTAA 56 204
mMaCIR124 AM950350 (AC)7, 9 ACCTTGACAGCCCTCTTC ATCAATCATTTCTGGGGTT 55 63
mMaCIR129 AM950355 (CA)6, 5 CTAACCTTTGATTCTGTTTG GTCCCTGATACACCATTC 50 214
mMaCIR130 AM950356 (TG)17, 6 TTAAACGTCTCCGTGTCTTC TTGCATGAGGCTGGG 56 311
mMaCIR137 AM950363 (TC)12, 4 CGTATTCTACATCTGCTTCTTT GCAGTGATTAGGTGATGATTT 54 223
mMaCIR138 AM950364 (CA)7, 3 TCATTCTCATGCGGAACT CGGTGGATGTTGTTGG 55 173
mMaCIR139 AM950365 (GA)18, 5 TCGTCCCCTACTGCCT ATGCTTCCGTTTGGCT 55 187
mMaCIR150 AM950440 (CA)10 3 ATGCTGTCATTGCCTTGT GAATGCTGATACCTCTTTGG 55 238
mMaCIR151 AM950441 (CT)21 3 TATCCACCTCCTGGCAC GCCAAACATCACCCAAC 55 172
mMaCIR152 AM950442 (CTT)18,(CT)17,(CA)6 4 CCACCTTTGAGTTCTCTCC TTTCCCTCTTCGATTCTGT 55 163
mMaCIR154 AM950444 (CT)17 4 CATTCAGCATGGAAACCT CTTCCTCAAACTGCTCCTC 55 311
mMaCIR156 AM950446 (TG)23 4 CTTTCTGAAGGAAATTCTGAC AGTGCAGCCCAATGAA 54 210
mMaCIR157 AM950447 (CA)9,(TA)7 11 TGGTATTATTTCATAGCCCTTC ATGGTATTGTTGGATGGTGT 55 272
mMaCIR162 AM950452 (CA)8 11 CTGCCTGTCCCACGA GCGGCCATCATAATTCC 57 161
mMaCIR163 AM950453 (AC)14 1 TGAAACAATCTTCATCAGCT TCTGGACTTGGATGCTATTT 55 247
mMaCIR167 AM950367 (AC)7, 1 CACTTCCACCTCTGCATC GGTCTACTAACTTGAACACGAAC 55 336
mMaCIR168 AM950368 (CA)7, 10 GCACCAAACCAGTCCTAC CGTCTCAGTTGCCGTG 55 243
mMaCIR169 AM950369 (CT)14,(CA)1 3 TTTGGAGGAGACCATGATT GCATTACATATCCTGCCTTT 55 297
mMaCIR170 AM950370 (CA)8, 3 GGGCCTCCATAAGCAA ACTTACCTTCCTGCCCAC 55 202
mMaCIR171 AM950371 (CA)5,(GA)10 7 GTAATACAAGTCTTCAGAGCAT CTGTTTCGCCACTATCTT 51 192
mMaCIR172 AM950372 (CT)19, 1 CAGCTAATGCCAAACCC CGACTTCGAGCGAGC 55 258
mMaCIR174 AM950374 (AG)13, 2 GAACCCACCTCCCTCTT TGGGATTCCTGAGTGCT 55 167
mMaCIR180 AM950380 (CA)7, 1 GCCTCAGCCTCATCATC CACCCACTCGACCCA 55 226
mMaCIR182 AM950382 (TC)22, 9 AACGCTTCTGCCTTGTT TGAGACGTATTGCCCTAGTT 55 150
mMaCIR184 AM950384 (TG)7, 3 TGTCATCGGCATAGACTG TGGAATTGAACTGAAGCC 54 314
mMaCIR185 AM950385 (TG)8, 2 CATTTCTATTCCCAGTCCC CCAATGTTACTTCCATGCT 54 181
mMaCIR188 AM950388 (TG)9,(TA)7, 3 GTGCTTGTTCGCTTGTTT AGCCCAAGTATCCCACC 56 160
mMaCIR189 AM950389 (CT)3,(CT)16 2 GGGAGGGCAGAGGAA GCCGAACTTGGTAATGTG 55 259
mMaCIR192 AM950458 (TG)8 3 TGACCTAGCACAACGCA GCTTATGTTTCATCGCCTT 56 133
mMaCIR193 AM950459 (AC)8 9 TGTCCCTATCTGTCCTCTTT CGCTTTGGAGTGTGCT 54 301
mMaCIR196 AM950462 (TA)4,(TC)17,(TC)3 7 GCTCCAAACCTCCCTTT CGATGCCACACTGGAC 55 173
mMaCIR210 AM950476 (GA)3,(TG)12,(AG)5 7 GGAAGGTGGCATGAAAG TAACCTGATACCCATGTATTGA 55 319
mMaCIR214 AM950480 (AC)7 10 CCATTGAGAGATCAACCC CTATTTGACGTTGGTGGTC 54 107
mMaCIR215 AM950481 (GT)7,(AT)3 4 AAGTTGGAGATATAGAATGGGT TCCAGTGAATATGGATCAGT 54 327
mMaCIR219 AM950485 (GA)18,(AC)1 8 GGGTAAGCTCAAGATGGAA CAGACGCTAAACGACACC 55 320
mMaCIR228 AM950494 (CT)18,(AC)7 5 CAAGCATGTTAGTTTGGGA AAGGTGCATCCAAGGG 55 197
mMaCIR229 AM950495 (GA)22 10 CTGGGTTCCTCACCTTCT GAAACACCATGTCCCAAA 55 253
mMaCIR235 AM950501 (CT)7,(CT)8 2 CCATCCCAGGCCATA GCCCAGAGTCCGAAAG 55 329
mMaCIR241 AM950503 (TC)20 3 GCTAAGCATCAAGTAGCCC ACGAACAAGCAATCAAAGTAG 55 297
mMaCIR247 AM950395 (GT)10, 5 AATGGATTGGGCATCAG GGAGGGAGGAGGGTTT 55 178
mMaCIR248 AM950509 (TG)6,(GA)6,(AG)8 3 ATGCCTGCTACCACCTC GCAGTTCCACAGTCCAAG 55 251
mMaCIR249 AM950396 (TG)9, 4 TGTATTGTATCCCTAATGTCCC CCTTACTAGCCAATTACGTGAG 56 279
mMaCIR252 AM950510 (TC)9,(TC)3 4 TCGTAAGCGAAAGGTCG CGAACGCACTACCACTATG 56 180
mMaCIR254 AM950512 (CT)25 9 CATGGAGGGTTAGGAGC ATGCTTATTCTATGGTGGTTG 54 180
mMaCIR256 AM950399 (CA)7, 4 TTGCGGGAAACTGCT GTTGCACTGCCCACTT 54 280
mMaCIR257 AM950400 (CA)7, 9 CTTTACCGAGTTGAGGG TCATATCAGAAGATAGCCAA 51 234
mMaCIR260 AM950515 (TG)8 8 GATGTTTGGGCTGTTTCTT AAGCAGGTCAGATTGTTCC 55 189
mMaCIR261 AM950516 (CA)13 6 TATCAGGCATACGTTCTGTAG AAAGAAGGTGGGTGATAGG 54 202
mMaCIR264 AM950519 (CT)17 4 AGGAGTGGGAGCCTATTT CTCCTCGGTCAGTCCTC 54 235
mMaCIR272 AM950408 (AC)6,(CT)5, 11 CTCACCGGATGGCAC GGCATTAAGTTTCAGGAATAAG 55 171
mMaCIR273 AM950521 (TC)22,(CT)6 9 TGGTTGAAGATTCCCAT GATCAAGAGGTGACAAACC 53 211
mMaCIR274 AM950409 (AC)11, 5 TAGCTCTTTCAACACTCTCATC CTGGAGGCAGCGAAC 54 150
mMaCIR277 AM950523 (TG)12 5 ACGATAGGATTATTGGCTGT GGCTCTTAATTTGACAAGAA 54 212
mMaCIR280 AM950412 (TC)7,(AC)7 4 GGGTCCCTGTTGGCT TTGCAGATTAGGGTGGG 55 221
mMaCIR282 AM950414 (AG)8,(AG)3,(TG) 9 CATCCTGTTGCTCCCTC AAGAATCTAGCAGCATCCAA 55 209
mMaCIR285 AM950416 (TC)21,(AC)7,(AC)5 2 ATTGCCATGATTGACCC TACGGCTCCTATCGTCC 55 183
mMaCIR287 AM950526 (TG)7 10 TTTAAGAATCCCTCGCTTT ACAGATGACGAACAAACTACC 54 203
mMaCIR289 AM950418 (GT)8,(TC)3, 3 TTGCTTCCTGTAACATCTCC GGTCTGGGTGAAGGCA 56 205
mMaCIR294 AM950421 (AC)7,(TC)8,(CA)5, 10 CACGAGTCATAATCCAGTCA GTTCAAAGCTCGTTGGG 55 178
mMaCIR297 AM950424 (TC)9,(AC)13,(CA)9 11 GAACTCGGATTGTTCCTTT AGGCTGATGGTAGCGAG 55 173
mMaCIR301 AM950427 (TG)11, 6 CATGATGTTTGAGTTTGC CTGGAAAGCAACACCG 54 166
mMaCIR305 AM950429 (CA)5,(TC)6,(GA)3, 3 CCGATCAATTCAGCCA TATGAGCAAGAACAGCCC 55 299
mMECIR0494 pCav22 (TG)6c(GT)12 9 CCATGATACGGGCTTACGA TCAATTACCAGCATCCTTACTT 56 266
mMECIR0496 ATPVScl3 (TA)7 4 CGCCACATAAGGCTCCCT GTCGCCATCTCCTTGAA 55 176
mMECIR0498 SSHBSVban9a08 (GT)8nnnnn(TTC)13 6 CGGGGTCGTGTCTTAGGAA GCAATCACACGGATACCTC 56 183
mMECIR0499 SSHBSVban9a08 (AG)8) 1 CGCTTGCCTTTGGTTGTG CCAGTAGACGCCAATGC 56 172
mMECIR0500 SSH didier cl3 (AG)9 11 CCAGCAGACGCACACAAA GCAACTGCAAATGAGGG 56 150
Calculated primer annealing temperature (Tm) and expected product size in reference variety (i.e. M. acuminata 'Calcutta 4 and M. balbisiana "Pisang Klutuk
Wulung" for mMaCIR102 to mMaCIR305 and M. acuminata 'Cavendish' for mMECIR0494 to mMECIR0500). Expected size does not take into account the M13 tail
(19 bp) added to each 5'end of forward primer. LG: linkage group; Ann: Annealing temperature used.
Table 2: Characteristics of the mapped SSR loci from a Musa genomic library (mMaCIR102 to mMaCIR 305) and from EST
sequences (mMECIR0494 to mMECIR0500). (Continued)
Linkage map construction
Borneo and P. Lilin parental maps were built from the analysis of marker segregation in the progeny. The P. Lilin map was further refined based on hypotheses of struc-tural rearrangements. Finally the structure of each chro-mosome of structural heterozygous pairs was given on the basis of the structural pattern leading to a simulated NJ tree (see below) that fitted the observed one.
A third map, named the "synthetic map", is meant to
represent the standard/ancestral Musa chromosomes