Instituto Superior de Ciências do Trabalho e da Empresa
“
Market Efficiency, Nonlinearity and Technical
Analysis in the Global Market
”
Amadú Ly
Dissertation submitted as partial requirement for the master’s
degree in Finance
Supervisor:
Prof. Pedro Leite Inácio
Abstract
In this thesis we investigate market efficiency from a different perspective. Instead of traditional approach to one market in specific, this time around we study market efficiency from a global perspective. See the global market indices as one single market. We used both nonlinear methods and technical analysis in order to accomplish our purpose. We used BDS to test for nonlinearity in the return series, as expected the results conformed with the general view, which is market returns exhibit nonlinear dependence. We trace the cause of the dependence as a result of the ARCH type process. We also used technical trading strategy to test whether profit can be made through trading in stock indices around the world. We investigate the simple moving averages, weighted moving averages and exponential moving averages with different allocation of resources, we found all techniques to be profitable when 1% and 2% commission are considered. For the 50 day simple moving average, the average daily return is 0,0009%, compared with the -0,669% of the buy and hold strategy. These results were also confirmed using bootstrap methodology in which we considered the random walk model as return generating process. These rules are profitable after accounting for commission fees.
JEL classification: G11; G14
Keywords: World market indices; Market Efficiency; Nonlinearity; BDS; Technical analysis; Bootstrap
Resumo
Nesta dissertação analisou-se a eficiência dos mercados numa perspectiva diferente. Em vez da abordagem tradicional a um mercado específico, estudou-se a eficiência de uma forma global. Considerou-se que os índices globais dos mercados formavam um mercado único integrado. Utilizaram-se simultaneamente métodos não lineares e a análise técnica para testar a eficiência do mercado global. Utilizou-se a BDS para testar a não linearidade na série de rendibilidades dos índices, tal como esperado, os resultados confirmaram os estudos anteriores, ou seja, os mercados têm uma dependência não linear. Esta dependência resultará de um processo de tipo ARCH. Utilizaram-se regras de “trading” baseadas na análise técnica para testar se é possível obter uma rendibilidade anómala com os referidos índices de acções. Consideraram-se médias móveis simples, ponderadas e exponenciais, ensaiando várias afectações diferentes de recursos (ponderação igual e proporcional), detectou-se que todas as estratégias eram rentáveis mesmo depois de considerar comissões de 1% e até de 2%. Para a média móvel simples de 50 dias, a rendibilidade media diária é de 0,0009%, comparável com -0,669% para a estratégia “buy and
hold”. Estes resultados também foram confirmados através da metodologia de “bootstrap”, em
que se considerou o modelo “random walk” como um processo gerador das rendibilidades. Estas estratégias são rentáveis mesmo depois de consideradas as comissões.
JEL classification: G11; G14
Keywords: Indices bolsistas; Efficiência dos Mercados; Não linearidade; BDS; Análise técnica; Bootstrap
Index
0 Introduction ...1
1 Random Walk and Martingale an Introduction...4
1.1 The Martingale Model...4
1.2 The Random Walk Model ...5
1.2.1 Random walk 1: independent identically distributed (IID) increments ...5
1.2.2 Random walk 2: Independent increments ...6
1.2.3 Random walk 3: Uncorrelated increment...6
1.3 Literature Review on Random Walk and Market Efficiency...6
2 Market Efficiency...16
2.1 Efficient Capital Market...17
2.1.1 Weak form hypothesis...18
2.1.2 Semi-strong form hypothesis ...18
2.1.3 Strong form hypothesis ...18
2.2 Implications of the Efficient Market Hypothesis (EMH) for Investment Policy...19
2.3 Technical and Fundamental Analysis ...19
2.3.1 Moving Averages ...20
2.3.2 Relative Strength ...22
2.4 Test of Predictability in Stock Market Returns ...23
2.4.2 Non Parametric Tests ...25
2.4.3 Filter Rules ...26
2.4.4 Variance Ratio Test ...27
2.4.5 BDS Test ...28
2.5 Market Correlation ...29
2.5.1 Very Short Term Correlation ...29
2.5.2 Correlation for a Portfolio of Securities ...29
2.5.3 Correlation Over Longer Horizons ...30
3 Selected Empirical Irregularities or Market anomalies...31
3.1 Calendar anomalies ...32
3.1.1 Monday and Days of the Week Effect ...32
3.2 Returns and Firms Characteristics...33
3.2.1 The Size Effect ...34
3.2.2 Announcement and Price Return...35
3.3 Momentum Effect ...35
3.4 Market Rationality...37
3.5 Large Volatility ...38
4 Empirical Study...39
4.1 The Data ...39
4.2 Non Linear Dependence...41
4.2.1 Nonlinearity Tests ...42
4.3 Description of the Methodology ...43
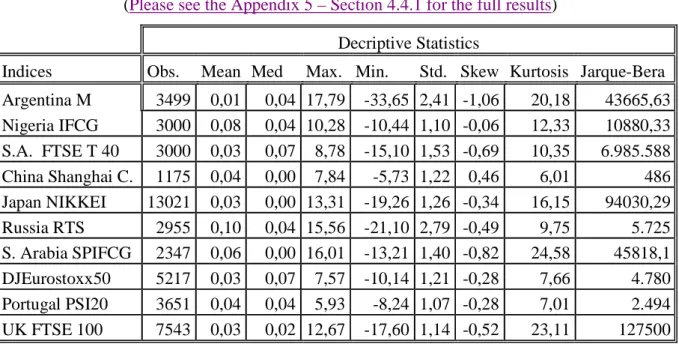
4.4 Empirical Results ...44
4.4.1 Statistical Properties of Rates Returns ...44
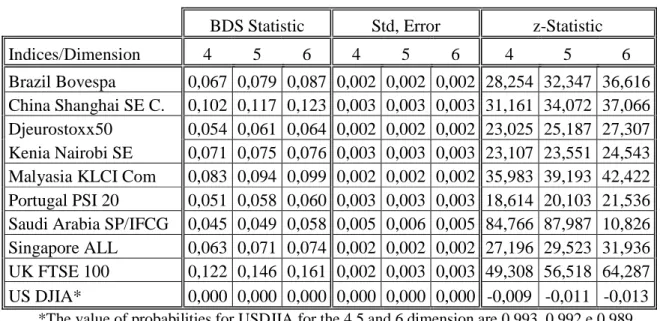
4.5 The BDS Test Result...45
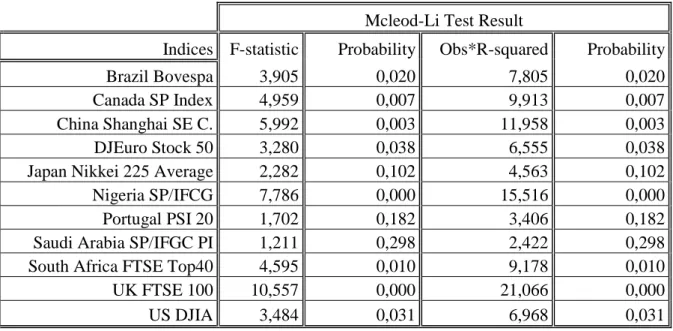
4.6 Mcleod-Li Test ...47
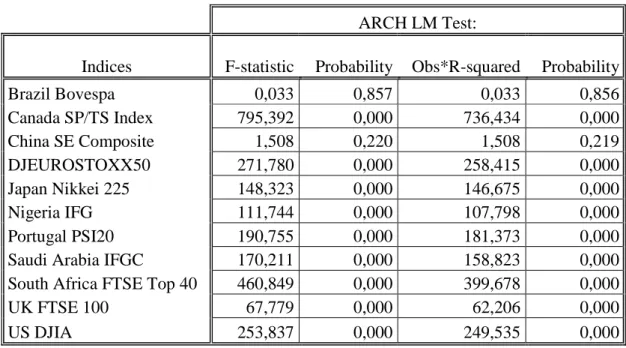
4.7 Engle LM test ...48
4.8 Technical Analysis/Simulation Strategy ...49
4.8.1 Description of the Methodology ...49
4.9 Results of the Simulation Strategy ...51
4.10 Sharpe Ratio ...53
4.11 Bootstrap Analysis ...54
5 Conclusion...56
Appendix ...75
Appendix 1- Section 2.4.5 BDS ...75
Appendix 2 - Section 4.2.1 NonLinear Test...76
Appendix 3 – Section 4.3 ...76
Appendix 4- Section 4.2 Data Stream Market Capitalisation ...77
Appendix 5 - Section 4.4.1 to Table 1- Table of Descriptive Statistics...78
Appendix 5-Section 4.5 to Table 2 – Table 2 BDS Test Results ...79
Appendix 7- Section 4.6 to Mcleod-Li Test Result ...80
Appendix 9- Section 4.9 to Table 5- Result for the Technical Trading Strategy...82
Appendix 10- Results of Trading Analysis in Dollar Terms ...86
Appendix 11- Section 4.10 to Table 6- The Sharpe Ratio ...88
Acknowledgements
First, I would like to thank Professor Pedro Leite Inácio, my supervisor in this thesis, for the help and guidance in concluding this master. I would also like to thank Professor Dias Curto, for helping with the econometrics study and Professor Paul A. Lax for the support.
0 Introduction
Market efficiency, which is the answer to the question if prices “fully reflect” the available information, has been the concern of some many distinguished researchers over time and results have been somewhat in favour of efficiency. Although of late there have been some challenging results against the efficient market hypothesis. In all, for most developed countries market efficiency has been upheld, whilst for the developing countries there have been some mixed results. Apart from the econometric studies used to study market efficiency, technical analysis, concerned with the prediction of future price movements based on past prices, has been used to test for efficiency. Earlier technical analysis studies, such as the studies by Alexander (1961), Fama and Blume (1966) and Jensen and Bennington (1970) found technical analysis to be profitable when no commission is taken to account. After which they become unprofitable due to the large amount of transaction required. The basic idea is that under market efficiency theory technical analysis is a useless activity, which is to say it should not be profitable. And all these studies supported this idea. Of late, however, some studies such as the Brock et al. (1992) and Bessembinder et. al (1995) showed that the idea that held technical analysis as a waste of time may be too premature. As they showed technical analysis can be profitable, even after accounting for commission.
Earlier studies carried out on price independence had taken, until recently, more or less for granted that movements in stock market prices are stochastic in nature, if not actually random walk. And it seems unlikely that a pattern in stock market returns could be explained by a deterministic process, given the assumption that price movement in stock prices is due to the flow of news. However, nowadays, there is a broad agreement that nonlinear structures exist in financial series.
Uncovering this phenomenon his due to the effort on the part of researchers, which upon observing some departure from efficiency Fama (1991) and Lo and Mackinlay (1989) and others, tried to find plausible explanations for the phenomenon and these actions led to the creation of a set of tests capable of detecting nonlinear patterns in time series data.
It became clear that many low dimension deterministic processes outputs are similar to white noise’s. This implies that one may be led to infer on the assumption of random walks when the process is in fact not a random walk.
In this thesis we propose to study market efficiency from a different perspective. Contrary to previous studies on market efficiency that focused on particular markets or countries, this time we propose to study market efficiency in a global perspective, seeing the entire market indices as a single market. With that aim in mind we selected 50 stock market indices across the global market.
In order to pursue our goal we combined nonlinear studies and technical analysis. We used BDS to test for nonlinearity on the series of returns, instead of the traditional linear models that upheld market efficiency whenever in the presence of zero correlation. For technical analysis we constructed a trading simulation model that combines the size and indices selection as a way to construct a high performance portfolio. To test whether the idea held by professional economists is true that markets are efficient and technical analysis is a waste of time.
In sum, we used non linear models to test for non linear dependence. The result of BDS test gave us indication that all market indices exhibited nonlinear dependence, and that this dependence is transmitted through variance. This fact gave us hope that technical trading strategy might be profitable. The question is whether a naïve approach to technical analysis such as using simple, weighted and exponential moving averages to select the indices and decide when to buy/sell an index can be profitable as well.
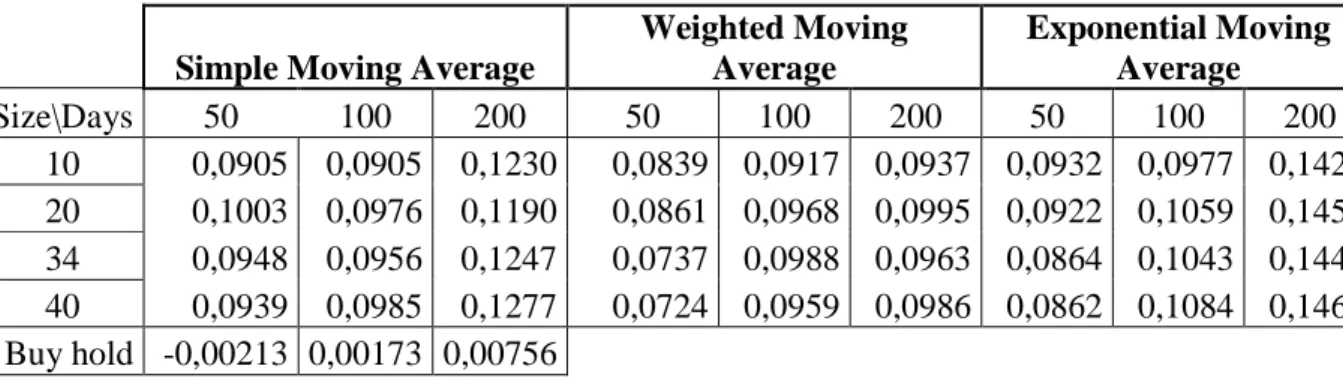
We tested the simulation with no commission, 1% and 2% commission fees. For the benchmark, that is for the buy and hold strategy we considered the MCSI Global market index. The result for the buy and hold strategy is -0,669% daily average return. The result for the technical trading rule,50 days simple moving average, portfolio size 10 and 1%, is 0,0009% daily average return, which is significantly different from buy and hold strategy. These results are robust to commission fees. Contrary to the held belief on technical analysis, this result is economically and
statistically significant, and all techniques tested are profitable and statistically significant. The reason for predictability can be traced back to ARCH effect identified by Enlge’s LM test.
In addition to standard t-test statistics used, to evaluate the profitability of technical trading strategy, we used bootstrap methodology as suggested by Brock et al.(1992). So as to determine whether the technical trading rule captures the stochastic process underlying the portfolio returns. The bootstrap result conformed with the result of the trading simulation’s result.
The remaining chapters are organised as follows: Chapter one describes the concept of fair game, martingale and random walk model and reviews the literature on random walk and marketing efficiency through the 20th century. Chapter two discusses the concept of market efficiency and its evolution, the implication of the concept of market efficiency for investment policy and the tests used to study market efficiency and the results of those studies. Chapter three, discusses the market anomalies, the numbers of anomalies documented are so large that the focus will be directed only to those more robust and common throughout other markets. Chapter fourth describes the methodology employed to test global market efficiency, the nonlinearity test used and the state of the nonlinearity in the financial literature and the model built to simulate transactions. And finally, in Chapter five we present the conclusions to the entire thesis.
Chapter 1
1
Random Walk and Martingale an Introduction
Random walk is one of the most fascinating, challenging and at the same time the most controversial subjects in the world of finance. This can easily be proved by the fact that so many researchers have devoted their time and skill trying to solve this puzzle. Like many words in economics, random walk was borrowed from physics. Meaning “If the drunk can be expected to stagger in a totally unpredictable and random fashion, he is likely to end up closer to where he had been left than any other point1”. For the stock market the meaning is basically the same, which is, you cannot predict tomorrow prices based on yesterday prices. The best forecast for tomorrow’s price is today’s price, since the price itself is as likely to go up as it is likely to fall down. The main idea is that stock market prices cannot be predicted by simply looking at past prices. This line of reasoning allows us to believe that prices are a fair game.
1.1
The Martingale Model
In the 16th century, an Italian mathematician conveyed the basic meaning of fair game in the following phrase: “the most fundamental principle of all in gambling is simply equal conditions, e.g., of bystanders, of money, of situations, of dice box, and of dice itself. To the extent to which you depart from that equality, if it is in your opponent’s favour, you are a fool, and if in your own, you are unjust”2. He managed to convey in this definition the basic assumption of “fair game”, which is neither in your favour or your opponent’s and this is the concept deeply rooted in the Martingale Model. This is shown in the formula below:
E [Pt+1|Pt, Pt-1,….]=Pt, (1) or equivalently,
E [Pt+1-Pt|Pt, Pt-1,….]=0 (2).
1 Karl Pearson in Dimson and Mussavian(1998) 2
This means that, if Pt follows a stochastic process, then the best estimate of tomorrow’s price,
based on today’s information, is today’s price (see 1). Or alternately, a game is fair if the gain from estimating tomorrow’s price, based on today’s information, is zero (see 2), hence the price is as likely to rise as it is to fall. Implying the ineffectiveness of all linear forecasting rules for future price changes based on historical prices alones. In other words, if investors can use any information available today to predict future price, the Martingale Model would be violated. The Martingale hypothesis was once considered to be a necessary condition for the Efficient Market Hypothesis (EMH). However, as pointed out by Leroy (1973) and Lucas (1978), the forecastability of prices does not imply market inefficiency, nor inefficiency implies forecastability.
1.2
The Random Walk Model
A process is called Random Walk if it cumulatively encompasses the Martingale conditions in addition to the independency of high conditional moments (i.e., variance, skewness, and kurtosis). Random Walk means that future price level is no more predictable than the path of accumulated random numbers. Price change from past period (t-1) is independent of price change in the next period (t): the series of price changes has no memory. In other words, past price cannot be used to predict future prices. This means that technical and fundamental analysis are of no value to professional investors.
Campbell, Lo and Mackinlay (1997) propose differentiation of the types of random walks. According to them there are three types of random walks, we are in the presence of:
1.2.1 Random walk 1: independent identically distributed (IID) increments
Pt = µ+Pt-1+εt, εt ~IID(0, σ2) (3),
where µ is the expected price change or drift and IID(0, σ2) denotes that εt is independently and
identically distributed with mean zero and variance σ2. The independence of increments (εt)
model: it implies that the increments are uncorrelated and also that any nonlinear increments of the functions are uncorrelated.
E[Pt|P0]= P0+µt (4)
Var[Pt|P0]= σ2t (5)
1.2.2 Random walk 2: Independent increments
The difference from random walk one to random walk two lies in relaxing the assumption of identical distribution of returns. The argument supporting this view stems from the fact that over time the return probability changes. Price changes, though uncorrelated, tend not to be independent over time but instead to have clusters of volatility. It is a more realistic approach to financial markets than random walk one.
1.2.3 Random walk 3: Uncorrelated increment
Random walk three is a more general concept than the previous two. It loosens both the assumption of independency and identically distributed returns.
1.3
Literature Review on Random Walk and Market Efficiency
It is difficult to argue against the idea of random walk, for it bears one of the most important assumptions of modern finance, the idea of fair game. The underlying concept is that, regardless of the level of one’s own knowledge of the stock market, one can perform as well as any professional stock market trader, in average. In other words, the best strategy in the stock market is the buy and hold. Buy a stock market index and you are certain to perform as well as or better than any other professional investor and with a plus, you have not spent a huge amount of resource on acquiring information that is useless, because you cannot profit from it. The superior
performance of some portfolio manager or any broker is seen as mere luck3, something that cannot be repeated on a regular basis. Which is to say, no one can beat the market every time, as there is no information in the stock market that gives indication on the direction of the price movement, thus allowing professional investors to outperform the market. Technical analysis is, in sum, a waste of time.
This controversy between market professionals and academics has been going on since the beginning of the stock markets and is still going today even though nowadays, with the new econometrics tools, some light has been shed on the subject, concerning predictability of stock market prices and market efficiency.
There were, back then, two fields of battle clearly established. On the one side the supporters of random theories, mostly economists and academics, and on the other side professional investors and stock market traders which claim that stock prices are predictable. The points of view of one and the other have softened since then and both were forced to admit, to a certain extent, that they were both correct/wrong.
However, all through the late 19th century and the first half of the 20th century, it was not so. Defending either view point would be considered heresy by the other side, be it random walks supporters or stock market analysts4. Any study presented in support of random walks would be followed by another in support of price trend. On both sides of the battle there were fierce believers. There were, however, in all those studies on the predictability of stock market and market efficiency, some common threads. In none of the studies was there clear rejection of either random walk or price trend in its entirety5. There was always something that could not be pinpointed and which was consequently dismissed as irrelevant by one or the other as data anomaly6. But, alas, the true lays exactly in these small, ignored details. Many seriously imperfect assumptions were taken from handicapped studies or ignored data.
3 See Cowles (1933), 4 Cootner(1962)
5 Kendall(1955), Osborne(1959), Fama(1970) 6
Clearly, there were some misunderstandings on the meaning of random walk and stock market predictability, for both, academics and market professionals alike. To the first group it means that the market is not efficient, however, as noted by Lo and Mackinlay7 citing Leroy’s (1973) and Lucas (1978) study, predictability of stock market does not necessarily mean that markets are inefficient. It means simply that prices do adjust to new information. Fama (1970, 1976), also made clear that the assumption of constant equilibrium expected returns over time is not a part of efficient market hypothesis. This is to say that random walk rejection does not imply market inefficiency.
The earlier studies on random walks were concerned with the predictability of stock price movements. It should be added that researches on random walks were not confined to stock market alone or stock market indices or to the US market to that effect. Other markets were also examined, foreign exchange, interest rate8, commodity market, bond market9 and future market10. Academics in other countries also devoted their time and talent to study the phenomenon in their own markets, with the purpose of determining whether the results in the US market could be replicated in the domestic market; they tested both the predictability and market efficiency11 as well.
Had it not been for Cootner(1964), Bachelier’s (1990) pioneer work on Random Walk theory would have been restricted to a few scholars. Bachelier was the first to derive the random walk theory based on the assumption of zero expectation. In his doctorate’s thesis he compared the statistical distribution expected of random theory with the observed distributions of price changes of certain government securities. He found correspondence between what could be expected theoretically with what was observed. Hence, concluded "…tomorrow’s price in a particular series cannot be assessed based on yesterday’s price".
7
Non a Random Down Walt Street, also Black (1971)
8
Fama and Schwert (1977), “Short Term Interest Rates”
9 Keim and Stambaugh (1986), “Spreads between long and short-term interest rates”
10 A. A.Larsen, Random Walk and Forward Exchange Rates A Spectral Analysis, random walk and price trends the
live cattle futures market, fx
11
While Bacheliers’s thesis was concerned with random walks and price independency, Cowles12 concern was to identify whether there is an organisation or individual whose forecast ability provided superior investment on the equity market or predicted the future movement of stock market. To Cowles (1933) the question was: Can anyone beat the market? He was testing what is known today as “strong form efficiency” – this wording would become a jargon years later, after Fama’s (1966) seminal work on market efficiency. This is a subject to be developed in more detail throughout this thesis, but for now let us say the on the issue of forecasting individual stock price Cowles found that, in general, about 12 out of 36 were successful, thus concluding that these successes were due to pure luck.
On the issue of predictions provided by professional practitioners, he found them inconclusive in some cases; in others practitioners failed to forecast the movement of the stock market. Their performance was 4% bellow the performance by pure chance. The conclusion is obvious, better result would be achieved through random process of stock selection, according to Cowles.
Not satisfied with the previous result, Cowles13 , this time, tries to extend its research to determine to what extent stock markets are predictable. This would be a test of weak form efficiency, today. The main purpose was to determine the statistical nature of the so called “structure”. As a result a technique of ratio of sequence over reversals was used in the hope of revealing the “hidden” structure. According to the authors, “in a truly random series a sequences/reversals would equal ½, the same probability as tossing a fair coin”. Their study produced results supporting the price trend theory, there were excess of sequences over reversals in stock market, more than would be expected if the prices follow a random walks process. A sequence is when a rise follows a rise or a decline is followed by a decline, and reversals are when a rise is followed by a decline or a decline followed by a rise. Evidence of “momentum” or “structure” as defined by Cowles et al was uncovered. They also found that stocks that had advanced in one month/year tend to show strength in the following month/year. They try to explain this phenomenon through the impact of the business cycle on behaviour of the stock market14. In this situation the best strategy, according to the authors, “would be to swim with the tide”. This finding seems to contradict the previous study by Cowles (1933) where he finds no
12 Cowles (1933)
13 Cowles and Jones (1937) 14
profit for professional speculator. The question then is: is this profit large enough to accommodate for the fees and brokerage costs? Are profits statistically significant? These questions are recurrent whenever simulations of transactions are being examined. The same question will be asked about the results of this thesis.
Kendall and Hill (1953)15 also delved into the research on weak form efficiency. For them the main question was: How good is the best estimate we can make of next weeks’ price if we know this weeks’ change and the past weeks changes? They studied the serial correlation of the first difference and found that there were no correlation between today’s price and tomorrow’s. According to them “… the knowledge of past price yields no substantial information about future price change”. They found correlation close to zero in almost all the series and concluded that the “… data behave like a wandering series”, being difficult to distinguish statistically between a wandering series and one with a small systematic element. Not only have they argued that it is impossible to predict stock market movements unless with some extraneous information, but also that there is no correlation between various stocks that would give any predictive power. Cootner (1962) points out firstly that Kendall and Hill tried to develop a model that would fit the data and not the other way around. Secondly, they ignored the one exception, cotton series, which was dismissed as data anomaly and considered irrelevant for the purpose of study. However, it seems that the serial correlations observed in this series were due to frequency of the data. Contrary to the other series, which referred to data from a specific day, say, Friday’s closing price, the cotton series was an average of four or five week observations. The main characteristics of these types of series are serial correlation of 1st order16. Finally, limitation techniques may explain why they did not test for increasing variance to test for departure from normality.
In what concerns to the zero correlation, Cootner (1962) argues that this may be due to the combination of negative reactions phenomena on the one side and positive contributions of trends on the other side, thus achieving the zero correlation.
15 M.Kendall and Bradford Hill(1953) 16
Roberts (1959), basing on the earlier researches by Working (1934) who had also suggested that stock prices series were random, and Kendall et al. (1953) showed that the series generated by a series of random numbers was indistinguishable from the US stock prices. Whilst Robert’s targets were market professionals Osborne’s (1959)17 were physicists from US Naval Research Laboratory. Osborne worked with a series of price change rather than serial correlation like Kendall. He found that changes in the log of prices constitute an “ensemble that appears to be normally distributed”18. Osborne’s concerned was the statistical distribution of logarithms of price changes, not trend in stock prices. He gave two major contributions to modern financial theory: first he provided background for random walks, and then the use of a logarithm of price change to test for normality19. Critics sustain that Osborne wanted to understand which model generated the data, so he constructed a model that fitted the data being observed. The data, still, gives the idea of fairness “…fair meeting ground between buyers and sellers”.
There are two major differences between Osborne’s studies and Bachelier’s, the use logarithms of price change, instead of arithmetic, and the idea that price change independency stems from the investors’ action in analysing transactions to transactions, independently. Both Osborne and Bachelier’s work bear the idea of normally distributed returns (finite variance), however Mandelbrot (1963) challenged this assumption by showing that there is evidence of high tail distribution without finite variance. In addition he cast some serious doubt on the studies of return independency based on serial correlations20.
If price were truly random, there would be a major challenge to stock market professional to outperform the market. However, Alexander (1961) believed there were trends in stock markets and the main issue was how to uncover these trends and use them in to our advantage. The way to do this, according to him, was through filter rules (see point 2.4.3 for more detail). The reasoning behind this idea is as follows: if the processes were generated by a random walk process the
17 Brownian Motion in the stock market 18
For further discussion on normality assumption under random walks, please see Mandelbrot(1963) and Fama (1966). According to these authors the best distribution for the return series is not a Gaussian type process, but rather a Stable Paretian -type process. Hsieh (1989) suggest a different distribution
19 for further discussion on the benefits of using Log prices, please see Campbel, Lo and Mackinlay’s The
Econometrics of Financial Markets” 20
Fama (1970) also supports the findings by Mandelbrot in that non-normal distributions are better descriptions of daily returns than normal Gaussian distribution.
expected profit should be zero or to vary from zero profits, both positively and negatively, in a random manner. It would be impossible to establish any strategy that would yield profit greater than expected from a buy and hold strategy. Alexander (1961) found his filter rule profitable even after accounting for commissions. And although, he recognises that speculative price changes appear to follow random walk over time, he also admits that once initiated price changes tend to persist over time. What was mentioned as structure by Cowles and Jones (1937) seems to have been confirmed by Alexander. There is momentum in stock market prices. For Alexander “…an average which over a large number of observations follows a pattern consistent to permit a rule that would theoretically make money is not following an equal probability of random walks, in the normal sense”.
One of the many critics21 of Alexander's work argues that: commissions set for transactions are considered too low, the use of simple arithmetic mean instead of logarithm averages, and the actions of investors that could affect the markets (thin trading-market microstructure) in the sense that the buy and sell price would never be the reported. And finally the bias generated from using closing prices instead of the highs and lows. A buy or sell was assumed more favourably then the closing price which signalled the transaction was to take place. Against critics Alexander argues that the data was used for argumentation purposes, not trading.
In his new study Alexander (1964), after correcting for the biases in the previous study, found all his filters to be profitable if no commissions are considered. Some filters reported to be profitable on the first study were not so in the second one, once they had been corrected for the biases introduced in the previous study. Nevertheless, many others filters were profitable, though the gains were relatively small. The apparent profitability is said to be a direct consequence of upward trend in prices and strategy used for simulating transactions (confirmation days will frequently be days of large price change, and consequently of large overshoot). It remains to be proven whether these profits are a result of a random walk process. The 1% filter rules were the
21 Fama (1965) and Fama and Blume (1966) presented a detailed empirical analysis of filter rules and concluded that
such rules do not outperform the buy and hold strategy. In the absence of trading costs, very small filters (1% in Alexander [1964] and between 0,5% and 1,5% in Fama and Blume[1966]) do generate superior performance. These results are consistent with persistent or positive very short term price movements, consequence of serial correlation in the daily price. Small filters are transaction intensive, thus the huge number of transaction generated. As a result, they are very sensitive to transaction costs, as shown by Fama and Blume (1966) even a 0,1% transaction costs is sufficient to eliminate the entire profits.
most profitable of all. In this case the amount of transaction required, due to small filter used, eliminated all the profits, after accounting for commission. Apart from the commission issue there is another issue that as to due with the risk adjustment in what regards to this type of simulation. The criteria tend to pick stocks that are riskier than average. Meaning that after accounting for risk the result may not be as attractive as it was supposed to be. It should be pointed out that a buy and hold strategy would, always, be profitable as long as we are in the upward market trend. Thus, caution should be used in comparing filter rules with the buy and hold strategy.
Alexander came to the conclusion that trends per se do not explain the success of the filter rules. He studied the trended prices, though some were unprofitable and in general he found them to be more profitable. Thus, he concluded that data on S&P500 industrial is inconsistent with a process of random walk with drift. But he also conceded that the period of 1928-40 may have played an important role (economic crisis and Second World War)22.
The issues of independency of prices series have been the main concern for researcher and market professionals, and its degree varies accordingly. The minimum acceptable depends on whether we are referring to market professional or economists. For the latter, the main concern is whether the data is an adequate description of the reality, whilst for the former the main concern is whether past price can be used to obtain abnormal gains. For instance, a perfectly negative serial correlation may be of great importance to academics; however, for the investor it is only important if he/she can use this information to achieve abnormal returns after accounting for transaction costs.
Stock prices is an accumulation of randomly generated noises23, meaning the effect or actions of investors on given securities, not a result of any political or economic situation. This is a view not shared by most random walk theorists. Some people believe investors are motivated by psychological factors, others by the result of a company evaluation. These investors believe every security has an “intrinsic value”, true value. This is the equilibrium price that will determine their
22 Perhaps event study might shed some light on this issue. 23
action. And whenever there is disagreement or uncertainty on the part of investors about the intrinsic value there is “noise trading”. Disagreement among investors about given information does not imply inefficiency, unless there are investors who systematically make better use of the available information. The true value changes over time due to market, political and economic situation that might impact on a company’s future prospects. For Black (1986), sometimes investors trade on what they perceive as information, when in reality they are trading on noise. Although this trading is important to provide market liquidity it can also generate market bubbles24. Market bubbles is a phenomenon where noise traders herd25, it produces dependence in price series as the accumulation of the same type of noise causes the price level to run well above or bellow the “intrinsic value”. To Fama and French (1988a) this is not evidence of market anomaly, “…temporary swings do not necessarily mean rational bubbles…” rather it is a result of a combination of positive expected returns and temporarily high expected returns.
Once independency is attained, whatever the process, chart reading and stock market analysis are no longer profitable activities. However, Fama (1970) argues that there is still room for superior intrinsic value analyst, as there is always new information that changes the intrinsic value. If the information generating process is not independent then successive price change will exhibit dependency. Profit can be made as long as one can predict and assess the new information and act upon it.
Fama (1965) believes sophisticated traders may prevent certain market anomalies, such as bubbles, from happening. The assumption underlying this thought is that these traders recognise the true value of the stock price and in this situation they act in order to maximize their profits. In doing so, not only they ensure the independence of successive price change, but also profit in the process. It should be pointed out, however, that the sophisticated investor has no guarantee that his price assessment is the correct and as a result their actions are constrained. Their actions are also constrained by market frictions (commissions paid for transactions, etc.), thus diminishing their abilities to ensure price change independencies. Whenever there is price dependency there is opportunity for profit making. There is another aspect to this reasoning, that deserves our
24 For more detail see Kenneth D. West (1988), “Bubbles, Fads and Stock Price Volatility Tests: A Partial
Evaluation”; see Jeremy J. Sigel (2003) for a more detailed definition
25
attention and this is that the irrational traders sometimes take the upper hand, contrary to common belief that irrational traders loose money. Bradford and Delong (1988) assert that in a risk-averse world of investors the average rewards to risk takers exceed those of risk avoiders and the law of large numbers implies that risk takers as a whole do better than risk averters. Thus, irrationality may, actually, be rewarded in the aggregate.
Lo and Mackinlay (1988) decided to revisit the random walk theory with the firm belief that previous studies conducted by so many remarkable researchers supported this theory because they lacked the statistics robustness that would detect a small but important departure from randomness. To pursue their purpose they developed a test called variance ratio test (see 2.4.4 for more detail). The idea behind this logic lays on the fact that the random walk model’s assumption of incremental variance is a linear function of time, which is to say that rt + rt-1 is twice the
variance of rt. Or in other words, in a random walk model, the variance of the returns is
proportional to the time elapsed. They applied the test to the US market with the purpose of testing price dependence. The idea is to capture the mean reversion in data. A system is mean reverting if after successive upward change it is more likely to move downwards in the next observation than to continue upward, and vice versa. Lo and Mackinlay rejected the random walk model for the US market. They found weekly and monthly stock returns had positive autocorrelation coefficient contradicting the almost zero autocorrelation reported in early efficient markets literature and the prediction of approximately zero autocorrelation from mean reverting models.
Chapter 2
2
Market Efficiency
Following all these studies it became apparent that stock market prices are predictable to a certain degree. What seemed to be a data anomaly was in fact the answer to the question of the predictability of stock markets.
The question posed then changed slightly, from market predictability to profitability. Is the predictability of stock market prices economically significant, that is, profitable? Can professional investors beat the market after accounting for commissions (market frictions)? These are questions that interest both academics and professional investors alike. For academics it is an interesting question because it tests whether the markets are efficient in what concerns the pricing of securities. For professional investors, the answer to this question may allow them to devise strategies in order to take advantage of the temporary market inefficiency to make profit, and at the same time drive prices to their true value.
As mentioned earlier, the reason for so many studies on random walk is because not only were there misunderstandings on the meaning of stock market predictability and random walk, but also on the relationship between random walk and market efficiency. For some, the rejection of random walk means investors are irrational, “...guided by animal spirit…”26 or that there is endless opportunity for profits. This collides with the beliefs held by some academics who sustain that markets are perfect. The idea of perfect market has been put forward by Roberts (1959) and then by Samuelson (1965)27. According to Samuelson, “in a competitive market there is a buyer for every seller”. If one could be sure that a price will rise, it would already have risen”28. This assertion bears one of the basic principles of market efficiency, prices incorporate expectation and information and competition amongst investors is the source of market efficiency.
26 Keynes (1936)
27
Samuelson (1965) and later Mandelbrot (1966) managed to connect the concept of fair game expected returns and random walk
28 This gave rise to anecdote of two economists walking down Wall Street when one says to the other “look there is a
According to Lo and Mackinlay29, Leroy (1973) and Lucas (1978) have demonstrated that in a risk averse world30 investors “might gladly pay to avoid holding any unforecastable returns”. As a result, a knowledge of the risk associated with current information implies some understanding of the level of expected returns. That is, the efficient market hypothesis might hold, while random walk might not. Grossman and Stiglitz (1980) go even further, sustaining that investors31 will only spend time and resource in analysing and uncovering information if that activity is likely to generate profits. In a perfectly informationally efficient market, the return for collecting and treating information would be zero, which means there would be no reason to trade. This would eventually lead to market collapse. In light of this way of thinking it is understandable that market efficiency varies across markets and regions. Emerging markets are less analised than developed markets, thus less efficiently priced. The same argument is valid for small stocks compared with large stocks. This, however, is contrary to the belief held by professional academics that regard market analysis as a useless activity, for markets are efficient. What does market efficiency mean, after all?
2.1
Efficient Capital Market
According to Fama(1970), efficient capital market means prices fully reflect all available information, and so trading based on information cannot provide abnormal return. The necessary conditions for this to be true would be a frictionless capital market, no trading costs and information acquisition zero32. However, in reality, certain information may affect stock market prices more quickly than other information. With this in mind Fama (1970) presented us with the categorisation suggested by Roberts (1967). According to Roberts there are 3 forms/degrees of market efficiency in what regards to information:
29
A Non Random Walk Down Wall Street
30 For a risk averse investor it is preferable to have €1 certain in the future, than the uncertainty of the possibility of
€2 or €0, with equal probability.
31 According to them there are two type of investors: the informed investor and non-informed investor 32
2.1.1 Weak form hypothesis
In its essence means that one cannot use historical prices to predict future prices, or in other words, prices fully reflect all available information implicit in the past prices. This is to say stock prices analysis is a pointless activity.
2.1.2 Semi-strong form hypothesis
Means stock prices reflect all publicly available information. For instance, after earnings announcements market professionals reassess the value of their assets in line with the new information, bearing in mind the possibility of making either profit or preventing losses. It is clear that the main concern on this issue is on the speed with which information is incorporated in the stock market prices. If returns are not predictable from past returns, it simply means that information is incorporated in stock prices at such a speed that professional investors cannot profit from it. They may perceive the changes, but these are already expressed on the prices, thus failing to act on time to make abnormal returns33.
2.1.3 Strong form hypothesis
Strong form hypothesis is more restrictive than the previous two, maintaining that all information, public or private, is incorporated in the current stock prices. No investor can make abnormal returns. The belief is that there is no one investor with superior information or ability. No one can beat the market all the time. It fails to account for the insider trading, though.
Later, in 1991, Fama reviewed these classifications to encompass not only a more general meaning, but also to account for the criticism made to the previous classification. One of which is the cost of information not being zero34. In this new classification he favoured Jensen’s (1978) approach in that “…prices reflect information to the point where the marginal benefits of acting on information do not exceed the marginal costs”. He reclassified the weak form efficiency in the new, more general category tests for return predictability. The semi strong form efficiency on the more general category of the event studies or studies of announcements. The strong form
33 The same idea was expressed by Samuelson (1965) 34
efficiency to the more general category tests for private information trading35. To test for the strong form efficiency a group of investors, mainly mutual fund managers, are used to access portfolio’s performance36. Malkiel (1992) expanded Fama’s definition to comprise the effect of information release in the price of the security (if there is no change then the market is efficient) and also to include the evaluation of trading based on information.
The concept of efficient market hypothesis has significant implications for market analysis. For, if stock market prices cannot truly be predicted, then there is no purpose in studying past stock market prices trying to find superior information that can be used in trading strategy. Any trading rules based on these principles are simple a mumbo jumbo strategy that can only be profitable by sheer luck, from which follows that technical analysis is useless.
2.2
Implications of the Efficient Market Hypothesis (EMH) for Investment
Policy
Considering that some researches had already rejected the random hypothesis37 in the past, it comes as no surprise that Lo and Mackinlay’s 38 rejected random walk in the US market. For them “…equity returns suggest presence of predictable components in stock market…”, adding that through active management, superior long term investment returns can be attained.
2.3
Technical and Fundamental Analysis
There are two main schools of professional analysts that agree with Lo and Mackinlay’s view. These are professionals that believe there are trends in stock markets. For these professionals there are facts underlying the price formation, these facts are knowable today; they affect future
35 Studies of the insider trading are both a study of the quality of the insider’s information as well as of the SEC’s
regulation. Insiders are individuals with privileged information about company prospects, managers, stock holders and most of the studies revealed that insider traders gain excess returns. The question is whether these results are consequence of the superior ability or the privileged information, according to Damodaran and Liu (1993). The latter seem to be the reason as many of those who traded and made abnormal return have ended up in prisons.
36 Cowles (1933) conducted one of the first studies on the subject
37 Osborne(1962), Cootner (1962) Neiderhoffer and Osborne(1966) in Lo and Mackinlay’s Non A Random Walk
Down Wall Street
38
prices and can lead to profit if properly understood. The way to find these differs for the Fundamentalists and Technicians.
The Fundamentalist approach is to study external factors behind price changes. In the commodities market, he studies the demand and supply for those commodities. In the stock market, he studies the general business conditions and profit prospects for various industries, earnings and dividends, prospects of the firm, expectations of interest rates, and risk evaluation of the firm to determine the proper stock prices.
The Technician sometimes called chartist, though he subscribes Fundamentalists’ basic assumptions, he also argues that the patterns underlying the price formation are reflected in the stock prices. Thus, what is needed is a study of the price movements in the recent past, in order to uncover the signs on the direction of future price movements. He believes that a movement once initiated tends to persist and opposes the idea that the best estimate of the tomorrow’s price is through coin tossing. This, however, is exactly what Academics and researchers of speculative markets defend. They argue against price trend in a speculative market, since to academics the apparent trends are a mere interpretation of a random walk process.
Technical analysts use a wide range of techniques39, but only some of them will be mentioned here. Those are: Moving Average; Relative Strength; Resistance Levels or Support Levels; and Volume Trading. The first two will be dealt with in detail.
2.3.1 Moving Averages
The Moving Averages are highly used by technicians because they are easy to implement and effective. They are used to measure momentum as well as support and resistance level. The idea of Moving Averages is to capture market trends in advance. Use a long moving average to capture the general tendency and a short range moving average to establish when to act.
39
One of the most famous technical analysis theories is the Dow Theory, named after Charles Dow, whose purpose was to identify the long term trends in stock market prices.
The Simple Moving Average (SMA) is actually an arithmetic mean. It involves adding the prices for a number of periods and dividing by the number of periods (e.g. (X1+X2+X3…..+Xn/n)40. The
concern with simple moving average is that it gives the same weight to all observations being considered. In other to accommodate this criticism, a weighted moving average and/or exponential moving average is used. These two techniques give different weights to recent and old observations.
The Weighted Moving Average (WMA) gives each period a weight according to it’s “age”. The oldest observation is given the weight of 1, the second oldest the weight of 2, and the weight is increased by 1 until the current period is assigned a weight, and are then divided by the sum of multipliers (e.g. (1*X1+2*X2+3*X3+…Xn*n)/(1+2+3+…n).
The Exponential Moving Average (EMA) is used to address the shortcomings of both the SMA and the WMA, including the data number of the period covered by the moving average. EMA gives much more weight to recent observations and ever decreasing weights (lesser importance) to old observations. However, the older observation never disappears, it remains part of the calculation. EMA reacts faster to recent price changes than the simple moving average.
Gama Gonçalves41, used Moving Averages in his thesis to test for the market efficiency in Portuguese stock market indexes. He studied the BVL (1989-1996) and PSI20 (1993-1996) and found the 1-50 day to be profitable, which is superior to the buy and hold strategy. In order to give power to this finding, Gama Gonçalves then conducted a statistical test in order to assert the significance of results obtained through simulation. The test confirmed the simulation results were statistically significant, however caution should be used when analysing transaction rules strategies. As pointed out by many of Alexander’s critics, the use of the closing price can bias the profitability of the trading strategy in the upward direction, as has also been confirmed by Amiud and Mendelson (1987b), for the transaction may not occur at the estimated closing price. Another issue which arises from using stock market indexes: the revision of these stock market indexes. Also to be considered is the effect of dividend on transaction rules. Crato and Lopes (1989, in
40 The general idea is that we are in the presence of a Bullish market if the 200 days moving average is bellow the
S&P500 index, and we are in the presence of a Bearish market in the opposite case.
41
Gama Gonçalves) pointed out market microstructure issue that has to do with the short sales. Gama Gonçalves rejected the efficiency for Portuguese stock market, this is consistent with the conclusions by Crato e Lopes (1989) and Borges (1994).
According to Brock et al.(1992) for US and Hudson et al. (1996) for UK, Moving Average shows predictive power for long time horizon. For Hudson, though this result is encouraging in the sense that they have some predictive power, they are not enough to generate abnormal return in a frictionless stock market.
2.3.2 Relative Strength
Relative strength is a strategy that helps select stocks based on their past performance. Contrary to the timing strategy this is a stock selection strategy. The principle behind it is that the past price helps predict today’s prices. So, the average daily (weekly) past prices are used to compare with today’s prices, if greater than X% buy if bellow K% sell. This strategy tends to include securities with higher risk as they are securities with high variability of returns42. These, according to some, tend to be non profitable after accounting for risk and commissions.
Jensen and Bennington (1970) studied the relative strength strategy. Their idea was to develop a high performance portfolio. The result produced a 12,5% returns, higher than the Buy and Hold Strategy. After accounting for transaction costs, the performance was reduced to the same level of performance as the Buy and Hold Strategy. And once the risk is accounted for in the performance of the Relative Strength strategy, it shows to be bellow the Buy and Hold Strategy. These findings led them to conclude that NYSE index behaviour between 1931 and 1965 is consistent with the Efficiency Market Hypothesis.
It should be noted, though, that EMH implies that technical/fundamental analysis is fruitless and predicts failure for both strategies already mentioned. The driving force behind it would be the competition among market professionals, which would make it fruitless. Only analyst with unique insight will be rewarded. The secret lies not in identifying a good company, but on having
42
a better than everyone else’s estimate. Similarly, identify the company that is not as bad as their stock price suggests.
Historically, technical analysis has been viewed with suspicion by academics in finance, more as a “…..pursuit that lies between astrology and voodoo”43. It never enjoyed the same level of acceptance as fundamental analysis.
The reasons for this can be traced to the terms used by one and the other. Whilst fundamental analysts uses words such as earnings, dividends, other balance sheets and income statement items familiar to economists, technical analysts use a different set of vocabulary completely unknown to economists and the public. However, as of late this has been changing, the line that separates technical analysts and fundamentalists is waning, for both of them now use the other’s traditional instruments to forecast future prices. The level of acceptance of technical analysis is still low compared with fundamental analysis.
2.4
Test of Predictability in Stock Market Returns
Short term predictability tests whether yesterday’s returns can be used to predict today’s returns. Earlier tests of EMH were tests of weak form efficiency. The question they were trying to answer was: could speculators find trends44 in stock market prices and devise a strategy that would enable them to make abnormal returns? This is purely technical analysis.
It was believed then that one way to uncover trends in stock market prices is through the measurement of serial correlation of stock market returns. Serial correlation refers to the tendency for stock returns to be related to past stock returns. A correlation test is of the kind: rt =a+brt-1-T+еt (6),
where a measures the expected return, b the relationships between previous return and current, and еt incorporates variability of returns not related to previous return. The goal is to establish the
43 Lo and Mackinlay’s Random Walk Down Wall Street
44
linear relationship between today’s returns and yesterday’s returns. Correlation tests are merely a fitting equation to a set of data. The purpose is to check whether what is provided by the data is what is expected by the model, they are highly sensitive to extremely large observations. Positive serial correlation (see point 2.5 for more details) signifies that positive return tends to be followed by positive return, creating what is know as momentum property. Negative serial correlation means that positive returns tend to followed by negative returns, reversal or correction type property. Kendall (1953) found positive serial correlation for daily data of UK stock companies. Cootner (1962) found negative serial correlation for weekly data. Both Conrad and Kauls (1988) and Lo and Mackinlay (1988) studied weekly NYSE returns and discovered positive serial correlation over short horizons. However, they pointed out that the magnitude of the trends is too small to generate abnormal return.
2.4.1.1
Results on Very Short Term Horizons Study
Very short horizons studies suggest momentum in stock market prices, but of small magnitude to be profitable. However, in studies of intermediate horizons on stock price behaviour (3-12 months), Jegadeesh and Titman (1993) found that stock market prices exhibit momentum in which good or bad recent performance continues.
2.4.1.2
Results on Long Term Horizons Study
Contrary to the findings of studies focused on short horizons, long horizons returns studies suggest a negative serial correlation of stock market prices. Indicating there is reversal in stock market prices. This gave rise to the “fads” hypothesis45, which asserts that stock market prices overreact to relevant news. This overreaction leads to momentum in a short horizon. However, a correction or reversal of the overreaction leads to a poor performance in the long horizon. DeBondt and Thaler (1985) documented return reversal in the long term horizon (3 to 5 years): past losers outperform past winners. For them this is evidence of excessive pessimism following poor performance, making the loser firm a profitable investment. Ball, Kothari and Shanken (1995) follow a different path for explaining the phenomenon, to them poor stock returns performance leads to higher leverage, because the value of stock falls more than the value of the
45
firm’s debt. The increase in leverage leads to higher risk which in turn leads to higher expected returns than would be reflected in risk estimate from a period before the drop. For others, this is due to a different set of information used by market professionals when assessing the short or long term perspective of a company, thus the seemingly different result. Fama and French (1988a) also found negative serial correlation though they argue that once the 1926-1948 period is removed there is no evidence of negative serial correlation.
2.4.2 Non Parametric Tests
These tests are the firsts to be designed to detect autocorrelation and dependencies in the data. One needs to have in mind that these tests are not powerful. As such, there is a certain tradeoff between the test results and the lost of information.
2.4.2.1 Sequences and Reversals
Proposed by Cowles and Jones (1937), the comparison of sequences and reversals in historical stock returns was similar to the coin tossing probabilities of Bernoulli. Sequences are pairs of consecutive returns with the same sign, and the reversals are pairs of consecutive returns with opposite sign. In a fair coin tossing the sequences over reversals would equal 1. However, in a random walk one with a drift the process is biased toward sequences over reversals, meaning that a sequence over reversals would be greater than one. In this case it is difficult to judge whether a random walk one has been violated46.
2.4.2.2 Run Test
This is an easy to design test, that it basically examines the sign of price changes. Contrary to the correlation test, the run test is scale free and, as such, not sensitive to large values. A Run is a number of sequences of consecutive positive and negative returns, or runs, which is tabulated and compared against its sampling distribution under the random walk hypothesis47.
46 See Fama, 1965 andCampbell et al.(1997), for further discussions. 47
Fama (1966), tested the runs and sequence over reversals and both conformed with what was expected. Run tests and sequencies/reversals are fitting tests. This involves comparing the result with what would be expected under assumption of random walks. Once the sample conforms to the expected, the random walks is considered upheld. Cautions should be used when analysing both run tests and serial correlation tests, for both are tests of linear relationships, meaning they may not capture some more complicated hidden patterns. In this situation it is assumed that no trading rule will be profitable. With this in mind, we will now consider a test design to uncover trends in stock markets: the filter rule.
2.4.3 Filter Rules
To test for Random Walk, Alexander (1961, 1964) used filter rules in which an asset price is purchased when its price increases x%, and sold when its price drops by x%. This is a market timing strategy, that is, they indicate when to take a short/long position making it easier to implement and assess strategies (total return being the metric of success). As mentioned previously (see point 1.3 Page 10) the idea behind these filter rules is that the trends existing in a stock market can be revealed once small movements are filtered out. This dynamic portfolio strategy is taken to measure the predictability of asset returns. A comparison with the Dow Jones and S&P’s industrial averages led Alexander to conclude that “….there are trends in stock market prices…”.
Although many studies supported the idea of IID of random walks, it should be noted that all these tests only capture the linear dependence (checking correlation coefficient not statistically different from zero is not sufficient). In other words, a process may be considered IID, when in fact it is not. It may not be found any linear dependence, but the underlining process may be generated by a chaotic process or an ARCH type process. In this case the efficiency hypothesis may be questioned if in presence of a chaotic process as the ARCH type process admits dependence in variance (this is in line with the Martingale model48).
48 Curto, Esperança e Reis, “ Testes à Forma Fraca de Eficiência dos Mercados: Aplicação dos Índices PSI20, DAX
2.4.4 Variance Ratio Test49
An important assumption of all three random walk models, mentioned in the beginning of this thesis (see point 1.2.1, 1.2.2 and 1.2.3 ), is that the variance of random walk increments must be a linear function of the time interval. That is, the variance rt + rt-1 is twice the variance of rt. Thus,
the variance tests the relation between: VR(2) = Var[rt+rt-1]/ 2Var[rt] = 150 (7);
Positively autocorrelated returns means VR(2) will exceed 1. The opposite is true in the presence of negative first-order autocorrelation.
French and Roll (1986) used this test to study the effect of noise trading. They rejected the market efficiency-constant expected returns model. Lo and Mackinlay, in the study mentioned earlier, used this test to reject the random model for the US market. However, Fama and French (1988a) argue that the variance test for the long horizon provides weak statistical evidence against random walks. Under random walks, the variance ratio should equal unity, however Poterba and Summers (1988) showed that variance ratio declined with time, indicating presence of a mean reverting component. The presence of a mean reverting component in stock prices implies a substantial forecastability of intermediate returns, and therefore substantial differences between price and fundamentals.
Most of the studies discussed here are tests designed to detect a linear structure in financial data. But it is important to stress that finding no linear dependence does not imply absence of a nonlinear dependence. As Campbell et al. (1997) argued “….many aspects of economic behaviour may not be linear and ... the process by which information is incorporated into security prices are all inherently nonlinear.” The presence of non linear dependence per se implies that markets are not efficient in a weak form51. That is, if there is no second order dependence. Brock,
49
This part of the present work was strongly infuenced by Campbel, Lo and Mackinlay’s “The Econoemetrics of Financial Marktes”
50 See Campbell et al. (1997), for further discussions.
51 Curto et al. (2003); Afonso, A. and J. Teixeira (1998), Non-linear Tests Of Weekly Efficient Markets: Evidence