0
FEBS 1988Assignment of individual heme EPR signals
of Desulfovibvio bacalatus (strain 9974) tetraheme cytochrome c3
A redox equilibria study
Isabel MOURA', Miguel TEIXEIRA', Boi H. HUYNH', Jean LeGALL3 and Jos6 J. G. MOURA'
'
Centro de Quimica Estrutural, Complexo I, UNL, Lisboa Department of Physics, Emory University, Atlanta, GADepartment of Biochemistry, University of Georgia, Athens, GA (Received March 7/May 25, 1988) - EJB 88 0294
An EPR redox titration was performed on the tetraheme cytochrome c3 isolated from Desuljovibrio baculatus (strain 9974), a sulfate-reducer. Using spectral differences at different poised redox states of the protein, it was possible to individualize the EPR g-values of each of the four hemes and also to determine the mid-point redox potentials of each individual heme: heme 4 ( - 70 mV) at g,,, = 2.93, gmed = 2.26 and gmin = 1.51 ; heme 3 (-280 m v ) at g,,, = 3.41 ; heme 2 ( - 300 m v ) at g,,, = 3.05, gmed = 2.24 and gmin = 1.34; and heme 1 (-355 mV) at g,, = 3.18. A previously described multi-redox equilibria model used for the interpretation of NMR data of
D.
gigas cytochrome c3 [Santos, H., Moura, J. J. G., Moura, I., LeGall, J. & Xavier, A. V. (1984)Eur. J . Biochem. 141, 283 -2961 is discussed in terms of the EPR results.
Low-potential tetraheme cytochromes c3 (molecular mass circa 13 kDa) are found in sulfate-reducing bacteria belonging to the genus Desuljovibrio [I]. They have been indicated as playing a role in electron transfer linked to energy-yielding processes, namely hydrogen production/consumption via the hydrogenase enzyme, but at the present moment their physio- logical role is still controversial.
Each heme in this class of cytochromes is bound to the protein polypeptide chain by two thioether linkages involving cysteine residues and the fifth and sixth heme-iron ligands are histidinyl residues.
Structural studies by X-ray crystallography have been re- ported for cytochrome c3 isolated from D . vulgaris (strain Myazaki) [2] and D . baculatus (strain Norway 4) [3] (pre- viously known as D . desuljuricans strain Norway 4). The four hemes are localized in non-equivalent protein environments and each heme has a negative and a different mid-point redox potential. The small size of the protein and the high number of heme groups present suggested the existence of heme-heme interactions. The cytochrome c3 was described as a protein containing interacting redox centers by the NMR study of the redox equilibria in
D.
vulgaris (strain Hildenborough) and D .gigas cytochrome c3 [4 - 61.
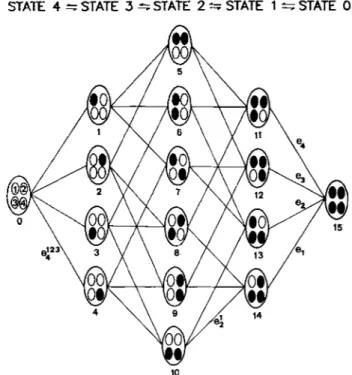
In principle, the non-equivalent four-redox-center mol- ecule can have 16 redox states in a multi-redox electron distri- bution equilibria [5] (Fig. 1). Furthermore, the redox proper- ties of each center may be affected by the redox states of the adjacent centers due to heme-heme interactions. Thus, a complete characterization of each individual center in such a complex system requires a large number of parameters and may be difficult to perform. However specialized spectro- scopic techniques, namely NMR and EPR, have been used to probe each heme individually and to provide valuable infor- mation concerning the interplay between the redox centers. The proton-NMR spectra of the tetraheme cytochrome c3
Correspondence to J. J. G. Moura, Centro de Quimica Estrutural Complexo I, UNL, Avenida Rovisco Pais, P-1000 Lisboa, Portugal
from D . gigas were examined while varying the pH and the redox potential [5]. The analysis of the NMR data was based on a model that takes into consideration all the redox species present in the solution and showed that heme-heme interac-
STATE 4 =STATE 3 =STATE 2 z S T A T E 1 =STATE 0
W
10
Fig. 1 . Schematic representation of the multiredox equilibria in terraheme cytochrome c3. Definition of the redox states and micro (eJ redox potentials involved (adapted from [5]). Microscopic mid-point potentials (ei,
4,
elk,
4" where i , j , k, I = 1, 2, 3 and 4, heme 1 being the most negative) can be defined by 32 Nernst equilibria between each pair of states. As an example, e: is defined as the mid-point potential of heme 2 when heme 1 is oxidized and hemes 3 and 4 (unspecified) are reduced366
tions resulted in a change of redox properties in a range between - 50 mV and
+
60 mV. The heme mid-point redox potentials as well as the interacting potentials were shown to be pH-dependent.EPR potentiometric titrations have also been performed in tetraheme cytochromes c3 [7 - 111. Although the experimental data were poorly resolved in the low-field region (g,,J, tenta- tive asignments have been made and the values of four mid- point redox potentials for the heme groups have been deter- mined using four independent Nernst equations.
In a recent paper Gayda et al. i l l ] have shown that the redox potentials previously determined for the tetraheme cytochrome c3 isolated from D. baculatus (strain Norway 4) [9] were not correctly determined due to a wrong attribution of the EPR signals. By accounting for the total intensity of the EPR spectra the four macroscopic redox potentials of the tetraheme cytochrome c3 from D. baculatus (strain Norway 4) were determined to be - 150 mV, -270 mV, -325 mV and -355 mV [Ill.
In this article we report an EPR redox titration on the cytochrome c3 from D. baculatus (strain 9974). Using the
method of differential spectroscopy, we were able to resolve and assign the four g,,, resonances to the four heme groups, and determine the four corresponding redox potentials with one being a true microscopic value.
MATERIALS AND METHODS
Cytochrome c3 was isolated from D. buculatus (strain 9974) and purified as previously described [12].
Anaerobic oxidation-reduction titration of the cyto- chrome c3 was carried out as detailed in [13]. The cytochrome c j solution (830 pM in 0.1 M Tris/HCl at pH 8.1) was poised at different potentials in the presence of oxidation-reduction mediators, all at 10 pM and at 25°C. The mediators used were phenosafranine, benzylviologen, methylviologen and 2- hydroxy-( 1,4)-napthoquinone. The potential was adjusted by addition of small amounts of dithionite or ferricyanide solu- tions. After equilibration at a fixed potential, a sample was transferred into an EPR tube under argon and immediately frozen at 77K for posterior EPR quantification. All redox potentials are quoted versus a normal hydrogen electrode (NHE).
EPR spectra were recorded in a Bruker ER-200 tt equipped with an Aspect computer and an Oxford Instru- ments continous-flow cryostat.
RESULTS AND DISCUSSION
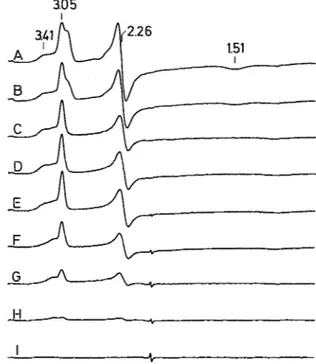
In Fig. 2 we present the EPR spectra obtained for cytochrome c3 from D. baculatus (strain 9974) poised at differ-
ent redox potentials. The spectrum of the native cytochrome is similar to that previously published and described [9]. In the early stages of the redox titration, the intensity of the shoulder at g M 2.9 decreases with the lowering of the poten- tial and is no longer observed at -201 mV.
The EPR spectrum of the heme with the highest redox potential (heme 4) can be easily obtained (g,,, = 2.93, g m e d =
2.26, gmin = 1.51; Fig. 3D) by taking the difference between the spectra of the native sample (+200 mV) and the sample at -157 mV.
By sequential differences using the oxidized spectrum (+ 200 mV) as reference, the intensity of the EPR signals due to heme 4 can be measured as a function of the redox potential.
3.0 5
J-I
-
I 1
"
Fig. 2. EPR redox titration of D. baculatus (strain 9974) tetraheme cytochrome c3. Selected EPR spectra are shown for samples at the following poised redox potentials: (A) +200 mV, (B) -46 mV, (C) -91 mV, (D) -134mV, (E) -201 mV, (F) -291 mV, (G) -320 mV, (H) -366 mV, (I) -466 mV. EPR experimental condi- tions: microwave power 0.1 mW, temperature 10 K, modulation amplitude 1 .O mT, sweep time 500 s, protein concentration 830 pM
3.J
3
I1.34
Fig. 3. EPR spectral d$ferences obtained at chosen redox potentials in order to assign spectral components. Experimental data was ob- tained as indicated in Fig. 2. (A) EPR spectrum of D. baculatus cyto- chrome c3 at - 157 mV (not shown in Fig. 2). (B) Difference spectrum obtained from spectra of samples poised at - 157 mV and the differ- ence spectra obtained as indicated in C (this last component was multiplied by a factor 1.7). (C) Difference spectrum obtained from spectra of samples poised at -157 mV and at -291 mV (spectrum F, Fig. 2). (D) Difference spectra obtained from spectra of samples poised at
+
200 mV and at - 157 mV120 I
, ,
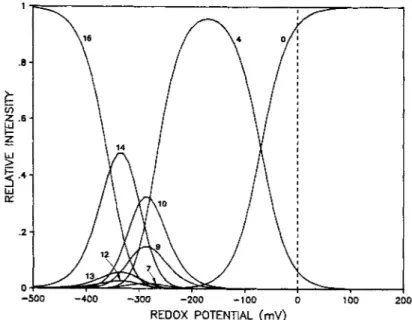
-500 -400 -300 -200 -100 0 100 1 REDOX POTENTIAL (mV) I )OFig. 4. E P R intensity of each individual component measured from the experimental redox data shown in Fig. 2 and manipulated by spectral differences as indicated in Fig. 3. Heme 4 (0, g,,, = 2.93 a n d o , gmed = 2.26); heme 3 ( # , g,,, = 3.41); heme 2 ( x , g,,, = 3.05 and V, gmed = 2.24); heme 1 (El, g,,, = 3.18). The theoretical curves were calculated from the model described in the text, without considering interacting potentials and using the following mid-point redox potential values -355 mV, -300 mV, -280 mV and -70 mV (equivalent to considering four independent Nernst equations with n = 1 )
0
REDOX POTENTIAL (mV)
Fig. 5. Population distribution curves f o r the contributing oxidation states assuming a non-interacting model and jbur different mid-point redox potentials (see caption Fig. 4 )
The spectrum obtained at - 157 mV was then used as
a new reference, since at this potential cytochrome c j only contains three oxidized hemes, hemes 3, 2 and 1 (Fig. 3A) and spectral differences enables us to follow the reduction of hemes 3 and 2. The g,,, value of heme 3 is clearly identified at 3.41 and heme 2 has g,,, = 3.05, gmed = 2.24 and gmin =
1.34. The reduction of heme 1 (gz = 3.18) can be followed by an identical method using the EPR spectrum of the sample at - 291 mV as reference. Using the described procedure the intensity of the signals for each individual heme can be fol- lowed during the complete EPR redox titration.
In Fig. 4 the intensities of each heme are plotted against the poised solution redox potential.
Previously, we have successfully applied a model for the electron distribution in a tetraheme cytochrome [5]. In this
model, 16 redox species are assumed to be interconvertable during the oxidation-reduction process and four macroscopic reduction steps are considered which correspond to the suc- cessive entry of one electron (on going from fully oxidized to fully reduced states) (Fig. 1).
Using this model it is possible to calculate the 16
P,
popu- lations as a function of the solution redox potential, E, if the absolute values of four microscopic redox potentials and six interacting potentials are known. The equations were fully developed in Appendix A of [ 5 ] . The use of these equations for the EPR data analysis can then be easily adapted. The alteration of the magnetic properties of the hemes upon re- duction, going from a paramagnetic EPR-active state (S =1/2) to a diamagnetic EPR-silent state (S = 0 ) , implies that the spectral intensities observed (INT) must be the result of
368
the sum of populations of the species containing the oxidized hemes, which can be calculated as follows:
INT (heme 4) INT (heme 3) INT (heme 2) INT (heme 1 ) = PO
+
p1+
p2+
p3+
P5
+
P6+
p8+
PI1 - - Po+
Pi+
P2+
P4+
P5+
P7+
Pg+
Pi2 = Po+
Pi+
P3+
P4+
P6+
P7+
Pi0+
P i 3 = Po+
P2+
P3+
P4+
Ps+
P9+
Pi0+
PI4These intensities can then be computed using a simple computer program that takes into consideration the ten de- scribed parameters (four microscopic redox potential and six interacting potentials) and the experimental data are visually fitted with the theoretical curves.
A complete fitting of the experimental data can only be made by choosing a set of microscopic potentials (ei”) and interacting potentials ( I i j ) that can be adjusted to the exper- imental points. In the case under study, the three interacting potentials ZZ4, 1 3 4 and Z14 cannot be estimated, since heme 4 has a very high and different mid-point redox potential and is completely reduced prior to the reduction of hemes 3, 2 and 1. The microscopic redox potential measured for heme 4 represents a value of e i 2 3 which by definition is the micro- scopic mid-point potential of heme 4 when hemes 3, 2 and 1 are oxidized.
A survey of the relative values of the fractional popu- lations as a function of solution redox potential, using the estimated values for a non-interacting model (Fig. 5 ) indicates that redox species 1, 2, 3, 5 , 6, 8 and 11 are negligeable. The multi-redox equilibria between the different oxidation states can then be simplified and described schematically as follows :
and the equations used for computation of the EPR signal intensities can be simplified as:
INT (heme 4) z Po
INT (heme 3) z Po
+
P4+
P7+
P9+
P12INT (heme 2)
=
Po+
P4+
P7+
Pi0+
P13 INT (heme 1) z Po+
P4+
P9+
Pi0+
Pi4In principle a curve-fitting program could be used in a convergent way in order to estimate the values of the in- teracting potentials that can best adjust to the experimental data from each set of values of el, e2 and e3 previously im- posed.
At the present moment however we refrain from pre- senting such an analysis, since the dispersion obtained with our experimental data can not give an ’unambiguous fitting. The experimental titration curves of each individual heme were then fitted with one-electron reduction theoretical curves deduced from a non-interacting model, using the following values: heme 1 (-355 mV), heme 2 (-300 mV), heme 3 ( - 280 mV) and heme 4 (- 70 mV) (Fig. 4).
The mid-point redox potentials determined for D.
haculutus (strain 9974) cytochrome c3 reveal that one of the hemes has a very high and different value ( - 70 mV) com-
Table 1 . Heme assignment in D. baculatus tetraheme cytochrome c3 The hemes of D . baculatus (strain 9974) are numbered according to their mid-point redox potential Em measured versus a normal hydro-
gen electrode (this work). Hemes have been assigned according to X-
ray structural data and EPR information alone (a), plus chemical modification [18] (b) and plus degree of exposure to solvent [3] (c)
Heme g m a x E m Assigment of hemes according to
number (a) (b) (c) mV 1 3.18 -355 11 or IV I1 or IV 11 or I V 2 3.05 -300 I or 111 111 I 3 3.41 -280 I V o r I I IV or11 IVor I1 4 2.93 - 70 111 or I I 111
pared with the other three. A high and well separated mid- point redox potential was also found for one of the hemes in
D . haculatus (strain Norway 4) cytochrome c3 ( - 150 mV) [ l l ] and for the Desuljohulbus elongatus cytochrome C3
(-30 mV) [14]. These observations, however, are not gener- ally observed for this class of proteins. D. vulgaris (Myazaki) cytochrome c3 has a narrow span of mid-point redox potential values (-230, -300, -310 and -360 mV) [lo].
Another important result of the EPR analysis presented in this paper is the possibility of determining the g,,, value of the individual hemes. EPR, Mossbauer and structural studies of a series of well defined low-spin model compounds have provided conclusive evidence that the so-called ‘strong-g,,,’ EPR signals (g,,, larger than 3.0) can be correlated with axial ligand symmetry and, in the case of planar axial ligands, a ‘strong-gmax’ signal represents a perpendicular alignment of the ligand planes [15-171. In the cytochrome c3 from D.
buculutus (strain 9974) two hemes were identified to have g,,,
values higher than 3.0 (heme 1 and heme 3), suggesting that the three-dimensional structure of this cytochrome should have two hemes where the histidinyl ligands are not coplanar. As has been pointed out, a close similarity exists between this cytochrome c3 and that isolated from D. baculatus (strain Norway 4) [12]; they are the two proteins belonging to this homologous class of cytochromes for which close analogies are found [15]. Consequently it is reasonable to assume that their tertiary structures are also similar.
Using the available X-ray coordinates (Brookhaven Data Bank) for cytochrome c3 from D. baculatus (Norway 4) and a Molecular Graphic Model (in colabordtion with Drs J. Wampler and D. E. Stewart, Department of Biochemistry, University of Georgia at Atlanta), analysis of the histidinyl heme ligands reveals that two of the hemes have their two axial ligands in a non-coplanar arrangement [3]. This analysis and the EPR results suggest a structural assignment for D.
buculutus (strain 9974) hemes 1 and 3 to hemes
I1 and
IV, namely, they are the two hemes with non-coplanar ligand arrangement’.
It was previously proposed by Haser et al. [3] that the heme with the highest redox potential should be heme 111 due to its lower degree of exposure to the solvent. This proposal does not agree with the heme assignment made by Dolla et al. which indicates that heme 1 has the highest redox potential The roman numbers presented in the text for numbering the hemes are the ones used in the X-ray structure description [3]. The cardinal numbers used in this article are in accordance with the redox potential, heme 4 having the highest redox potential heme, as already numbered in our previous paper [5].
value [I 81. These authors chemically reacted the arginine resi- due 73 with cyclo-hexane-l,2-dione and studied the redox properties of the modified D. buculutus (Norway 4) cyto- chrome c 3 . Electrochemistry and molecular modeling indi- cated that heme I [3] (referred as heme 4 in [18], since in their paper hemes were numbered sequentially from the amino- terminus) was the closest to the single modified residue and corresponded to the heme group whose redox properties are the most affected after chemical modification. However, struc- tural identity of both native and modified cytochromes re- mains to be demonstrated.
At the present moment we have no solid ground for a definitive assignment, as seen in Table 1 summarizing the results obtained, correlating the mid-point redox potential values with the EPR g-values (this work) and the X-ray struc- tural assignments [3] and the chemical modification data [18]. Putting together the available information, the identification of heme I/heme I11 and heme II/heme IV, in correlation to mid-point redox potential and EPR g-values is still ambigu- ous.
This research was supported by grants from Instituto Nacional de Investiga@o Cientifica, Junta Nacionul de InvestigapTo Cientifica e Tecnoldgica and from NATO (to J.J.G.M.), the National Science Foundation (to J.LeG.) and National Institutes of Health (grant G M 32187 to B.H.H.). We thank Dr G . Fauque for valuable discussions.
REFERENCES
1. LeGall, J. & Fauque, G. (1988) in Biology ofanaerobic organisms in Environmental microbiology of anaerobes (Zehnder, A. J. B., ed.) Chapter 1 1 , in the press.
2. Higushi, Y., Kusanaki, M., Yasuoka, N., Kakuko, M. & Yagi, T. (1981) J . Biochem. (Tokyo) 90, 1715-1723.
3. Haser, R., Pierrot, M., Frey, M., Payan, F., Astier, J. P., Bruschi, M. & LeCall, J . (1979) Nature (Lond.) 282, 806-810. 4. Moura, J. J. G., Santos, H., Moura, I., LeGall, J., Moore, G. R.,
Williams, R. J. P. & Xavier, A. V. (1982) Eur. J . Biochem. 127, 5. Santos, H., Moura, J. J. G., Moura, I., LeGall, J. & Xavier, A.
V. (1984) Eur. J . Biochem. 141,283-296. 6. Xavier, A. V. (1986) J. Znorg. Chem. 28, 239-243.
7. DerVartanian, D. V., Xavier, A. V. & LeGall, J. (1978) Biochirnie 8. Xavier, A. V., Moura, J. J. G., LeGall, J. & DerVartanian, D. V.
9. Cammack, R., Fauque, G., Moura, J. J. G. & LeGall, J. (1984) 10. Gayda, J. P., Yagi, T., Benosman, H. & Bertrand, P. (1987) FEBS
11. Gayda, J. P., Bertrand, P., More, C., Guerlesquin, F. & Bruschi,
12. Fauque, G. (1985) These de Doctorat d’Etat, Universite de Tech-
13. Dutton, P. L. (1971) Biochim. Biophys. Acta 226,63-80. 14. Samin, E., Albagnac, G. & LeGall, J. (1986) FEBS Lett. 204, 15. Moura, I., Xavier, A. V., Moura, J . J. G., Fauque, G., LeGall,
J. & Huynh, B. H. (1985) Rev. Port. Quirn. 27,212-215. 16. Walker, F. A., Huynh, B. H., Scheidt, W. R. & Osvath, S. R.
(1986) J . Am. Chem. Soc. 108, 5288-5297. 17. Palmer, G. (1985) Biochem. Soc. Trans. 13, 548-560.
18. Dolla, A., Cambillau, C., Bianco, P., Haladjian, J. & Bruschi, M. (1987) Bzochem. Biophys. Res. Commun. 147,818-823. 151 -155.
(Paris) 60, 321 - 325.
(1979) Biochimie (Paris) 61, 680-695. Biochim. Biophys. Acta 784, 68 - 74.
Lett. 1, 57-61.
M. (1985) Biochim. Biophys. Acta 829, 262-267. nologie, Compiegne.