Outubro, 2013
Carlos André Mendonça Gomes
Licenciatura em Ciências da Engenharia Química e Bioquímica
Study of multi-component systems in
polybenzimidazole membrane formation and their
impact on membrane performance
Dissertação para obtenção do Grau de Mestre em
Engenharia Química e Bioquímica
Orientador: Professor
Andrew
Livingston, Imperial College London
Co-orientadores: Professora Isabel Coelhoso, Universidade Nova de Lisboa
Júri:
Presidente: Ana Maria Martelo Ramos
Arguente: Svetlozar Gueorguiev Velizarov
Outubro 2013
Carlos André Mendonça Gomes
Licenciatura em Ciências da Engenharia Química e BioquímicaSTUDY OF MULTI-COMPONENT SYSTEMS IN
POLYBENZIMIDAZOLE MEMBRANE FORMATION AND
THEIR IMPACT ON MEMBRANE PERFORMANCE
Dissertação para obtenção do Grau de Mestre em Engenharia Química e Bioquímica
Orientador: Professor Andrew G. Livingston (Imperial College London)
Co-orientador: Professora Isabel Coelhoso (Universidade Nova de Lisboa)
IMPERIAL COLLEGE LONDON
Faculty of Engineering
Department of Chemical Engineering and Chemical Technology
UNIVERSIDADE NOVA DE LISBOA
Study of multi-component systems in polybenzimidazole membrane formation and their impact
on membrane performance
Copyright © Carlos André Mendonça Gomes, Faculdade de Ciências e Tecnologia, Universidade Nova de Lisboa.
III
ACKNOWLEDGMENT
First of all, I would like to thank Professor Andrew Livingston for having me in his research group. I am deeply grateful to Irina Valtcheva, my daily supervisor, who helped me through the whole project, including writing this thesis.
I would like to thank all the other members of the Separation Engineering and Technology research group for their support during my stay at Imperial College London.
I would like also to thank Professor Isabel Coelhoso for being always available to help with any questions and showing interest in my work.
V
ABSTRACT
Integrally skinned asymmetric polybenzimidazole (PBI) membranes suitable for organic solvent nanofiltration (OSN) were prepared via phase inversion and several changes were implemented in the dope solutions in order to control their molecular weight cut-off (MWCO). Initially, uncrosslinked membranes with different polymer concentrations were tested to investigate their impact on membrane performance. On a second approach, several co-solvents were added in the dope solutions of PBI membranes. Coupling this methodology with chemical crosslinking, using an aromatic bi-functional crosslinker, provided solvent stable membranes with several MWCOs in the nanofiltration range and high permeance. Further variation of membrane dope parameters was tested in order to study membrane formation impact on membrane performance. Total solubility parameters of the chosen co-solvents were calculated, and a correlation between this tool and membrane performance was studied. Even though it was not possible to withdraw conclusions on a fundamental level, from the correlation of the total solubility parameters with membrane performance, this work demonstrates the possibility of developing PBI OSN membranes using different co-solvents and opens up future possibilities for controlling the MWCO of these membranes. A post-treatment study was also conducted in order to examine its impact in membrane performance.
Keywords: Organic Solvent Nanofiltration (OSN), Polibenzamidazole (PBI), Membrane formation,
VII
RESUMO
Diversas membranas resistentes a solventes orgânicos (OSN) foram preparadas com Polybenzimidazole (PBI) via phase inversion e várias alterações foram implementadas nas soluções de modo a controlar o peso molecular que rejeitam (MWCO). Inicialmente, membranas sem crosslink
foram preparadas com diferentes concentrações de polímero e foram testadas de modo a investigar o seu impacto na performance das membranas. Numa segunda abordagem, diversos co-solventes foram adicionados às soluções de PBI. A conjugação da adição de co-solventes com crosslinking
com um crosslinker aromático bi-funcional deu origem a membranas estáveis com vários MWCO na região da nanofiltração com elevada permeabilidade. Outros parâmetros foram estudados de modo a verificar o impacto da formação da membrana na sua performance. Parâmetros de solubilidade dos co-solventes foram calculados e estudou-se uma correlação entre estes e a performance das membranas. Ainda que não tenha sido possível tirar conclusões a um nível fundamental, este trabalho demonstra a possibilidade de desenvolver membranas com PBI para OSN com diferentes co-solventes de modo a obter diferentes MWCO. Um estudo de pos-tratamento também foi desenvolvido de modo a examinar o seu impacto na performance das membranas
Palavras-chave: Nanofiltração em solventes orgânicos (OSN), Polibenzamidazole (PBI), Formação
IX
TABLE OF CONTENTS
LIST OF FIGURES ... XI
LIST OF TABLES ...XV
LIST OF ABBREVIATIONS ... XVII
NOMENCLATURE ... XIX
1.
Literature Review
1
1.1. Membrane technology 1
1.1.1. Membranes: Definition and classification 1 1.1.2. Types of membranes 2 1.1.3. Membrane preparation via phase inversion 4 1.1.4. Post-treatment and conditioning techniques 7 1.1.5. Membrane processes 9 1.1.6. Membrane performance characterisation 10 1.1.7. Transport in membranes 11
1.2. OSN – an emerging technology 12
1.2.1. Membrane applications in organic solvents 12 1.2.2. Polymers generally used for OSN membranes 12 1.2.3. Polybenzimidazole (PBI) as OSN membrane material 14
1.3. Challenges in OSN and research motivation 16
1.3.1. Strengths and limitations of OSN membrane processes 16 1.3.2. Research motivation 17
2.
Materials and Methods
19
2.1. Polybenzimidazole membranes 19
2.1.1. Materials 19
2.1.2. Preparation of IS asymmetric PBI membranes 19
2.2. Cross-flow filtration system 20
2.3. Analytical methods and parameters calculations 22
X
2.3.4. Fourier transform – infrared spectroscopy (FT-IR) 23 2.3.5. Diffusivity parameter 23 2.3.6. Total solubility parameter 23
3.
Uncrosslinked membranes
25
3.1. Effect of polymer concentration and pressure 25
3.1.1. Experimental 25
3.1.2. Results and discussion 26
3.2. Effect of THF addition 28
3.2.1. Experimental 28
3.2.2. Results and discussion 29
4.
Crosslinked membranes
33
4.1. Effect of crosslinking on membrane performance 33
4.1.1. Experimental 33
4.1.2. Results and discussion 33
4.2. Multi-component systems 35
4.2.1. Experimental 35
4.2.2. Results and discussion 36
4.3. Effect of post-treatment on MWCO and permeance of PBI membranes 44
4.3.1. Experimental 44
4.3.2. Results and discussion 45
5.
Final conclusions and future work
47
XI
LIST OF FIGURES
Figure 1.1 – Schematic representation of a membrane system selectively retaining Component 1 and allowing Component 2 to pass through under an applied driving force (Mulder, 1996) ... 1 Figure 1.2 – Schematic representation of the four basic polymer membrane types (Baker, 2004) ... 3 Figure 1.3 – a) Schematic representation of a ternary phase diagram of the phase inversion process; b) Schematic representation of composition variance during membrane formation in a ternary phase diagram. A – initial composition of the dope solution; B – composition at which the polymer starts to precipitate; C – composition at which the polymer can be considered solid; D – final composition of the membrane; S – polymer solid phase; L – polymer liquid phase (Baker, 2004) ... 6 Figure 1.4 – Schematic representation of two different composition pathways across the polymer film, at a time t, almost immediately after immersion in the non-solvent. a) instantaneous demixing; b) delayed demixing (Vandezande, Gevers & Vankelecom, 2008) ... 7 Figure 1.5 – Schematic representation on how to build up macromolecules (Mulder, 1996) ... 8 Figure 1.6 – Schematic representation of a rejection profile of a typical OSN membrane with indication of the MWCO (Mulder, 1996) ... 11 Figure 1.7 – Mass transport through membranes can be described by a) flow through membrane pores in microporous membranes; or by b) the solution-diffusion mechanism through the membrane material in dense membranes (Baker, 2004) ... 11 Figure 1.8 – Chemical structure of polyimide Lenzing P84 - 20% of a) methylphenylenediamine (MDI) and 80% of b) toluenediamine (TDI) (See-Toh, Ferreira & Livingston, 2007) ... 13 Figure 1.9 – Chemical structure of polyacrylonitrile (Vandezande, Gevers & Vankelecom, 2008) ... 13 Figure 1.10 – Chemical structure of polyetheretherkethone (Vandezande, Gevers & Vankelecom, 2008) ... 14 Figure 1.11 – Chemical structure of poly-2,2-(m-phenylene)-5,5-bibenzimidazole (PBI) (Chung, 1997) ... 14 Figure 2.1 – Chemical crosslinking mechanism of 2,2-(m-phenylene)-5,5-bibenzimidazole (PBI) with
XII
XIII
XV
LIST OF TABLES
Table 1.1 – Comparison between polymeric and ceramic membranes (Drioli & Giorno, 2009) ... 4
Table 1.2 – Phase inversion procedures (Baker, 2004) ... 5
Table 1.3 – Membrane processes according to their driving forces (Mulder, 1996) ... 9
Table 1.4 – Pressure driven membrane processes (Mulder, 1996) ... 9
Table 3.1 – Summary of prepared IS asymmetric PBI membranes and the physical characteristics of the dope solutions and casting conditions, for the polymer concentration study ... 25
Table 3.2 – Summary of PBI uncrosslinked membranes with different polymer concentrations performance. Initial and final permeances with respective percentage decrease and the MWCO of the tested membranes at 30 bar... 28
Table 3.3 – Summary of prepared IS asymmetric PBI membranes and the physical characteristics of the dope solutions and casting conditions, for the addition of THF study ... 29
Table 3.4 – Polarity index (Norman B. Godfrey, 1972) and partition coefficient (George Wypych, 2012) of DMAc and THF ... 30
Table 3.5 – Total solubility parameter of THF as non-solvent in ratios 4:1, 4:2 and 4:3 ... 30
Table 3.6 – Summary of the performance of PBI uncrosslinked membranes with different concentrations of THF in the dope solutions. Initial and final permeances and respective percentage decrease and the MWCO of the tested membranes ... 32
Table 4.1 – Summary of PBI uncrosslinked and crosslinked membranes with 17 wt% polymer performance. Initial and final permeances and respective percentage decrease and the MWCO of the tested membranes ... 35
Table 4.2 – Summary of prepared IS asymmetric PBI membranes and the physical characteristics of the dope solutions and casting conditions, for the multi-component systems study ... 36
Table 4.3 – Diffusivity parameter (Geankoplis, 1993; Poling, Prausnitz & O’Connell, 2001), Polarity index (Norman B. Godfrey, 1972) and partition coefficient (George Wypych, 2012) of EtOH, MeOH and IPA ... 38
Table 4.4 – Diffusivity parameter (Geankoplis, 1993; Poling, Prausnitz & O’Connell, 2001), Polarity index (Norman B. Godfrey, 1972) and partition coefficient (George Wypych, 2012) of DMF, MeCN and THF ... 40
Table 4.5 – Diffusivity parameter (Geankoplis, 1993; Poling, Prausnitz & O’Connell, 2001), Polarity index (Norman B. Godfrey, 1972) and partition coefficient (George Wypych, 2012) of DXN ... 41
Table 4.6 – Summary of PBI crosslinked membranes with 17 wt% polymer performance with DMF and DXN as co/non-solvents in the dope solution in different ratios. Initial and final permeances and respective percentage decrease, MWCO and total solubility parameter of the tested membranes ... 43
XVII
LIST OF ABBREVIATIONS
DBX α,α’-dibromo-p-xylene DMAc N,N-dimethylacetamide DMF N,N-dimethylformamide DMSO dimethylsulfoxide
DXN 1,4-dioxane EtOH ethanol
FT-IR Fourier transform – infrared spectroscopy HPLC High Pressure Liquid Chromatography IPA propan-2-ol
IS integrally skinned MeCN acetonitrile
MeOH methanol MF microfiltration MWCO molecular weight cut-off NF nanofiltration NMP methylpyrrolidinone
OSN organic solvent nanofiltration PAN polyacrylonitrile
PBI polybenzimidazole PEEK polyetheretherkethone PEG polyethylene glycol
XVIII TFC thin film composite
XIX
NOMENCLATURE
µ Viscosity (cP) A Membrane area (m2)
B Solvent permeance (L.m-2.h-1.bar-1) C Concentration (g.L-1)
ci,F Concentration of solute in the feed (g.L
-1
)
ci,P Concentration of solute in the permeate (g.L
-1
) D Diffusivity coefficient (m2.s-1)
Ecoh Cohesion energy (J.mol-1)
J Flux (L.m-2.h-1)
MW Molecular weight (g.mol-1) P Pressure (bar) R Rejection of solute (%) T Temperature (T) t Time (h) V Volume (L) Vi Mole volume
Xi Mole fraction ∆ Gradient
δ Solubility parameter (MPa.s)
Literature Review
1
1. Literature
Review
1.1. Membrane
technology
1.1.1. Membranes: Definition and classification
Membrane technology is interdisciplinary, involving chemists to develop new membrane materials; mathematicians to describe the transport properties of different membranes using mathematical models to predict their separation characteristics; and chemical engineers to design separation processes for large scale industrial utilization. However, the most important element in a membrane process is the membrane itself (Porter, 1990).
A complete definition of a membrane that covers all its aspects is rather difficult. In general, a membrane is a thin, film-like structure that acts as a selective barrier, separating two fluids (gas or liquid), allowing some solutes and solvents to pass through, but not others, when exposed to the action of a driving force (concentration, pressure, temperature gradient, electrical potential) (Figure 1.1). Some components are allowed passage by the membrane into a permeate stream, whereas others are retained by it and accumulate in the retentate stream. Thus, the membrane remains impermeable to specific particles, molecules or substances (Vandezande, Gevers & Vankelecom, 2008).
Literature Review
2
1.1.2. Types of membranes
Membranes can be classified according to their nature and pore size.
Nature (Mulder, 1996):
o Synthetic o Biological
Pore Size (IUPAC) (Baker, 2004):
o RO (Reverse Osmosis) – dense (non-porous) o NF (Nanofiltration) – pores smaller than 2 nm o UF (Ultrafiltration) – pores from 2 nm to 0.1 µm o MF (Microfiltration) – pores from 0.1 µm to 10 µm o Conventional filtration – pores from 10 µm to 100 µm
The material selection for synthetic membranes can be based on the membrane film forming properties, chemical and thermal stability, commercial availability and price (Table 1.1).
Synthetic membranes can be divided into ceramic (inorganic) and polymeric (organic).
Ceramic membranes. Ceramic (inorganic) membranes are classified as dense or porous according to their morphology. The most commonly used inorganic membranes are composites consisting of two or more layers. These layers can have different porosity and can be made of different inorganic materials such as Al2O3, TiO2, ZrO2 or SiO2 (Baker, 2004).
Different techniques exist for fabricating ceramic membranes such as slip casting, dip-coating, sol-gel and others. Usually they include multiple steps where each step involves a high temperature sintering treatment (Baker, 2004).
Polymeric membranes. Polymeric (organic) membranes can be classified in two categories
Literature Review
3
Figure 1.2 – Schematic representation of the four basic polymer membrane types (Baker, 2004) a) Nonporous/dense membranes. The transport of molecules through dense membranes is a diffusion based process in which the driving force can be a pressure, concentration or electrical potential gradient across the membrane. The phase separation occurs due to a difference in diffusivity and solubility of the solutes in the membrane. This type of membrane is commonly used in gas separation, reverse osmosis and pervaporation. The disadvantage of dense membranes is the high resistance to flow resulting in low flow rates and therefore low feasibility for commercial applications (Baker, 2004).
b) Porous membranes. These membranes consist of a rigid structure with interconnected pores evenly distributed over the membrane. The separation occurs mainly due to size exclusion, which means that only molecules with significant size difference will be separated. Symmetric porous membranes are suitable for ultra- and microfiltration (Baker, 2004).
c) Integrally skinned (IS) membranes. Characteristic for integrally skinned membranes is the non-uniform pore size distribution across the membrane thickness. They consist of a highly porous bottom layer and a less porous top layer, both prepared in one step using the same polymer material. The porous substructure provides mechanical support and prevents the membrane from breaking, whereas the less porous skin layer is responsible for molecular discrimination and flow resistance. Such membranes are usually prepared via phase inversion technique in one step. They are applied in ultra- and nanofiltration as well in gas separation and reverse osmosis (Baker, 2004; Mulder, 1996).
Literature Review
4
prepared via phase inversion while the ultrathin top layer can be obtained through several different techniques – dip coating, spin coating, interfacial polymerisation, plasma deposition and others. TFC membranes are used in reverse osmosis, nanofiltration and gas separation (Drioli & Giorno, 2009; Vandezande, Gevers & Vankelecom, 2008).
Comparison between ceramic and polymeric membranes. In terms of chemical, thermal and
structural stability, ceramic membranes perform better than polymeric (Table 1.1). However their production costs, complicated synthesis, handling difficulties and process scale-up are a big obstacle for them to be used more widely (Drioli & Giorno, 2009), therefore polymeric membranes are the ones studied in this dissertation.
Table 1.1 – Comparison between polymeric and ceramic membranes (Drioli & Giorno, 2009)
Ceramic membrane materials Polymeric membrane materials
High production cost Low production cost Fragile, difficult to handle Flexible, easy to handle
Complex production scale-up Straightforward production scale-up Difficult variation of form and shape Easy variation of form and shape Good long term stability Short life time, bad long term stability Good versatility in organics Limited versatility in some organics Thermal regeneration possible Thermal regeneration impossible
Stable in extreme pH conditions Limited stability in extreme pH conditions
1.1.3. Membrane preparation via phase inversion
Literature Review
5
Table 1.2 – Phase inversion procedures (Baker, 2004)
Procedure Process
Water precipitation (the Loeb-Sourirajan process)
The cast polymer solution is immersed in a non-solvent bath (typically water). Absorption of water and loss of solvent cause the film to rapidly precipitate from the top surface down Water vapour absorption The cast polymer solution is placed in a humid atmosphere.
Water vapour absorption causes the film to precipitate. Thermal gelation The polymeric solution is cast hot. Cooling causes
precipitation
Solvent evaporation A mixture of solvents is used to form the polymer casting solution. Evaporation of one of the solvents after the casting, changes the solution composition and causes precipitation
The water precipitation technique, developed by Loeb and Sourirajan in the sixties, is the most commonly used procedure. In their process, precipitation is induced by immersing the cast solution, also known as dope solution, containing 20 to 25 wt% of polymer, in a water bath (Loeb & Sourirajan, 1963). The first step consists in evenly spreading the homogeneous polymer cast solution across a non-woven material with a casting knife. The space between the blade of the knife and the surface forms a precise gap, usually between 50 and 300 µm. The next step involves immersing the polymer in a non-solvent bath (water) causing the fast precipitation of the polymer and consequently the formation of the dense top layer. This dense layer acts as a barrier, slowing down the water access into the following layers, forming the porous structures. This procedure is still used in laboratories, but for industrial scale, large casting machines produce rolls of membrane up to 5 000 m long and 2 m wide (Baker, 2004).
Literature Review
6
Figure 1.3 – a) Schematic representation of a ternary phase diagram of the phase inversion process; b) Schematic representation of composition variance during membrane formation in a ternary phase diagram. A – initial composition of the dope solution; B – composition at which the polymer starts to precipitate; C – composition at which the polymer can be considered solid; D – final composition of the
membrane; S – polymer solid phase; L – polymer liquid phase (Baker, 2004)
During membrane formation (Figure 1.3 - b), via phase inversion, solvent exchange occurs with the precipitation medium, and the initial composition of the dope solution, A, changes according to the dashed line in Figure 1.3 – b), until the final composition of the membrane, D, is obtained. At composition D, the two phases are in equilibrium: a solid phase (polymer rich), S, which forms the final structure of the membrane, and a liquid phase (polymer-poor), L, which embodies the membrane pores filled with non-solvent. The position of D on the S-L line determines the overall porosity of the membrane. The point B corresponds to the point at which the polymer starts to precipitate. As precipitation proceeds, solvent is lost, and non-solvent is absorbed by the solid phase, increasing its viscosity. At C, the viscosity is high enough for the polymer to be considered solid (Baker, 2004). When the cast polymer film, A, gets in contact with the precipitation medium, the surface begins to precipitate first. In composition B, the surface precipitates quickly, and the two phases formed, do not have time to agglomerate, producing a finely microporous structure. When composition C is reached, the top layer of the film becomes a solid barrier, slowing down the loss of solvent and the admission of non-solvent inside the pores. This leads to a decrease in the precipitation velocity from the top to the bottom of the film, and consequently to an increase of the average pore size, since the two phases formed have more time to separate. The final membrane is formed when composition D is attained, and solvent has been completely replaced by the non-solvent (Baker, 2004).
Literature Review
7
thermodynamically stable region of the diagram, originating a tighter membrane. Phase separation will only occur after more non-solvent enters the film (Vandezande, Gevers & Vankelecom, 2008).
Figure 1.4 – Schematic representation of two different composition pathways across the polymer film, at a time t, almost immediately after immersion in the non-solvent. a) instantaneous demixing; b) delayed
demixing (Vandezande, Gevers & Vankelecom, 2008)
b) Polymer concentration. The concentration of polymer in the dope solution, will also affect the membrane morphology and therefore its performance. Increasing the polymer concentration in the dope solution will make the membrane denser, forming accordingly a thicker skin layer with concealed macrovoids in the sublayers, while decreasing the polymer concentration in the dope solution will contribute to a porous structure with macrovoids. Macrovoids are finger- or tear-like pores that can extend over the entire membrane thickness, and are generally considered undesired, since they cause mechanically weak spots in the membrane (Baker, 2004).
c) Co-solvents and other additives. The membrane structure differs with the composition of the dope solution. The addition of a volatile co-solvent to the casting solution will increase the polymer concentration in the top layer during phase inversion, producing a membrane with lower throughput and higher rejection (Vandezande, Gevers & Vankelecom, 2008). Other additives such as inorganic salts, pore forming agents, other non-solvents or low molecular weight polymers can be added to the dope solution. These agents, even in small amounts, can have significant repercussion on the membrane structure and consequently on its performance (Pinnau & Freeman, 2000).
1.1.4. Post-treatment and conditioning techniques
There are many parameters that influence solute separation. One of them is the post-formation treatment which has a severe impact on the final structure of the membrane and its performance. Crosslinking, thermal annealing, solvent exchange and impregnation are some of the most common post-treatment and conditioning techniques used to enhance membrane performance and long-term stability (Mulder, 1996; Baker, 2004; Vandezande, Gevers & Vankelecom, 2008).
Literature Review
8
Crosslinking of the polymer is induced using a chemical reaction or through radiation and can be done during membrane formation or after which is the most common procedure. This post formation treatment changes the properties of the polymer, i.e. the polymer becomes insoluble in solvents in which it was soluble before. Further, crosslinking results in membranes which reject lower MW solutes. However, this is often at the expense of a decrease in membrane permeance (Mulder, 1996).
Figure 1.5 – Schematic representation on how to build up macromolecules (Mulder, 1996)
b) Thermal annealing. A commonly used technique to obtain tighter nanofiltration membranes is thermal annealing, i.e. heating up the membrane to temperatures below the degradation temperature of the polymer. However, with this kind of treatment, the permeance of the membrane decreases. This is due to the fact that the polymer chains reorganise themselves to a more stable thermodynamic structure (See-Toh, Ferreira & Livingston, 2007). A gradual loss of porosity in the top layers is also verified, as well as significant shrinkage of the membrane structure (Vandezande, Gevers & Vankelecom, 2008).
Literature Review
9
1.1.5. Membrane processes
Membrane processes are characterised by the use of a membrane to obtain a certain separation. Certain solutes are transported more willingly through the membrane than others due to physical and/or chemical properties between the membrane and the permeating components. Solvent/solute transport through the membrane occurs as a result of gradients in pressure (∆P), concentration (∆C), temperature (∆T) or electrical potential (∆E) (Table 1.3) that generate a driving force (Mulder, 1996).
Table 1.3 – Membrane processes according to their driving forces (Mulder, 1996)
Pressure (∆P) Concentration (∆C) Temperature (∆T) Electrical potential (∆E)
Microfiltration Gas separation Thermo-osmosis Electrodialysis Ultrafiltration Vapour permeation Membrane distillation Membrane electrolysis Nanofiltration Pervaporation
Reverse osmosis Dialysis
Diffusion dialysis
Membrane contactors
Microfiltration (MF), ultrafiltration (UF), nanofiltration (NF) and reverse osmosis (RO) are the most important pressure driven membrane processes and the difference between them is regarding the particle size of the solutes to be separated. All of them are used to purify or concentrate a dilute (aqueous or non-aqueous) solution. Higher pressures are applied as we go from microfiltration to reverse osmosis (Table 1.4). Since the size of the particles to be separated decreases form microfiltration to reverse osmosis, the resistance of the membranes to mass transfer increases accordingly (Mulder, 1996).
Table 1.4 – Pressure driven membrane processes (Mulder, 1996)
Membrane process Pressure range
(bar)
Pore sizes
(nm) Separation type
Microfiltration (MF) 0.1 – 2.0 > 100 Particles Ultrafiltration (UF) 1.0 – 5.0 1 – 100 Macromolecules Nanofiltration (NF) 5.0 – 20
< 2 Low molecular weight solutes Reverse osmosis (RO) 10 – 60
Literature Review
10
Nevertheless, organic solvent nanofiltration (OSN), or solvent resistant nanofiltration (SRNF), has great potential for industrial applications such as solvent exchange (Sheth, Qin, Sirkar, et al., 2003), catalyst recovery and recycling (van der Gryp, Barnard, Cronje, et al., 2010), purifications and concentrations (Van der Bruggen, Mänttäri & Nyström, 2008; Vandezande, Gevers & Vankelecom, 2008).
1.1.6. Membrane performance characterisation
Membrane characterisation is not only based on physical parameters (pore size and distribution, surface roughness and overall membrane thickness) and chemical parameters (charge and hydrophobicity), but is also based on functional performance. Membrane performance is characterised by filtration experiments, and two features are measured – permeance and separation. The permeance B (L.m-2.h-1.bar-1) is defined as the volume permeated, Vp (L), per unit membrane area, A
(m2), per unit time, t (h), per unit pressure drop, ∆P (bar). In general, the flux J (L.m-2.h-1) is measured (Equation 1.1) at a given pressure ∆P and hence, the permeance can be calculated (Equation 1.2). Parameters like temperature and solute concentration have an impact on the flux of NF membranes. The permeation flow tends to increase with higher temperatures because of reduction of solvent viscosity and increased polymer chain mobility. Higher solute concentrations result in decreased flux due to increase of osmotic pressure and therefore, decrease of the driving force.
Equation 1.1
Equation 1.2
The rejection R (%) of a solute i will determine the membrane separation ability and is described by the following equation (Equation 1.3),
Equation 1.3
where ci,P is the concentration of the molecule i in the permeate and ci,F the concentration of the
Literature Review
11
Figure 1.6 – Schematic representation of a rejection profile of a typical OSN membrane with indication of the MWCO (Mulder, 1996)
1.1.7. Transport in membranes
In order to understand and predict the behaviour of a specific membrane, several mathematical models were developed. Three groups of mathematical models are accepted to describe transport through membranes. The first group of models is based on irreversible thermodynamics, treating the membrane as a black-box, while the other two, the pore-flow and the solution diffusion models, take into account properties from the membrane itself (Vandezande, Gevers & Vankelecom, 2008).
The most reliable transport models for OSN are the pore-flow (Figure 1.7 - a)) and the solution-diffusion (Figure 1.7 - b)) models, which describe the transport through porous (e.g. micro- and ultrafiltration membranes) and dense membranes (e.g. reverse osmosis, gas separation and pervaporation membranes) respectively since NF is a process intermediate between UF and RO (Van der Bruggen, Mänttäri & Nyström, 2008; Baker, 2004).
Figure 1.7 – Mass transport through membranes can be described by a) flow through membrane pores in microporous membranes; or by b) the solution-diffusion mechanism through the membrane material in
dense membranes (Baker, 2004)
Both models are based on mass transfer principles, however different assumptions are made. According to the pore-flow model, the concentration of species across the membrane is constant and
0 200 400 600 800 1000 1200
0 20 40 60 80 100
Re
je
c
ti
o
n
(
%
)
Literature Review
12
the transport is a pressure-driven convective flow through the pores of the membrane (Figure 1.7 - a)). On the other hand, according to solution-diffusion model, the pressure is assumed to be constant across the membrane, and the solute transport occurs by dissolution of the solute in the membrane material and its diffusion due to a concentration gradient (Figure 1.7- b)) (Baker, 2004). The transport through NF membranes can be predicted with these two models since it is considered to be in a transition region, between RO and UF (Baker, 2004).
1.2. OSN – an emerging technology
Typical purification processes employed at industrial scale are distillation, chromatography, adsorption and crystallisation. However, these processes have high energy consumption or lead to partial material degradation. OSN has emerged as a new solution with potential for several industrial sectors. Molecular scale separations using membranes are now a reality, and several companies are investing in membrane technology in order to make it more widely available (Vandezande, Gevers & Vankelecom, 2008).
1.2.1. Membrane applications in organic solvents
Although it is relatively new, OSN has already been applied in several industrial fields - chemical purification (Székely, Bandarra, Heggie, et al., 2012), petrochemical industry (White, 2006), solvent recovery (Rundquist, Pink, Vilminot, et al., 2012), catalytic reactions (van der Gryp, Barnard, Cronje, et al., 2010), solvent exchange (Sheth, Qin, Sirkar, et al., 2003), peptide synthesis (Reddy, Kawakatsu, Snape, et al., 1996), stereochemistry (Ferreira, Macedo, Cocchini, et al., 2006) and membrane bioreactors (Valadez-Blanco, Ferreira, Jorge, et al., 2008).
OSN is changing the way reactions, separations and recycling are approached in industry. Thus, hybrid processes between conventional separation techniques and OSN offer new and greener solutions (Vandezande, Gevers & Vankelecom, 2008).
1.2.2. Polymers generally used for OSN membranes
Membrane performance in OSN conditions depends on the polymers used for membrane formation. These polymers must be resistant to a broad range of solvents and must not dissolve in them. Most polymers are not intrinsically stable in certain solvents, but can be stabilised via crosslinking. Several polymers have shown good performances in OSN processes such as polyimide (PI), polyacrylonitrile (PAN), polyetheretherkethone (PEEK) and others (Vandezande, Gevers & Vankelecom, 2008).
Literature Review
13
tetrahydrofuran (THF), N,N-dimethylformamide (DMF) and N-methylpyrrolidone (NMP) (See Toh, Lim & Livingston, 2007).
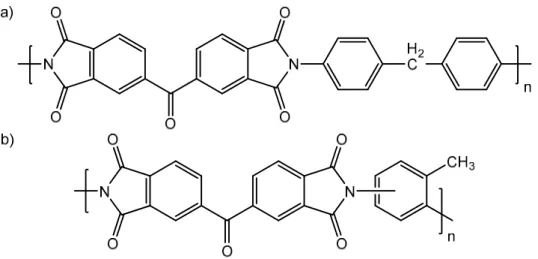
Figure 1.8 – Chemical structure of polyimide Lenzing P84 - 20% of a) methylphenylenediamine (MDI) and 80% of b) toluenediamine (TDI) (See-Toh, Ferreira & Livingston, 2007)
Polyacrylonitrile (PAN). PAN membranes have been widely used in water treatment, pervaporation, enzyme immobilization and biomedical applications (Wu, Wan & Xu, 2012). These membranes have shown thermal stability (up to 130 °C) and resistance to many organic solvents (Zhao, Li, Wang, et al., 2005). PAN has also good resistance against chlorine, and cleaning agents. Nevertheless, the applications of PAN membranes have been hindered by the brittleness of the membrane and pore collapse upon drying (Jung, Yoon, Kim, et al., 2004).
Literature Review
14
Figure 1.10 – Chemical structure of polyetheretherkethone (Vandezande, Gevers & Vankelecom, 2008)
1.2.3. Polybenzimidazole (PBI) as OSN membrane material
In order to implement OSN to relevant processes, membranes must be resistant to several solvents, temperature and pH environments. Inorganic materials are ideal for these conditions since they are not chemically or structurally affected by organic solvents, acids and bases. However, as it was mentioned before, they are hard to produce and handle, and are more expensive to synthesise when compared to organic membranes. Organic membranes, made out of polymeric materials, have been trying to overcome these problems (Baker, 2004; Drioli & Giorno, 2009; Vandezande, Gevers & Vankelecom, 2008). New materials are being developed, new crosslinking reactions are being study and novel processes are being considered in order to overcome these problems (Van der Bruggen, Mänttäri & Nyström, 2008).
Polybenzimidazole is an amorphous thermoplastic polymer containing benzimidazole rings in its repeating unit (Li, He, Jensen, et al., 2004). The most commonly used polybenzimidazole is poly-2,2-(m-phenylene)-5,5-bibenzimidazole (PBI) due to its outstanding thermal (Tg = 425-436 ºC), mechanical
(retention of stiffness and toughness) and chemical stability (towards solvents, acids and bases) in corrosive environments (Chung, 1997). PBI has been studied extensively for reverse osmosis (Sawyer & Jones, 1984) gas separation (Kumbharkar, Karadkar & Kharul, 2006), aqueous NF (Wang, Xiao & Chung, 2006), fuel cells (Li, He, Jensen, et al., 2004) and more recently for OSN (Livingston & Bhole, 2013). PBI is soluble in polar aprotic solvents as N,N-dimethylacetamide (DMAc), N -methylpyrrolidinone (NMP) and dimethylsulfoxide (DMSO), and can be dissolved and cast from solutions of them. For filtration in such solvents, PBI must be crosslinked with aliphatic dihalogenes (Livingston & Bhole, 2013) or xylene dihalogenes (Wang, Xiao & Chung, 2006) to prevent polymer dissolution and membrane failure. Using PBI for the preparation of OSN membranes could overcome some of the issues that other polymers have, e.g. easy to process into flexible flat sheet membranes, great chemical resistance in corrosive environments and hydrophilic properties.
Figure 1.11 – Chemical structure of poly-2,2-(m-phenylene)-5,5-bibenzimidazole (PBI) (Chung, 1997)
Controlling PBI MWCO – learning from polyimide. Polyimide membranes are commonly prepared
Literature Review
15
found to strongly influence the molecular weight cut-off (MWCO) and flux of PI membranes (See-Toh, Silva & Livingston, 2008; Vandezande, Li, Gevers, et al., 2009; Soroko, Lopes & Livingston, 2011; Soroko, Makowski, Spill, et al., 2011). However, until now, a methodology to describe thermodynamics of quaternary polymer solutions (polymer, solvent, co-solvent and the non-solvent) has not been developed (Soroko, Lopes & Livingston, 2011).
Solubility parameters can determine, to a certain degree, the interactions between the components in the dope solution; i.e. polymer–solvent, polymer–non-solvent and solvent–non-solvent (Strathmann & Kock, 1977) and those interactions are known to affect the course of the phase inversion (See-Toh, Silva & Livingston, 2008). The Hildebrand solubility parameter, later improved by Hansen, is a measure of the intermolecular energy (Gedde, 1995; Barton, 1983). Hansen solubility parameter takes into account dispersion forces, polar forces and hydrogen bonding, and is composed of three partial solubility parameters; ∆δP/S, ∆δP/NS and ∆δS/NS (Barton, 1983).
The first, ∆δP/S, represents the affinity between polymer and solvent. When the polymer is dissolved in
a thermodynamically “suitable” solvent, polymer-solvent contact is favoured and polymer chains are relatively extended, whereas in a “poor” solvent the polymer chain aggregation is higher (Billmeyer, 1984). This aggregation makes the dope less stable, and during immersion into the non-solvent bath, the solvent between polymer aggregates can leave faster, leading to a denser top layer formation. The second one, ∆δP/NS, is related to polymer and non-solvent interactions. Higher ∆δP/NS implies lower
affinity between polymer and the non-solvent leading to a decreased miscibility region, favouring instantaneous demixing and consequently a more open membrane. Lastly, ∆δS/NS, regards the
solvent/non-solvent exchange rate during immersion. Higher values of ∆δS/NS, represent low affinity
between solvent and non-solvent inducing a slow in-diffusion of the non-solvent into the polymer film, causing delayed demixing, and consequently leading to the formation of a tighter skin layer. It is then expected, that an increase of ∆δP/S and ∆δS/NS, and a decrease of ∆δP/NS results in the formation of a
tighter membrane (Soroko, Lopes & Livingston, 2011). The combination of all solubility parameters leads to a total solubility parameter, ∆δt. Higher ∆δt is expected to be related with the formation of
tighter membranes when compared to lower ∆δt (Soroko, Lopes & Livingston, 2011).
Soroko, et al., added 1,4-dioxane as a co-solvent in PI dope solutions with different polyimides. Different ratios of solvent/co-solvent (DMF/1,4-dioxane) were tested; 3/1, 1/1 and 1/2 (Soroko, Lopes & Livingston, 2011). The addition of 1,4-dioxane led to the formation of tighter membranes with higher rejections with the majority of polyimide membranes. These results were in accordance with the total solubility parameter theory described above. Other experiments were conducted with different solvent/co-solvent systems, NMP/THF, and the results were once again quite consistent with the predictions from the total solubility parameter, except for one polyimide membrane, that had a higher
∆δt value and a lower rejection with DMF/1,4-dioxane 3/1 when compared to the membrane prepared
Literature Review
16
1.3. Challenges in OSN and research motivation
1.3.1. Strengths and limitations of OSN membrane processes
There are numerous attractive features in OSN membrane processes. In most cases, membrane separation processes have low energy consumption comparing with other unit operation like distillation or crystallisation. Thermal damage that leads to degradation or side reactions is minimised due to the low temperature of operation, when compared to distillation processes. No phase transition takes place and no expensive additional equipment is required besides the membrane module and the high pressure pump in the majority of the processes. Therefore, membrane processes are generally considered environmentally sustainable and cost-effective processes (Vandezande, Gevers & Vankelecom, 2008).
Membrane processes are versatile, in the sense of being able to adjust to different applications such as water purification, carbon capture or organic solvent exchange. It is relatively simple to scale-up, and can be easily combined with other processes into a hybrid process (Vandezande, Gevers & Vankelecom, 2008).
Despite these advantages, only a few large-scale OSN processes are running. The most relevant limitations in OSN are related to low membrane stability in a wide range of organic solvents and non-reproducible performances at long term operation. Membrane compaction, insufficient separation, concentration polarisation and fouling of the membrane surface are also some of the challenges that OSN is still struggling with (Vandezande, Gevers & Vankelecom, 2008). The lifetime of OSN membranes depends mostly on the compatibility between the membranes and the solvents used. It is common to observe interactions between polymeric membranes and organic solvents leading to swelling, deformation or dissolution of the membrane to a certain extent (Van der Bruggen, Mänttäri & Nyström, 2008). Crosslinking the membranes can minimise these problems (See Toh, Lim & Livingston, 2007).
Fouling problems are related to the deposition of retained solutes in the membrane due to adsorption leading to precipitation, cake formation and pore blocking (Mulder, 1996). Concentration polarisation is an important fouling mechanism in which a higher concentration of solutes is created next to the membrane boundary layer, when compared to the bulk solution. This is owing to the accumulation of solutes at the membrane surface (Vandezande, Gevers & Vankelecom, 2008). This causes a reduction in the driving force solvent transport, resulting in a decreased permeate flux and increased mass transfer resistance (Mulder, 1996). It is possible to decrease the concentration polarisation or fouling effect by increasing the cross-flow velocity, using pulsate flow or ultrasound treatment (Mulder, 1996; Vandezande, Gevers & Vankelecom, 2008).
Literature Review
17
rejection increases before stabilisation is obtained (Gibbins, D’ Antonio, Nair, et al., 2002; Mulder, 1996). In order to minimise this behaviour, polymeric membranes should be conditioned with pure solvent until a steady flux is obtained prior to the actual separation process (Gibbins, D’ Antonio, Nair,
et al., 2002).
As shown in Figure 1.6, the rejection of OSN membranes is characterised by a sigmoidal curve, which is never completely sharp, resulting in an incomplete separation between compounds with similar molecular weight. This is due to the fact that the pores in OSN membranes have a broad size distribution (Richard Bowen & Doneva, 2000) leading to the presence of molecules in the permeate with size above and below the average pore size of the membrane, being this one of the major limitations for a wider application of membrane processes (Van der Bruggen, Mänttäri & Nyström, 2008). Several solutions are being studied to overcome this problem, like multiple membrane stages or membrane cascades (Kim, Freitas da Silva, Valtcheva, et al., 2013).
1.3.2. Research motivation
For membranes to be applicable in OSN conditions, they must meet several criteria in terms of material, structure and performance. The market of OSN membranes is still quite small and only a few polymeric membranes are available on the market. DuraMem® and PuraMem® are commercially available OSN membranes produced by Evonik. They are both made from P84® polyimide and are stable in non-aqueous solvents. DuraMem® has long term stability in polar aprotic solvents such as acetone, tetrahydrofuran, N,N-dimethylformamide and others. On the other hand, PuraMem® has good stability in apolar hydrocarbon-type solvents like toluene, heptane, hexane, methylethylketone and others (Evonik MET Ltd., n.d.). SolSep BV is another producer of membranes. They sell membrane modules that are stable in organic solvents like alcohols, ketones, alkanes and aromatics (SolSep BV - Robust Membrane Technologies, n.d.).
All OSN membranes, commercially available or laboratory developed, still face several challenges though.
Chemical stability. The membrane polymer and the support must be stable in diverse solvents. The polymer has to dissolve in common organic solvents in order to be easily processed, and it must have reactive functional groups to allow further solvent stability improvement.
Mechanical stability. The polymer must originate flexible and defect-free membranes, which can
resist operating temperatures and pressure without compromising its performance.
Permeance. NF membranes in general have low permeance. Separations must be time efficient, and
Literature Review
18
Selectivity. Ideal membranes would have a sharp selectivity separating completely the target
molecules from the undesired compounds, however this is not verified, and research is being conducted to improve the membrane itself, and process optimisation is also being undertaken. Control over the separation performance of OSN membranes is then desirable in order to achieve improved separation.
Materials and Methods
19
2. Materials and Methods
In order to better understand the transport through membranes and gain reliable separation data improved membrane characterisation tools are needed (See Toh, Loh, Li, et al., 2007). Characterisation parameters may be regarding morphological or performance features of the membrane (Cuperus & Smolders, 1991). Morphological characterisation combines physical (e.g. pore size, distribution and shape, skin layer thickness or surface roughness) and chemical (e.g. charge density, hydrophylicity or hydrophobicity) parameters, while permeance and rejection describe functional properties of the membrane. Functional parameters are more practical for membrane selection due to the difficulty in relating morphological parameters to membrane performance (See Toh, Loh, Li, et al., 2007).
2.1. Polybenzimidazole
membranes
2.1.1. Materials
Celazole® S26 polybenzimidazole (PBI) solution was purchased from PBI Performance Products Inc. (USA). The solution contains 26 wt% polymer and 1.5 wt% lithium chloride (LiCl), a stabiliser, dissolved in N,N-dimethylacetamide (DMAc). Non-woven polypropylene (PP) fabric Novatexx 2471 was obtained from Freudenberg Filtration Technologies (Germany). All solvents such as DMAc, N,N -dimethylformamide (DMF), 1,4-dioxane (DXN), ethanol (EtOH), propan-2-ol (IPA), acetonitrile (MeCN), methanol (MeOH) and tetrathydrofuran (THF) were HPLC grade and used as received from VWR (UK). The crosslinking agent was α,α’-dibromo-p-xylene (DBX), and polyethylene glycol (PEG400) for
membrane impregnation were both from VWR (UK).
2.1.2. Preparation of IS asymmetric PBI membranes
When required, Celazole® S26 was diluted with DMAc to lower polymer concentrations, co/non-solvents were added accordingly for the multi-component study. The dopes were stirred continuously at room temperature until a homogeneous solution was obtained and then left overnight to remove air bubbles. Membranes were cast on a non-woven PP fabric using a bench top laboratory casting machine with adjustable knife set at 250 µm (Elcometer UK). The membranes were then immersed in deionised water precipitation bath at 23 ± 1 °C for 24 h. Following this, the membranes were washed with IPA to remove residual solvent and water.
To crosslink the polymer, the membranes were immersed in a solution containing 3 wt% DBX in MeCN (Figure 2.1), at 80 °C for 24 h under constant stirring and reflux. After the reaction, the membranes were washed with IPA until complete removal of residual crosslinking agent. Following this, the membranes were immersed in a PEG400/IPA solution (1/1 v/v, or different concentrations for
Materials and Methods
20
Figure 2.1 – Chemical crosslinking mechanism of 2,2-(m-phenylene)-5,5-bibenzimidazole (PBI) with
α,α’-dibromo-p-xylene (DBX)
2.2. Cross-flow filtration system
Membrane selection, in OSN, is usually based on molecular weight cut-off (MWCO) as specified by the manufacturer (U. Razdan, S.V. Joshi & V. J. Shah, 2003). See Toh et al. proposed the use of homologous polymers with steadily increasing molecular weight. Oligomers are ideal for the characterisation of membranes regarding their MWCO due to uniformly increasing monomer units (See Toh, Loh, Li, et al., 2007). A homologous series of styrene oligomers was used allowing to obtain rigorous understanding of the MWCO of the studied membranes, using dead end (Figure 2.2– a)) and cross flow filtration (Figure 2.2– b)) (See Toh, Loh, Li, et al., 2007).
Figure 2.2 – Schematic diagram of separation processes on a membrane: a) dead-end cell and b) cross-flow (Baker, 2004)
Membranes developed in this work, were characterised with polystyrenes (PS) dissolved in acetonitrile (MeCN) (1 g.L-1) only in a cross flow system. Dead end filtration is not ideal, due to poorer hydrodynamics when compared with cross flow (Gibbins, D’ Antonio, Nair, et al., 2002).
Br
Br
N
N
N NH
N
N NH
N NH
N
H N
N
+
n
n
n 80 ºC; 24 h
Feed Feed
Retentate
Permeate Permeate
Materials and Methods
21
The filtration experiments were carried out in a cross-flow filtration apparatus (Figure 2.3 - left) with eight cross-flow cells (Figure 2.3 - right) connected in series holding membranes with an effective area of 14 cm2 each. The feed solution was charged into a 5 L feed tank and re-circulated at a flow rate of 100 L.h-1 using a diaphragm pump. A flowmeter was used to measure the flow rate, provided by the diaphragm pump. The pressure in the system was measured by a pressure gauge located after the pump, and was regulated with a back pressure regulator. Temperature control was provided by a temperature controller connected to a solenoid valve that regulated the flow of cooling water through the heat exchanger located before the feed tank. Permeate samples were collected from individual sampling ports, and feed samples were taken from the feed sampling port situated before the pump. Permeance and rejection were calculated according to Equation 1.2 and Equation 1.3 respectively.
Figure 2.3 – Left - Schematic representation of cross-flow filtration apparatus used for membrane filtrations (P – pressure gauge; F – flow meter; T – thermocouple);
Right - Schematic representation of a filtration cell used for membrane screening in cross-flow conditions; a) top view b) cross section; 1 – Feed port, 2 – Retentate port, 3 – Permeate port, 4 – O-ring,
Materials and Methods
22
2.3. Analytical methods and parameters calculations
2.3.1. Viscosity measurements
The viscosity of the dope solutions was measured using a rotary viscometer from Cannon Instrument Company (Model 2020), with a spindle size 16 suitable for highly viscous solutions. Viscosities were recorded at 20 °C, but with different spindle speeds according to the torque value given by the viscometer. Solutions with higher viscosities needed lower speeds for a more accurate measurement, and vice-versa.
2.3.2. Scanning electron microscopy (SEM)
Scanning electron micrographs of the cross section of membrane samples were taken using a JEOL 5610 LV. In order to remove the impregnated PEG400, the samples were washed with IPA. To prepare
the cross section samples, small squares of the membrane were cut and snapped under liquid nitrogen. They were pasted vertically onto SEM sample holders covered with carbon tape. Finally, the samples were sputtered with gold under argon atmosphere (Emitech K550 coater) to ensure the necessary electron conductivity. The SEM was operated at acceleration voltage of 10 kV.
2.3.3. High Pressure Liquid Chromatography (HPLC)
For the analysis of the styrene oligomers (Figure 2.4), an Agilent 1100 Series HPLC system was used. The separation of the oligomers was achieved using an ACE 5-C18-300 column (Advanced Chromatography Technologies, ACT, UK), and a mobile phase of 35 vol% deionised water and 65 vol% tetrahydrofuran, HPLC grade, with 0.1 vol% trifluoracetic acid in each of them was used. The UV detector was set at 264 nm wavelength.
Materials and Methods
23
2.3.4. Fourier transform – infrared spectroscopy (FT-IR)
To remove traces of residual chemicals and the impregnated PEG400, membrane samples were first
washed with IPA. The samples were fixed on a zinc/selenium diamond plate with the surface facing the beam and infrared spectra were recorded on a Perkin Elmer – Spectrum 100.
2.3.5. Diffusivity parameter
Diffusivity is an important parameter indicative of the diffusion mobility. The higher the diffusivity, the faster diffuse into each other. Equations for predicting diffusivities of liquids are by necessity semi-empirical, since the theory for this not well established as yet. The Wilke-Chang correlation can be used for most purposes where the solvent (A) is diluted in solvent (B) (Geankoplis, 1993). This can be used to calculate and predict the diffusion of the casting solvent in the precipitation bath, e.g. in the water,
Equation 2.1
where T is the temperature in K, MB is the molecular weight of solvent B in g.mol -1
, µB is the viscosity
of solvent B in Pa.s, VA is solvent A molar volume m 3
. g-1.mol-1, and φ is an "association parameter" of the solvent which is 2.6 for water.
Molar volumes were calculated according to a simple additive estimating method suggested by Schroeder. The rule is to count the number of atoms of carbon, hydrogen, oxygen and nitrogen, add one for each double bond, add the triple bonds multiplied by two, subtract any ring in the component, and multiply the result by seven. The rule is quite accurate with an error of 3.9 % in average. Strongly polar substances (DMAc, DMF and MeCN) have an error greater than 10 % (Poling, Prausnitz & O’Connell, 2001) and therefore their values will not be taken into account in this work.
Equation 2.2
2.3.6. Total solubility parameter
The solubility parameter δ is a measure for the interaction force between the molecules in a given molecular structure. The closer the solubility parameter values of two components are, the stronger are the interactions between them and the better is their miscibility. The solubility parameter for PBI was calculated with the group contribution method based on the contribution of the structural groups to the cohesion energy Ecoh (J.mol
-1
Materials and Methods
24
Equation 2.3
To calculate the solubility parameter for different solvent mixtures the following equation was used:
Equation 2.4
where Xi is the mole fraction, Vi – the molar volume and δi – the solubility parameter of a given
component i which can be found in literature.
The partial solubility parameters were calculated for the three interactions occurring in the studied system of polymer (PBI), solvent (DMAc and co/non-solvent) and non-solvent (water) – ∆δP/S is related
to the polymer/solvent affinity; ∆δP/NS – to the polymer/non-solvent affinity and ∆δS/NS describes the
solvent/non-solvent exchange rate during immersion. The following equations were used to calculate the partial solubility parameters:
Equation 2.5
Equation 2.6
Equation 2.7
Finally, to calculate the total solubility parameter (MPa1/2):
Uncrosslinked membranes
25
3. Uncrosslinked
membranes
3.1. Effect of polymer concentration and pressure
3.1.1. Experimental
In order to control the molecular weight cut-off (MWCO), first we must understand the membrane behaviour without inducing any kind of modification in the dope solution composition, or the membrane post-treatment. Therefore, the first experiments were performed with uncrosslinked polybenzimidazole membranes and consisted in a screening of the membranes performance with different polymer concentrations – 17, 20, 23 and 26 wt% of PBI (Table 3.1). Celazole® S26 was diluted with DMAc to obtain the different polymer concentrations and membranes were prepared in accordance with 2.1.2.
Table 3.1 – Summary of prepared IS asymmetric PBI membranes and the physical characteristics of the dope solutions and casting conditions, for the polymer concentration study
Membrane Code Polymer
concentration (%)
Water T (°C)
Room T (°C)
Room humidity (%)
Viscosity (cP)
17UX(01) 17 22 20 28 4 770
17UX(02) 17 22 20 32 5 560
17UX(03) 17 23 20 36 5 570
20UX(01) 20 20.5 20 28 21 400
20UX(02) 20 24 20 44 19 480
23UX(01) 23 20.5 20 28 67 100
23UX(02) 23 23 20 46 67 700
26UX(01) 26 22 20 28 273 600
26UX(02) 26 23 20 46 249 200
To obtain a better understating of PBI membranes, the experiments in this chapter were conducted during 77 hours during which the pressure was increased in 10 bar intervals and held for 24 hours (Figure 3.1). Finally, the pressure was decreased to 10 bar to allow the evaluation of pressure effect on uncrosslinked PBI membranes.
Figure 3.1 – Schematic representation of experimental procedure in chapter 3
10 bar
24
h
20 bar
48
h
30 bar
72
h
10 bar
Uncrosslinked membranes
26
Membrane code: e.g. 17UX(01)
17 – polymer concentration of 17 wt%
UX – uncrosslinked polymer
(01) – batch number 1
3.1.2. Results and discussion
SEM was performed on the membranes to observe how the variation of polymer concentration in the dope solution affects membrane morphology (Figure 3.2). The pictures showed that increasing the concentration of polymer favoured formation of sponge-like structures over macrovoids. Also, it appeared that the top layer and overall membrane thickness increased with increasing polymer content. Consequently, increasing the polymer concentration is expected to result in membranes with high rejection of small MW solutes and low permeance.
Figure 3.2 – SEM pictures of PBI uncrosslinked membranes 17UX, 20UX, 23UX and 26UX
Uncrosslinked membranes
27
Figure 3.3 – Average PS/MeCN permeance, and standard deviation of uncrosslinked PBI membranes with 17, 20, 23 and 26 wt% polymer concentration, at 30 °C with different pressures, for 77 hours
Figure 3.4 – Average PS rejection in MeCN, and standard deviation of uncrosslinked PBI membranes with 17, 20, 23 and 26 wt% polymer concentration, at 30 ºC with different pressures, at 24, 48, 72 and 77 h
0 2 4 20 22 24
0 2 4 6 8 10 12 14 16 18 20 22
26 28 44 46 48 50 52 68 70 72 74 76 78
20 bar 10 bar
P e rm e a n c e (L .m -2 .h -1 .bar -1 )
10 bar 30 bar
Time (h)
17UX(02) 23UX(01)
20UX(01) 26UX(01)
0 600 1200 1800
0 20 40 60 80 100
0 600 1200 1800
0 20 40 60 80 100
0 600 1200 1800
0 20 40 60 80 100
0 600 1200 1800
0 20 40 60 80 100 20UX(01) Re je c ti on ( % )
MW (g.mol-1)
24 h; 10 bar 72 h; 30 bar 48 h; 20 bar 77 h; 10 bar
17UX(02) R e jec ti on ( % )
MW (g.mol-1)
24 h; 10 bar 72 h; 30 bar 48 h; 20 bar 77 h; 10 bar
Rej ec ti o n ( % )
MW (g.mol-1)
24 h; 10 bar 72 h; 30 bar 48 h; 20 bar 77 h; 10 bar
26UX(01) Re je c ti o n ( % )
MW (g.mol-1)
Uncrosslinked membranes
28
During the 77 hours experiment, the permeance decreased in all membranes. There were some fluctuations after each pressure increment, but the permeance would decrease until it stabilised at the respective pressure (Figure 3.3). The permeance was higher in the membranes with lower PBI concentration, confirming what was expected from SEM analysis and literature (Baker, 2004; Mulder, 1996). PS rejection (Figure 3.4) increased over time and since the rejection at 77 hours (10 bar), is much higher than the rejection at 24 hours (10 bar), we can conclude that the polymer chains rearranged when pressure was applied, and do not reorganise upon pressure decrease. This rearrangement is irreversible. It is also possible to observe that this compaction is less pronounced in membranes with higher polymer concentrations (Table 3.2). This effect is likely to be related with the increase of the volume fraction of polymer in the membrane and consequently a lower porosity is obtained, therefore, less free space for the polymer chains to rearrange.
Table 3.2 – Summary of PBI uncrosslinked membranes with different polymer concentrations performance. Initial and final permeances with respective percentage decrease and the MWCO of the
tested membranes at 30 bar
Membrane code
Permeance 1 hr, 10 bar (L.m-2.h-1.bar-1)
Permeance 77 hr,10 bar (L.m-2.h-1.bar-1)
Decrease (%)
MWCO (g.mol-1)
17UX(02) 14.4 9.6 33 > 1 800
20UX(01) 14.6 6.4 56 400
23UX(01) 4.9 3.3 33 700
26UX(01) 1.1 0.9 18 700
3.2. Effect of THF addition
3.2.1. Experimental
Following the previous experiment, the multi-component systems study was ready to be initiated. The polybenzimidazole membrane with 17 wt% of polymer proved to have a high permeance and to be more open, meaning that had a higher MWCO, which would allow good resolution of any impact of the co-solvent in membrane performance within the nanofiltration range.
According to Livingston & Bhole, 2012, tetrahydrofuran showed to be compatible as a non-solvent for PBI dope solution preparation. Uncrosslinked PBI membranes containing 17 wt% solids in DMAc/THF (4:1) mixture were prepared and tested in different solvents. The membranes with THF addition showed improved separation of lower MW solutes as compared to the membranes from pure DMAc (Livingston & Bhole, 2012).
Uncrosslinked membranes
29
(DMAc:THF) in the dope solutions. Membranes were prepared following the procedure described in 2.1.2.
Membrane code: e.g. 17UX4:1THF(01)
17 – polymer concentration of 17 wt%
UX – uncrosslinked polymer
4:1 – DMAc:THF ratio of 4 to 1
THF – co/non-solvent
(01) – batch number 1
Table 3.3 – Summary of prepared IS asymmetric PBI membranes and the physical characteristics of the dope solutions and casting conditions, for the addition of THF study
Membrane Code
Non-solvent
Water T (°C)
Room T (°C)
Room humidity (%)
Viscosity (cP)
17UX4:1THF(01) THF 24 20 42 4 370
17UX4:2THF(01) THF 24 20 42 4 960
17UX4:3THF(01) THF 25 20 46 5 440
17UX4:3THF(02) THF 24 20 40 5 640
3.2.2. Results and discussion
SEM was performed on the membranes to inspect how the addition of THF as a non-solvent to the dope solution affects membrane morphology (Figure 3.5). Pictures showed that membranes cast from dope solutions with higher THF concentration had a more pronounced sponge-like structure with less macrovoids present. It is likely that the addition of THF in the dope solutions induced delayed demixing during phase inversion. As it was explained in 1.1.3 – a), delayed demixing leads to the formation of denser skin layers.
Figure 3.5 – SEM pictures of PBI uncrosslinked membranes 17UX4:1THF, 17UX4:2THF and 17UX4:3THF
Uncrosslinked membranes
30
aprotic solvent, it has a lower polarity index. This means THF has lower affinity to water than DMAc delaying the demixing during the phase inversion. Lower affinity of the non-solvent leads to less macrovoids in membrane structure (Mulder, 1996).
The partition coefficient is also a very useful tool to understand the affinity of solvents to water. This coefficient is the logarithm of the ratio between the concentration of a solute in a mixture of two immiscible hydrophobic (e.g. octanol) and hydrophilic (e.g. water) solvents at equilibrium. Hence, the partition coefficient is a measure of how hydrophilic or hydrophobic a chemical substance is (Leo, Hansch & Elkins, 1971). DMAc has a low partition coefficient, which means, it has high affinity to water (Table 3.4). On the other hand, THF has a positive partition coefficient (Table 3.4), meaning its affinity to water is lower than DMAc. The addition of a solvent with higher partition coefficient as is THF, to the dope solution will delay the demixing process during phase inversion. This means that the two phases (polymer poor and polymer rich) will no longer have time to split, forming less macrovoids across the membrane thickness.
Table 3.4 – Polarity index (Norman B. Godfrey, 1972) and partition coefficient (George Wypych, 2012) of DMAc and THF
Non-solvent
Polarity Index (-)
Partition coefficient (-)
DMAc 6.5 -0.77
THF 4.0 0.46
After calculating, the total solubility parameters for THF as non-solvent in different ratios (Table 3.5), it is possible to observe the same trend Soroko, et al. observed with the addition of 1,4-dioxane in PI dope solutions. Increasing the concentration of THF in the dope solution leads to a higher total solubility parameter, and consequently membranes with less macrovoids would be expected, confirming the total solubility parameter theory described in 1.2.3 (Soroko, Lopes & Livingston, 2011).
Table 3.5 – Total solubility parameter of THF as non-solvent in ratios 4:1, 4:2 and 4:3
Non-solvent
4:1
∆δt (MPa 1/2
)
4:2 4:3
THF 4.21 4.84 5.31
Finally, according to the polarity index, the partition coefficient and total solubility parameter theories the addition of THF to PBI/DMAc dope solutions will favour delayed remixing and reduce the macrovoidal formation which is confirmed by SEM pictures (Figure 3.5).