11
Un nuevo método de procesamiento de imágenes para visualizar el patrón
vascular del Cuello Uterino Humano
Une nouvelle méthode de retraitement de l’image pour visualiser le patron
vasculaire du col de l’utérus de l’être humain
Um novo método de processamento de imagem para visualizar o padrão vascular
do colo uterino humano
Daniel A. Botero-Rosas a
Cristhian J. Murcia Garzón b
Laura M. Roa Barrantes c
José M. Fuentes d Juan S. Leon-Ariza e
A novel image processing method for
visualizing the vascular pattern of Human
Uterine Cervix
*
DOI: http://dx.doi.org/10.21830/19006586.77
Recibido: 15 de septiembre de 2016 • Aceptado: 2 de noviembre de 2016
Cómo citar este artículo: Botero-Rosas, D. A., Murcia, C. J., Roa, L. M., Fuentes, J. M. & León-Ariza, J. S. (2017, enero-ju-nio). A Novel Image Processing Method for Visualizing the Vascular Pattern of Human Uterine Cérvix. Rev. Cient. Gen. José
María Córdova 15(19), 291-306. DOI: http://dx.doi.org/10.21830/19006586.77
*Artículo de investigación derivado del proyecto “Implementación de un método de procesamiento digital de imágenes para resaltar el patrón vascular de imágenes colposcópicas”.
a Autor corresponsal. Universidad de La Sabana, Bogotá, Colombia. <daniel.botero@unisabana.edu.co> b Universidad Distrital Francisco José de Caldas, Bogotá, Colombia. <ingcmurcia@gmail.com> c Universidad Distrital Francisco José de Caldas, Bogotá, Colombia. <lauia01@gmail.com>
d Clinical Laboratory for Prevention in Obstetrics and Gynecology (Previgin), Bogotá, Colombia. <jmfuent@ gmail.com>
Abstract. Cancer of the uterine cervix is a public health problem worldwide. Colposcopy is the commo-nest method employed to visualize human uterine cervix, and to diagnose uterine cervical cancer. When this structure is altered, colposcopy identifies and grades a number of characteristics of the lesions such as sizes, borders, shapes and vascular patterns. However, some drawbacks of the findings obtained by the classical colposcopic method are still unanswered. To improve the quality of the data obtained with col-poscopy, selected images of human cervix were studied; further, a novel processing analysis was done using the top-hat and direct threshold methods. The analysis tree included selection of the image, elimination of frequency of oxyhemoglobin absorption, unsharped mask, treatment of specular highlights, filter approach and adjustment of intensity levels. We found that the top-hat method was superior that the direct thres-hold method to visualize the vascular pattern of human uterine cervix (93,1 % vs 85,1 %; p < 0,05). These findings were unrelated to the filter used. These results may help to increase the likelihood of detecting uterine cervical cancer of humans at earlier stages of the disease than known to date.
Keywords: Colposcopy; Cervical Vascular Patterns; Digital Image Processing; Human Papilloma Virus; Uterine Cervical Cancer.
Resumen. El cáncer del cuello uterino es un problema de salud pública en todo el mundo. El método que más se utiliza para visualizar un cuello uterino humano y para diagnosticar el cáncer de cuello uterino es la colposcopia. Cuando se altera esta estructura, la colposcopia identifica y clasifica una serie de caracte-rísticas de las lesiones tales como tamaños, bordes, formas y patrones vasculares. Sin embargo, continúan sin respuesta algunos inconvenientes con los hallazgos obtenidos por el método clásico colposcópico. Para mejorar la calidad de los datos obtenidos con la colposcopia, se estudiaron imágenes seleccionadas del cue-llo uterino humano. Además, se realizó un nuevo análisis de procesamiento utilizando los métodos top-hat y umbral directo. El árbol de análisis incluyó la selección de la imagen, la eliminación de la frecuencia de la absorción de oxihemoglobina, la máscara no afilada, el tratamiento de los reflejos especulares, el enfoque del filtro y el ajuste de los niveles de intensidad. Se encontró que el método top-hat era superior para visua-lizar el patrón vascular del cuello uterino humano que el método de umbral directo (93,1% vs 85,1%, p <0,05). Estos hallazgos no estaban relacionados con el filtro que se utilizó. Estos resultados pueden ayudar a aumentar la probabilidad de detectar el cáncer de cuello uterino de los seres humanos en las etapas más tempranas de la enfermedad que son conocidas hasta la fecha.
Palabras clave: colposcopia; patrones vasculares cervicales; procesamiento de imagen digital; virus del Papiloma Humano; cáncer de cuello uterino.
Résumé. Le cancer du col utérin est un problème de santé publique dans le monde entier. La méthode qui est utilisée pour visualiser un col de l’utérus humain et de diagnostiquer le cancer du col utérin est colposcopie. Lorsque cette structure est modifiée, la colposcopie identifie et classe un certain nombre de caractéristiques des lésions telles que les tailles, les bords, les formes et les motifs vasculaires. Cependant, certains inconvénients demeurent sans réponse avec les résultats obtenus par la méthode classique colpos-copique. Pour améliorer la qualité des données obtenues avec la colposcopie, les images sélectionnées de l’utérus humain ont été étudiés. En outre, une nouvelle analyse du traitement en utilisant les méthodes
top-hat et seuil directe a été réalisé. L’arbre d’analyse comprend la sélection de l’image supprimant
l’ab-sorption de l’oxyhémoglobine fréquence, le masque unsharpened, le traitement des réflexions spéculaires, le filtre de mise au point et à ajuster les niveaux d’intensité. Nous avons constaté que la méthode top-hat était supérieure à la méthode du seuil direct pour visualiser le profil vasculaire du col utérin humain (93,1% vs 85,1%, p <0,05). Ces résultats n’étaient pas liés au filtre utilisé. Ces résultats peuvent aider à augmenter la probabilité de détecter le cancer du col utérin chez les humains dans les premiers stades de la maladie sont connus à ce jour.
Mots-clés: colposcopie; motifs vasculaires cervicaux; traitement numérique de l’image; du Papillome Humain; cancer du col utérin.
Resumo. O câncer do colo uterino é um problema de saúde pública mundial. A colposcopia é o método mais comum empregado para visualizar o colo uterino humano, e para diagnosticar o câncer de colo de útero. Quando esta estrutura é alterada, a colposcopia identifica uma série de qualidades e características das lesões como tamanhos, bordas, formas e padrões vasculares. No entanto, alguns inconvenientes das descobertas encontrados pela colonoscopia clássica ainda estão sem resposta. Para melhorar a qualidade dos dados obtidos com a colposcopia, foram estudadas imagens selecionadas do colo do útero humano. Além disso, uma nova análise de processamento foi feita usando os metodos de top-hat e entrada direita. A análise da árvore incluiu selecção da imagem, eliminação de frequência de absorção de oxi-hemoglobina, máscara de nitidez, tratamento de realces especulares, abordagem filtro e ajuste dos níveis de intensidade. Descobrimos que o método top-hat foi superior que o método direto para visualizar o padrão vascular do colo uterino humano (93,1% versus 85,1%; p <0,05). Estes resultados não foram relacionados com o filtro utilizado. Estes resultados ajudam a aumentar a probabilidade de detectar a câncer do colo uterino dos seres humanos numa fase precoce do que o conhecido até à data.
Palavras-chave: padrões de colposcopia; cervicais vasculares; processamento digital de imagem: Papiloma Humano Vírus; câncer de colo de útero.
Introduction
Cancer of the cervix is the second commonest life-threatening cancer among women worldwide (Arbyn et al., 2008; Behtash & Mehrdad, 2006). The squamous cell subtype is the most prevalent (Behtash & Mehrdad, 2006; Wang et al., 2004), which is often associated to Human Papilloma Virus (HPV) infection (Nogueira-Rodrigues et al., 2014; Vizcaino et al., 1998; Ferlay et al., 2014; Bosze & Syrjanen, 2010; Mateu-Aragonés, 1969). Studies also have shown that HPV infection produces inflammatory changes in the vascular pattern of the cervix (Clifford et al., 2003; Munoz et al., 2003; Munoz et al., 2004; Peirson et al., 2013; Saslow et al., 2012; Zur, 1982; Franco et al., 2001). The changes in the vascular pattern are believed to be present at early stages of cervical cancer (Guidi et al., 1995). Such changes are often diagnosed by using colposcopy.
Colposcopy developed by Hinselmann, in 1925, is commonly done by direct observation of the uterine cervix (Fusco et al., 2008-1; Zhu et al., 2008; Durdi et al., 2009; Massad et al., 2013; Bappa & Yakasai, 2013). Acetic acid topical application, or acetowhitening, on the suspicious abnormal area is used to improve the visualization of cervical tissue (Schiller, 1933). The appli-cation of the acetic acid induces changes of the colour of the area under study. The new colour of the anatomical area under study ranges from white to gray; such colour change appears when premalignant cells are present. The described chemical reaction is due to a malfunctioning of epithelial cells of the cervix (Reid et al., 1984-1; Mateu-Aragonés, 1964; Coppleson et al., 1993), which is induced by a number of agents, including HPV. This infection disorientates keratin fila-ments in the superficial layers of the squamous epithelium (Zijlstra et al., 1991) hardly observed by colposcopy done by direct observation; further, the abnormal lesions are not easily detected by the Schiller test (Fusco et al., 2008-1; Reid et al., 1984-1), a test that uses iodine (Schiller, 1933), often added to acetowhitening.
Hinselmann created an optical stereoscopic microscope to visualize the cervix using the afo-rementioned technique. Such microscope used incandescent light or white light-emitting diode
(LED) type. It allowed visualizing the morphology of the blood vessels of the cervix (Fusco et al., 2008-2). Kraatz (1939) used a green filter on the light beam to highlight the vascular pattern, which this author contrasted with the tissue background. More recently, Mateu-Aragonés (1964; 1979) proposed the vascular pattern of the suspicious tissue to classify lesion severity (Coppleson et al., 1993; Zijlstra et al., 1991; Lickrish, 2000; Reid et al., 1984-2); however, this classification was mainly based on clinical observations. Limitations of current optic methods or disturbed visual acuity preclude the detection of critical fine vascular changes that are key elements of lesioned tissue to make an accurate and timely diagnosis (Vlachokosta et al., 2013). Thus, state-of-the-art imaging techniques such as the ones we demonstrate in this research may be of value to improve early diagnosis of cervical cancer (Durdi et al., 2009; Xue et al., 2007-1; Xue et al., 2007-2).
As a fact, digital techniques using appropriate filters make feasible to observe key elements of the cervical tissue (Lee & Park, 1990; Shamir et al., 2008), modulating technical details such as brightness and contrast. Germane to this, segmentation techniques have allowed differentia-ting vascular anomalies of the cervix including vascular loops and webs (Srinivasan et al., 2009; Xue et al., 2010; Mehlhorn et al., 2012; Lee & Park, 1990; Shamir et al., 2008; Srinivasan et al., 2007; Dvir et al., 2006; Lehmann & Palm, 2006; Zimmerman-Moreno & Greenspan, 2006). However, at present, none of the above mentioned biotechnological improvements have properly made possible to highlight the vascular pattern of the uterine cervix. This research aims to fill this gap. Thus, we developed a novel method using digital image processing. This method looks for enhancing the vascular patterns of uterine cervical tissue in images obtained by digital colpos-copy; the results of this investigation will help to detect lesions of human cervix at earlier times than done at present.
Methods
Selection of the picture (step Io, figure 4)
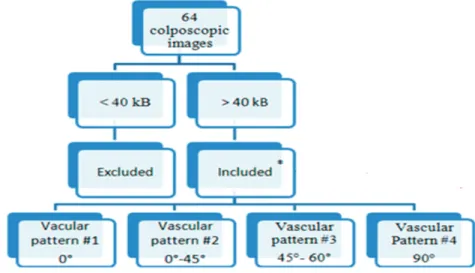
For this research, which was approved by the Institutional Review Board of Mediciencias Research Group, we selected 64 colposcopic images from our databank. The images were zoomed at 15x (Leisegang Optik TM model 2 colposcopy, Berlin, Germany). The digital camera that took the photographs had a resolution of four mega-pixels. The images were stored in Joint Photographic Experts Group (JPEG) format. Then, the pictures were pseudorandomly selected according to defined criteria. The inclusion criteria of the samples we selected took into account any injury observable during the colposcopic procedure, including inflammation or regions with suspected noninvasive cancer. An exclusion criterion was that the images had less than 40 kB; we also ex-cluded images found more than once in the list searched at the data bank (Figure 1). The final sample was composed of four images.
Figure 1. Diagram of the inclusion and exclusion criteria. Source: Diagram created by authors.
Selection of the wavelength of interest (WOI) (step I1, figure 4)
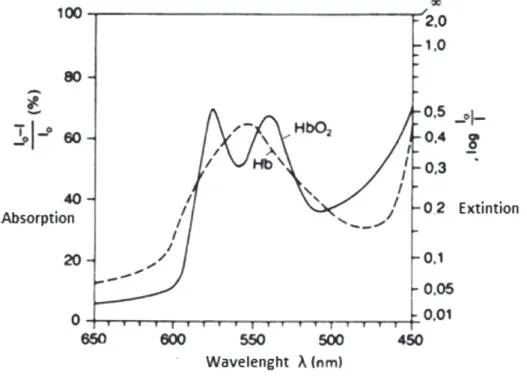
The electromagnetic band between 500 nanometers (nm) and 600 nm (Figure 2) has two he-moglobin related peaks above the baseline (Figure 3). The first peak appears at 541 nm, and the second peak at 577 nm (Zijlstra et al., 1991) (Figure 2). Accordingly, we selected WOIs of the image localized at the green band of the electromagnetic spectrum, which has between 500 na-nometers (nm) and 600 nm (Figure 2) to properly detect oxyhemoglobin from the colposcopic images, in a red-green-blue (RGB) model.
Figure 2. Wavelengths of interest found in the green component (G) of the RGB model Source: Image designed by authors.
Figure 3. Light absorption spectrum of oxyhemoglobin (HbO2) and deoxyhemoglobin (Hb). Source: Thews, G & Mutschler, E. (1983). Anatomía, fisiología y fisiopatología del hombre.
Unsharped mask (step I2, figure 4)
To better analyze the blood vessels of the cervix, unsharped mask was added. To accomplish this, a Laplacian filter was used. This filter enhances image regions having that display high frequency levels; in making so, it is possible to achieve a much better contrast of the image. The Laplacian filter was constructed as follows: First, a negative Laplacian matrix He was defined [Equation 1]. Second, a vector named to as alpha (α), which is a constant number that ranges between zero and one, was used to control the shape of the Laplacian filter (Zimmerman-Moreno & Greenspan,
2006). The Unsharped image (I2) obtained was the result of the convolution of He and the
origi-nal image (I1) [Equation 2].
(1)
Treatment of specular highlights (step I3, figure 4)
A specular highlight is the spot of light that appears on objects when they are lighted up. In our case, the fluids of the cervical mucosa produced such specular highlights (Dvir et al., 2006). In image processing techniques, methods that improve the quality of the image such as lighting, saturation and OTSU threshold method (Srinivasan et al., 2007; Lehmann & Palm, 2001) are commonly used. However, such methods lack specificity to correct non uniform illumination of the image under study. Therefore, better methods have to be considered. In this line, top-hat methodology allows extracting the information needed from pictures in a better way than the mentioned above. Thus, we used it. The equation 3 shows the difference between the images ob-tained in the step I1 minus the opening operation using a circular structure element EETH; it was done assuming that the brightness approximated to spotted shapes.
The opening operation produced mathematical erosion; for this reason, the image was ex-panded. Of note, this operation allowed obtaining a better definition of the object’s edges, with a simultaneous increase in the pixel size.
Specular highlights are those ITH that have values higher than the threshold named to as Uo. This threshold was determined by the OTSU threshold method, which consists in the separation of pixels in two forms named to as foreground and background pixels (Lehmann & Palm, 2001). Thus, the threshold value was calculated taking the minimal intra-class variance (Otsu, 1979). The obtained data were then masked by M [Equation 4].
To improve the quality of the image, a Laplace interpolation method was also used (Zimmerman-Moreno & Greenspan, 2006). It was done by dilating the M mask with a structuring element
named to as EED [Equation 5]. This manipulation ensured that the M1 mask covered the
high-lights, before to use the Laplace interpolation.
The Laplace interpolation method (∇2) allows assign an intensity function named to as y(x), using known points y1 of I1 stage, as shown in equation 6. After this, we solved the equation (7) for each unknown points. The Laplacian operator ∇2 was interpolated to improve the quality of the image.
(3)
(4)
(5)
(6) (7)
Low-pass filtering (step I4, figure 4)
Following the technique described by Tomazevic et al (2002), we created an image called IPB,
which was obtained after convoluting it. Such convolution was the result of multiplying I1i times H as shown in equation 8. Hm in equation 9, corresponded to the average low-pass filter, and Hg in equation 10, corresponded to the Gaussian filter. M, N and σ values were not changed at the frequency values of interest, as shown in equation 11. This conserved both, the smooth changes coming from the illumination procedure, and the changes produced by variations of the intensity in the tissue.
Adjustment of intensity levels of pixels (step I5, figure 4)
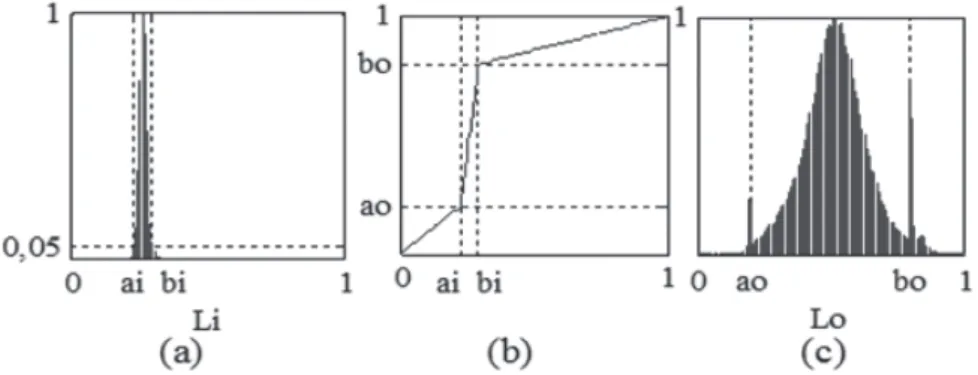
In this step, we used a linear transformation function T (l) [equation 12]. The equation 12 repre-sents the light intensity of each pixel. ai and bi are two values obtained at the initial moment of the light intensity. They corresponded to the minimum and maximum of the intensities range, where the normalized histogram exceeded 5% of the total of the pixels under study. These data were converted in two new values of intensity named to as ao and bo (they corresponded to the values obtained among those that desired redistribute the new histogram). Such conversion was done for redistributing the intensity of the pixels within the range of available intensities.
(8)
(10) (9)
(11)
(13)
Li showed a new intensity distribution, which was obtained from Lo levels as shown in (Equation 13).
The histogram of the resulting image from the illumination correction (I3, figure 4 and figure 5) was concentrated in a particular area; it did not occupy the entire range of intensity levels. Using the transformation function T (L), an image with higher contrast was obtained (I4, figure 4). As a result, the levels of the I3 image are distributed in a wider range of intensities currents as shown in Figure 5. Lastly, the values obtained by top-hat method were statistically compared with the values obtained by direct threshold method. Chi-square was used to compare proportions. P value was setup at 0.05.
Figure 4. Block diagram of the step-by-step methodology followed-up for enhancing the blood vessels of cer-vical colpophotographies.
Figure 5. Setting intensity levels. (a) Histogram of normalized levels without adjustment, (b) Transformation function intensity levels, (c) Histogram normalized levels adjustment from the transformation function. Source: Graphic designed by authors.
Results
A full description of the results is presented in figure 6. In (a) a green layer of the original image is shown; (b) shows the Interpolation of specular highlights; (c) presents the filtering process; (d) allows knowing Correction of illumination, and (e) reports adjustment of intensity levels.
In figure 7, two original colposcopic images were included. The first image (1a) showed hi-ghlights whereas the second image (2a) did not. In figure 7b, it was observed the data obtained after treating specular highlights using the direct method. In figure 6c, the image was analyzed using the top-hat method. It was found that with the direct method, highlights were not detected in the darkest region (figure 7, 1b). In absence of highlights, artifacts were detected (figure 7, 2b). Using the top-hat method the opposite occurred.
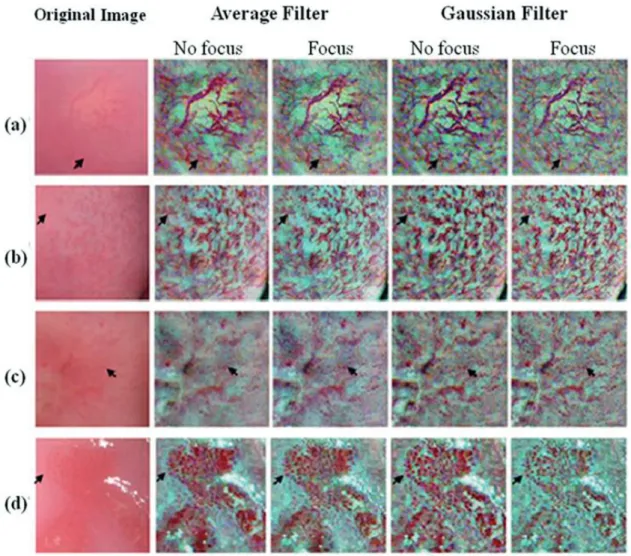
In figure 8, sections of vascular images obtained from colposcopy showed hairpined (a), clo-thed (b) and dotted patterns (c, d). After performing the enhancement process in the three layers of the RGB model, a color image was obtained. In (c) the vascularization pattern was highlighted in a dotty-shape like form that was not evident prior to processing. In (d), a lesion on the squa-mous epithelium was also observed. Of note, this lesion was unseen in the original image obtai-ned, due to the lack of observation of internal vascularization. It must be emphasized that once the enhancement was made, the vascular structures on the affected region were better observed; therefore, the contour of the injury delineates better. Additionally, when comparing average filter and Gaussian filter, there were not differences in the drawing of the vascular network; hence, any of these filters would offer similar results.
When Tomazevic et al (2002) compared different methods to correct non-uniform illumi-nation, aimed for the method of entropy minimization as the best in performance. This method enables the identification of artifactual highlights, without modifying the actual intensities of tissue itself. In our study, when the direct threshold method was compared with top-hat method, the highlights were not detected at the darkest region; while using top-hat method, those
high-Figure 6. Process of contrast enhancement in the green coat RGB model for the enhancement of vasculariza-tion. (a) green layer of the original image; (b) Interpolation of specular highlights; (c) Low frequencies from Gaussian filter; (d) Correction of illumination; (e) Adjustment of intensity levels.
Figure 7. Two colposcopic images (a1, a2) after processing specular highlights. Note that when applying direct threshold method, no highlights were detected in the darkest region (arrow in figure 7-1b). When highlights de-creased, artifacts were detected (star in figure 7-1c). Using the top-hat method, the opposite happened (7-2b, 2c). Source: Image processing taken by authors.
Figure 8. Sections of colposcopic images for vascular patterns: hairpin (a), cloth (b) and dotted (c, d). The columns show the enhancement of vascularization after filtering.
Source: Image processing taken by authors.
lights can be detected independent of illumination. Additionally, when evaluating highlights of the whole image the true positive findings obtained by using the top-hat method allowed to iden-tify 93,1 % of them, whereas the direct threshold method identified 85,1 % of such highlights (p < 0.05). For this reason, this work used the top-hat method for detection of specular highlights in the images.
For the images under study, we found that the average filter without approach has less noise, but in regions where there is variation in intensity, shadows or artifacts that affect the reading of the test is presented, as in the contour of the lesion in Figure 7 (b). Gaussian filter with greater
emphasis and contrast of the vasculature was achieved by reducing the presence of artifacts; howe-ver, a slight increase in noise was observed.
Discussion
A novel way of enhancing vascularization in colposcopic images has been uncovered in this re-search by using the top-hat method. It is accepted that the top-hat methodology may similarly use average filter or Gaussian filter. Of note, the average filter has less noise than the Gaussian filter. However, some caveats have to be kept in mind when using the average filter. This filter picks up more artifacts in regions of interest where uneven intensity occurs, and also, it retains the shape and size of blood vessels simultaneously accentuating the noise present in the image.
To accurately use the techniques reported here, it has be kept in mind that there a number of intensities that are visible when picturing colposcopic images. One of the intensities refers to highlights (Lehmann & Palm, 2001); other intensities refer to actual lesions in uterine cervical tissues. Such unwanted and mixed visual information can give inaccurate results. Because of the-se shortcomings, computational analysis of the colposcopic images has been worked out during recent years (Zimmerman-Moreno & Greenspan, 2006) leaving still some open questions due to the differences in the imaging patterns displayed by the aforementioned intensities. In this regards, top-hat methodology has filled out the gaps, as demonstrated here.
It should be noticed that the top-hat method used by us in this research, allowed impro-ving in a very significant way the detection of the abnormal vascular pattern as well as the actual morphology and size of the blood vessels of cervical tissue with a low cost-technology. These results might help to increase the likelihood of making the diagnosis of uterine cervical cancer in humans at earlier stages of the disease than done until present. These findings will also help to do a better characterization of cervical lesions than previously done (Xue et al., 2007-2) in both develop and developing countries; moreover, this research could be the basis of improving the visualizing of vascular patterns elsewhere in the body.
Conclusions
The digital analysis of the images expressing oxyhemoglobin, uncovered with this research, accu-rately defines the size and shape of the blood vessels of the uterine cervix. This novel methodology improves the visualization of the vascular pattern in colposcopic images, allowing making a more accurate staging of uterine cervical cancer.
Acknowledgments
The authors would like to thank Dr. F. E. Leon-Sarmiento for his kind advice and help during the preparation of the manuscript.
References
1. Arbyn, M., Castellsague, X., de Sanjosé, S., Bruni, L., Saraiya, M., Bray, F., et al. (2008). Worldwide burden of cervical cancer in 2008. Ann Oncol 22:2675-2686. 2. Bappa, L.A. & Yakasai, I.A. (2013). Colposcopy: the
scien-tific basis. Ann Afr Med 12:86-89.
3. Behtash, N. & Mehrdad, N. (2006). Cervical cancer: screening and prevention. Asian Pac J Cancer Prev 7: 683-686.
4. Bosze, P. & Syrjanen, K. (2010) Tissue-based classification of HPV infections of the uterine cervix and vagina (muco-sal HPV infections). Eur J Gynaecol Oncol 31:605-611. 5. Clifford, G.M., Smith, J.S., Plummer, M., Munoz, N. &
Franceschi. (2003). Human papillomavirus types in inva-sive cervical cancer worldwide: a meta-analysis. Br J Cancer 88:63-73.
6. Coppleson, M., Dalrymple, J.C. & Atkinson, K.H. (1993). Colposcopic differentiation of abnormalities arising in the transformation zone. Obstet Gynecol Clin North Am 20:83-110.
7. Durdi, G.S., Sherigar, B.Y., Dalal, A.M., Desai, B.R. & Malur, P.R. (2009). Correlation of colposcopy using Reid colposcopic index with histopathology- a prospective study. J Turk Ger Gynecol Assoc 10:205-207.
8. Dvir, H., Gordon, S. & Greenspan, H. (2006) Illumination correction for content analysis in uterine cervix images. In: Proceedings Conference on Computer Vision Pattern Recognition Workshop (CVPRW’06), Tel-Aviv, Israel. 9. Ferlay, J., Soerjomataram, I., Ervik, M., Dikshit, R.,
Eser, S., Mathers, C. et al. (2014). Cancer Incidence and Mortality Worldwide: IARC Cancer Base No. 11 (Internet) Accessed September 14.
10. Franco, E.L., Duarte-Franco, E. & Ferenczy, A. (2001). Cervical cancer: epidemiology, prevention and the role of human papillomavirus infection. CMAJ 164:1017-1025. 11. Fusco, E., Padula, F., Mancini, E., Cavaliere, A. & Grubisic,
G. (2008-1). History of colposcopy: a brief biography of Hinselmann. J Prenat Med 2:19-23.
12. Fusco, E., Padula, F., Mancini, E., Cavaliere, A., Grubisic, G. (2008-2). History of colposcopy: a brief biography of Hinselmann. J Prenat Med 2:19-23.
13. Guidi, A.J., Abu-Jawdeh, G., Berse, B., Jackman, R.W., Tognazzi, K., Dvorak, H.F. et al. (1995). Vascular permea-bility factor (vascular endothelial growth factor) expression and angiogenesis in cervical neoplasia. J Natl Cancer Inst 87:1237-1245.
14. Kraatz, H. (1939). Farbfiltervorschaltung zur leichteren Erlernung der Kolposkopie. Zbl. Gynaek 63: 2307–2309.
15. Lee, Y.H. & Park, S.Y. (1990). A study of convex/con-cave edges and edge-enhancing operators based on the Laplacian. IEEE 37: 940-946.
16. Lehmann, T.M. & Palm, C. (2001). Color line search for illuminant estimation in real-world scenes. J Opt Soc Am A Opt Image Sci Vis 18:2679-2691.
17. Lickrish, G.M. (2000). Colposcopy in the management of cervical intraepithelial neoplasia: Problems and sugges-tions. J Soc Obstet Gynaecol Can 22:429-434.
18. Massad, L.S., Einstein, M.H., Huh, W.K., Katki, H.A., Kinney, W.K., Schiffman, M. et al. (2013). Updated con-sensus guidelines for the management of abnormal cervi-cal cancer screening tests and cancer precursors. Obstet Gynecol 121:829-846.
19. Mateu-Aragonés, J.M. (1964). Importance of the vascular picture in colposcopic exploration. classification of the vas-cular images. Acta Gynaecol Obstet Hisp Lusit 13:231-252. 20. Mateu-Aragonés, J.M. (1969). Atypical lesions of the cer-vix epithelium. Clinical and histological study. Acta Obstet Ginecol Hisp Lusit: 1-52.
21. Mateu-Aragonés, J.M. (1979). Epidemiology of endome-trial cancer I. Increase in its frequency. Acta Obstet Ginecol Hisp Lusit 27:515-522.
22. Mehlhorn, G., Kage, A., Munzenmayer, C., Benz, M., Koch, M.C., Beckmann, M.W. et al. (2012). Computer-assisted diagnosis (CAD) in colposcopy: evaluation of a pilot study. Anticancer Res 32:5221-5226.
23. Munoz, N., Bosch, F.X., Castellsague, X., Diaz, M., Hammouda, D. et al. (2004). Against which human papil-lomavirus types shall we vaccinate and screen? The interna-tional perspective. Int J Cancer 111:278-285.
24. Munoz, N., Bosch, F.X., Herrero, R., Castellsague, X., Shah, K.V. et al. (2003). Epidemiologic classification of human papillomavirus types associated with cervical can-cer. N Engl J Med 348:518-527.
25. Nogueira-Rodrigues, A., Ferreira, C.G., Bergmann, A., Aguiar, de S.S., Thuler, L.C. (2014). Comparison of ade-nocarcinoma (ACA) and squamous cell carcinoma (SCC) of the uterine cervix in a suboptimally screened cohort: A population-based epidemiologic study of 51,842 women in Brazil. Gynecol Oncol: in press; doi: 10.1016/j.ygy-no.2014.08.014.
26. Otsu, N. (1979). A Threshold Selection Method from Gray-Level Histograms. IEEE Trans Syst Man Cybern B Cybern 9: 62-66.
27. Peirson,L., Fitzpatrick-Lewis, D., Ciliska, D. & Warren, R. (2013). Screening for cervical cancer: a systematic review and meta-analysis. Syst Rev 2:35.
28. Reid, R., Stanhope, C.R., Herschman, B.R., Crum, C.P. & Agronow, S.J. (1984-1). Genital warts andcervical cancer IV. A colposcopic index for differentiating subclinical pap-illomaviral infection from cervical intraepithelial neoplasia. Am J Obstet Gynecol 149:815-823.
29. Reid, R., Herschman, B.R., Crum, C.P., Fu, Y.S., Braun, L., Shah, K.V. et al. (1984-2). Genital warts and cervical cancer. V. The tissue basis of colposcopic change. Am J Obstet Gynecol 149:293-303.
30. Saslow, D., Solomon, D., Lawson, H.W., Killackey, M., Kulasingam, S.L. & Cain, J.M. (2012). American Cancer Society, American Society for Colposcopy and Cervical Pathology, and American Society for Clinical Pathology screening guidelines for the prevention and early detection of cervical cancer. J Low Genit Tract Dis 16:175-204. 31. Schiller, W. (1933). Early diagnosis of carcinoma of the
cervix. Surg Gynecol Obstet 66: 210–220.
32. Shamir, L., Orlov, N., Mark-Eckley, D., Macura, T.J. & Goldberg, I.G. (2008). IICB 2008: A Proposed Benchmark Suite for Biological Image Analysis. Med Biol Eng Comput 46: 943–947.
33. Srinivasan, Y., Corona, E., Nutter, B. & Mitra, S.B. (2009). A unified model-based image analysis framework for automated detection of precancerous lesions in dig-itized uterine cervix images. IEEE J Select Topics Signal Processing 3: 101-111.
34. Srinivasan, Y., Yang, S., Nutter, B., Mitra, S., Phillips, B. & Long, R. (2007). Challenges in automated detection of cervical intraepithelial neoplasia. Proc SPIE 6514, 65140F. 35. Tomazevic, D., Likar, B. & Pernus, F. (2002). Comparative
evaluation of retrospective shading correction methods. J Microsc 208:212-223.
36. Vizcaino, A.P., Moreno, V., Bosch, F.X., Munoz, N., Barros-Dios, X.M., Parkin, D.M. (1998). International trends in the incidence of cervical cancer: I. Adenocarcinoma and adenosquamous cell carcinomas. Int J Cancer 75:536-545.
37. Vlachokosta, A.A., Asvestas, P.A., Gkrozou, F., Lavasidis, L., Matsopoulos, G.K. & Paschopoulos, M. (2013). Classification of hysteroscopical images using texture and vessel descriptors. Med Biol Eng Comput. 51:859-67. 38. Wang, S.S., Sherman, M.E., Hildesheim, A., Lacey, J.V.
& Devesa, S. (2004). Cervical adenocarcin and squamous cell carcinoma incidence trends among white women and black women in the United States for 1976-2000. Cancer 100:1035-1044.
39. Xue, Z., Antani, S., Rodney, L.R.; Jeronimo, J. & Thoma, G.R. (2007-1). Comparative Performance Analysis of Cervix ROI Extraction and Specular Reflection Removal Algorithms for Uterine Cervix Image Analysis. Proc SPIE 6512: 65124I-1-9.
40. Xue, Z., Antani, S., Long, L.R., Jeronimo, J. & Thoma, G.R. (2007-2). Investigating CBIR techniques for cervico-graphic images. AMIA Annu Symp Proc 826-830. 41. Xue, Z., Long, L.R., Antani, S., Neve, L., Zhu, Y. &
Thoma, G.R. (2010). A unified set of analysis tools for uterine cervix image segmentation. Comput Med Imaging Graph 34:593-604.
42. Zhu, Y., Huang, X., Wang, W., Lopresti, D., Long, G.R. & Antani, S. (2008). Balancing the Role of Priors in Multi-Observer Segmentation Evaluation. J Signal Process Syst 55:185-207.
43. Zijlstra, W.G., Buursma, A., Meeuwsen-van der Roest, W.P. (1991). Absorption spectra of human fetal and adult oxyhemoglobin, de-oxyhemoglobin, carboxyhemoglobin, and methemoglobin. Clin Chem 37:1633-1638.
44. Zimmerman-Moreno, G. & Greenspan, H. (2006). Automatic detection of specular reflections in uterine cer-vix images. Proc. SPIE 61446E.
45. Zur, H.H. (1982). Human genital cancer: synergism be-tween two virus infections or synergism bebe-tween a virus infection and initiating events? Lancet 2:1370-1372.