The 1st International Electronic Conference on the Hydrological Cycle (CHyCle-2017), 12 - 16 November 2017; Sciforum Electronic Conference Series, Vol. 1, 2017
Conference Proceedings Paper
Assessment of large-scale circulation and societal
impacts - The hydro-geomorphologic event in
Portugal, February 1979
Luis Rebelo 1, Alexandre Ramos 1,Susana Pereira 2 and Ricardo Trigo1
Published: 05/11/2017
Academic Editor: Anita Drumond
1 IDL, University of Lisbon, Lisbon, Portugal; lamrebelo@fc.ul.pt
2 Centro de Estudos Geográficos, Instituto de Geografia e Ordenamento do Território, Universidade de
Lisboa, Lisboa, Portugal; susana-pereira@campus.ul.pt * Correspondence: amramos@fc.ul.pt
Abstract: Intense mid-latitude cyclones coming from the North Atlantic often impinge extreme
weather conditions over large swaths of the Iberian Peninsula and are often associated with major human, social and economic damages. Towards this aim this study proposes to evaluate the major impacts and driving meteorological mechanisms involved in the production of the 5-16 February 1979 extreme precipitation and hydro-geomorphological event. This study focuses on the high-resolution characterization of the anomalous precipitation patterns produced over Iberia during this 15-day period and on the quantification of its precipitation nature at the daily and multiday scales. Additionally, the meteorological drivers at the synoptic scale during the precipitation event are also evaluated making use of gridded level fields reanalyses to estimate the weather types influencing the magnitude of the precipitation. The February 1979 event is framed within a three-week period of very high multi-day precipitation totals for most of the Portuguese continental territory associated to days of wet Circulation Weather Types, i.e. cyclonic, west or southwest types. The predominance of western directional circulation types over or near Iberia during this period points towards the presence of a significant low-pressure system driving the North Atlantic weather dynamics at the synoptic scale; while additionally the presence of Atmospheric Rivers reaching western Iberia adds to the advection of Atlantic moisture towards the continent, and to its precipitable water content.
Keywords: Floods; Landslides; Extreme Precipitation; Circulation Weather Types; Atmospheric
Rivers; Natural Disasters.
1. Introduction
Western Iberia is frequently struck by intense mid-latitude cyclones originated in the North Atlantic basin and often impinging extreme weather conditions over large swaths of the Iberian Peninsula (IP). It has been well known that extreme precipitation events in Portugal occurring during winter months (December-March) are often associated with landslides, flooding in the major river basins ([1] and [2]), and, with flash floods mostly located in small watersheds or urban areas [3], which can produce socio-economic impacts. Thus, there is a clear need for better characterization of extreme phenomena and the nature of their driving mechanisms in order to prevent and manage the associated impacts and risks.
The characterization of past floods and landslides with important human consequences in Portugal since 1865 to nowadays has been undertaken recently, within the context of the DISASTER
2
project [4]. Using this database, some event specific studies have been undertaken aiming to characterize the respective meteorological drivers and the related weather circulation conditions present at both the meso and synoptic scales, including the presence (if any) of atmospheric rivers (ARs) over western Iberia or on the modes of circulation regionally established. In this event specific context, Trigo et al. (2014) [2] studied the outstanding record flood event of Tagus and Guadiana in December 1876; Trigo et al. (2016) [3] evaluated the deadliest flash flood event that occurred over Lisbon Metropolitan Area in November 1967; Zêzere et al (2014) [1] characterised the impact of the extreme DISASTER event of December 1909 floods on the Duero basin; and Fragoso et al. (2012) [5] studied the February 2010 flash floods in Madeira. Generally, these studies show that DISASTER events with significant economic and human impacts are usually associated with precipitation events co-located with specific wet-prone Circulation Weather Types (CWTs) and sometimes combined with the presence of Atmospheric Rivers (ARs).
For this work we have selected to study the top ranked event in the DISASTER database regarding the total number of affected people for both Portugal and the Tagus basin (18578 and 9861, respectively), that occurred between 5-16 February 1979.
2. Methods and Dataset
2.1. Historical Data Sources
The human impacts of the February 1979 event were obtained from the DISASTER Database, updated for the period 1865-2015. The entry criteria for the database are the following: any flood or landslide that, independently of the number of affected people, caused casualties, injuries, evacuated or homeless people reported by national and regional newspapers [4].
A DISASTER case is a unique hydro-geomorphologic occurrence, which fulfils the DISASTER database criteria and is related to a unique space location and a specific period. Each DISASTER case includes details on the physical process characteristics and on its associated human and structural damages [4]. DISASTER cases were located using a point shapefile.
DISASTER cases are grouped in a more restrict number of DISASTER events sharing the same trigger in time, according to the following criteria: (i) include at least 3 Disaster cases; (ii) include Disaster cases with 3 or less interval days; (iii) Disaster events must have spatial coherence.
2.2. 20th Century Reanalysis Dataset v2
All large-scale meteorological data was extracted from the 20th Century Reanalysis (20CR) dataset v2 (NOAA/ERSL PSD), spanning the period between 1851 and 2014 (see [7]). This includes level fields of mean sea level pressure, surface level precipitation and Integrated Vapour Total (IVT).
2.3. Precipitation Data
A daily gridded precipitation dataset for the IP was used in this work (IB02) [8]. This dataset spans from 1950 to 2008 with a resolution of 0.2º latitude–longitude grid and is based on a dense
3
network of rain gauges (up to 2000 for Spain and 800 for Portugal). This large number of rain gauges is crucial to allow meaningful regional assessment of extreme precipitation over medium-sized river basins.
The estimation of the accumulated precipitation percentiles along the hydrological year was derived from the calculation of the daily accumulated precipitation values obtained from the 6-hr precipitation 20CR v2 dataset forecasts. This option is justified since it allows to obtain a more reliable daily percentile distribution for a larger sampling of hydrological years precipitation (1851-2014).
2.4. Precipitation magnitude
The aggregate magnitude of the February 1979 precipitation event was obtained using the same methodology devised previously in [3] for the estimation of the multi-day precipitation extremes. This method allows to characterize each day (or set of days) considering the severity of the precipitation event, as well as, the associated spatial extension. This method uses the 2std threshold departure from climatological daily precipitation to identify where significant extreme precipitation phenomena occurs over Iberia, on each evaluated day. This threshold is justified since it corresponds approximately to the 95th percentiles of the daily precipitation distribution throughout the Iberia domain in the extended winter months, thus ensuring a robust limit for assessing daily precipitation extremeness [3].
2.5. Circulation weather types
In this study we applied the circulation weather types (CWT) classification methodology developed for Portugal [6]. This method takes into account physical and geometrical considerations, including the direction and strength of airflow, the direction and vorticity of geostrophic flow, and the signal and intensity of cyclonicity.
2.6. Atmospheric Rivers
The methodology proposed by Ramos et al. (2015) [9] was used to identify the ARs that affected Western Iberian Peninsula during this event, by means of using the Integrated Vapour Total (IVT) computed with the 20CR v2 dataset obtained from NOAA/ERSL PSD. They adapted previous methodologies [10, 11].
3. Results
3.1. Socio-economic impacts
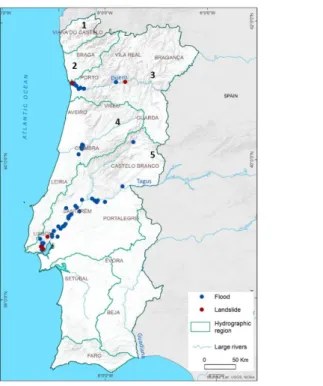
The IP was affected during this event mainly along the margins of the Douro, Mondego and Tagus rivers. A total of 67 reported hydro-meteorological Disaster cases: 62 floods and 5 landslides were reported. For the Douro and Mondego basins the damaging floods tend to concentrate in the cities of Oporto and Coimbra, respectively, while in the Tagus basin the floods appear distributed
4
along several riverside localities of the lower Tagus valley, namely, Santarém, Abrantes, Vila Franca de Xira and other smaller villages (Figure 1).
Figure 1. Flood and landslide disaster cases from 5-16 February 1979 event in Portugal. Green contour lines delimit the spatial domain of (1) Minho Basin; (2) Lima and Cávado basins; (3) Douro Basin; (4) Águeda, Mondego, and West basins; (5) Tagus Basin.
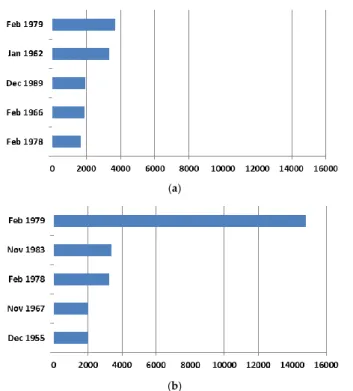
The February 1979 event corresponds to the top ranked event in the DISASTER database regarding the total number of affected people (18578). Moreover, this event is also the top one in each of the Tagus and Douro basins, when the top 5 events are considered individually (Figure 2). The Tagus basin was the most heavily affected during this event with almost the double of total affected people than those reported for the Douro basin (Figure 2).
5
(a)
(b)
Figure 2. (a) Top five ranked Disaster events regarding the total number of affected people in the Douro basin; (b) Top five ranked Disaster events regarding the total number of affected people in the Tagus basin.
Most of the damages resulted on homeless and evacuated people (14322 and 4244, respectively). We should also notice that all of the eight casualties registered during this event were caused by landslides. For the Tagus basin, seven flash flood cases were reported, all of them on the 10th of February in the city of Lisbon and nearby cities of Loures and Odivelas.
3.2 Precipitation events and CWTs
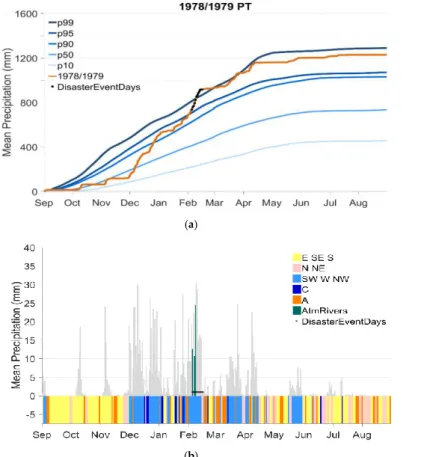
Accumulated precipitation affecting Portugal during the 1979 event (Figure 3a) shows that this evolved from slightly over the 95th percentile threshold of the hydrologic year’s climatological series on 5 February to well above the 99th percentile threshold by 16 February. This suggests that a period of continuous very intense precipitation occurred over Portugal during the event. Additionally, on a longer time-scale the entire winter season (Dec-Mar) shows a very strong accumulation trend as well,
6
particularly taking into account that the hydrological year was dry at the beginning of the season (little over the 10% accumulation threshold for the season).
Figure 3b shows the CWT values and daily average precipitations for the hydrologic year. We can see that from mid-January onwards until 16 February (end of the event), the predominant daily CWTs over IP are the directional wet CWTs with a western component (SW, W and NW) and that they coincide with a period spanning several days of high precipitation values.
(a)
(b)
Figure 3. (a) 1978/1979 climatological year precipitation accumulation over Portugal (orange line) plotted against the respective 10, 50, 90, 95 and 99 percentile thresholds (from the bottom to the top) of the climatological series; (b) Estimated daily CWT values (bottom coloured bars) and the corresponding daily mean precipitation values (grey columns).
7
This same relationship can be observed on several other multi-day periods during the hydrologic year, particularly during the December to March winter season, where the cyclonic (C) CWT also becomes a factor. Furthermore, we can see that there are three days during the event which are affected by the occurrence of persistent ARs reaching western IP (5, 7 and 8 February), which enhances the advection of moisture towards the IP western coast during the event.
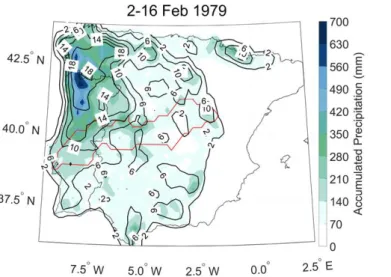
Figure 4 shows the standard deviation anomalies produced by the total accumulated precipitation during the 15-day event over the IP domain. The multiday event produced high values of standard deviation anomalies for most of the IP domain, with the highest standardized anomalies over Portugal, being found, on the Minho and Douro basin (> 18 std), followed by the Águeda, Mondego, and West basins (> 10 std and 14 std) and the Tagus basin (> 6 std, 10 std and 14 std).
Figure 4. Precipitation standard deviation anomalies over the IP (isolines) and accumulated precipitation (shaded) for the 2-16 February 1979 precipitation event; the Tagus basin is contoured with a red line;
4. Discussion
The February 1979 event is the top ranked event in the DISASTER database (since 1865) regarding human impacts for each one of the two main Portuguese river basins affected – Douro and Tagus. This event is mainly characterized by progressive flooding occurring along the lowland sectors of each basin’s main river, with the majority of the cases and affected people concentrating along the Tagus river floodplain.
The February 1979 event is framed within a prolonged period of very high and abnormal precipitation recorded at the daily, multi-day and even from a hydrologic year perspective
Comentado [A2]: I am not able to visualize fig 4 on my computer. Please, check whether this figure can be seen correctly in the new document.
8
precipitation totals for most of the Portuguese continental territory. During this event, the highest daily precipitation magnitudes for the Tagus region appear on the period spanning between 8 and 11 February, coinciding with the strongest impacts in resident population registered on the same basin during the event (9 to 13 February).
Most of the precipitation on this event occurs in days characterised by a western component, i.e. cyclonic (C), west (W) or southwest (SW), the so called wet CW types, which agrees with the assessment obtained in previous works [6, 10].
The predominance of western directional circulation types over or near Iberia during this period points towards the presence of a significant low-pressure system driving the North Atlantic weather dynamics at the synoptic scale. This system would reinforce the North Atlantic moisture advection towards the IP western coast during this period and furthermore the presence of ARs reaching western IP adds to the strong transport of moisture from the Atlantic towards the IP western coast [9].
All this precipitable water content hovering over the IP western coast during the event would be available to precipitate under favourable conditions, such as the passage of the frontal systems produced by such a large synoptic scale low pressure system established over the Atlantic; or by local convective instabilities produced by low level wind convergences and upper level wind divergences; or by orographic forced convections in rugged terrains.
In order to further explain the February 1979 DISASTER event, it will be necessary to produce a complementary analysis of several other meteorological level fields at the 6-hr temporal resolution, considering the period of the event and a synoptic scale for the fields. This will be valuable to expand on the high-resolution explanation of the event’s meteorological drivers and on its precipitation dynamics. Namely, lower and upper level wind fields, upper level geopotential height and air temperatures, and low level specific humidity, should be considered. Furthermore, hydrological flow rates and river surface free heights data should be evaluated for the period of the event on the regions mostly affected by the river floods. This will support a deeper explanation on how the social infrastructure in those areas became exposed to such extraordinary flooding. Additionally, further studies aimed at identifying the main meteorological drivers of the hydro-geomorphological disasters, but also other physical driving forces, such as the unequal distribution of predisposing conditions to flood and landslide occurrences in the territory, land use changes and the exposure and vulnerability of the societal system, will be explored in order to obtain municipal risk profiles for 278 Portuguese municipalities reflecting the disaster risk incidence and different causal patterns.
5. Conclusions
We conclude that the 1979 February DISASTER event’s major impact over several Portuguese river basins is well framed under the occurrence of an extreme precipitation phenomena that affected most of the North and Centre of the Portuguese continental territory, but also Spain and the international hydrographical basins such as Tagus and Douro. This unusually high precipitation was a consequence of consecutive days with atmospheric circulation with a predominant western component and also cyclonic type all coming from the North Atlantic, most likely produced by a major low-pressure system located over the North Atlantic region, complemented by ARs tropical moisture advection on major precipitation days.
9
Acknowledgments: This work was financed by national funds through FCT - Portuguese Foundation for Science and Technology, I.P. under the framework of the project FORLAND—Hydro-geomorphologic risk in Portugal: driving forces and application for land use planning (PTDC/ATPGEO/1660/2014). A. M. Ramos was also supported by a FCT postdoctoral grant (FCT/DFRH/ SFRH/BPD/84328/2012).
Author Contributions:
R. Trigo and A.M. Ramos conceived and designed the experiments; L. Rebelo, A.M. Ramos and S. Pereira performed the experiments. L. Rebelo, A.M. Ramos, S. Pereira and R.M. Trigo analysed the data and wrote the paper.
Conflicts of Interest: The authors declare no conflict of interest. The founding sponsors had no role in the design of the study, in the collection, analyses, or interpretation of data, in the writing of the manuscript, and in the decision to publish the results.
Abbreviations
The following abbreviations are used in this manuscript:
ARs: Atmospheric Rivers C: Cyclonic
CWTs: Circulation Weather Types IP: Iberian Peninsula
IVT: Integrated Vapour Total
NOAA/ERSL PSD: National Oceanic and Atmospheric Administration/Earth System Research Laboratory Physical Sciences Division
NW: Northwest SW: Southwest W: West
References
1. Pereira S; Ramos A; Zêzere J; Trigo R; Vaquero J. Spatial impact and triggering conditions of the exceptional hydro-geomorphological event of December 1909 in Iberia. Natural Hazards and Earth System Sciences 2016, vol. 16, pp. 371-390, doi:10.5194/nhess-16-371-2016.
2. Trigo R; Varino F; Ramos A; Valente M; Zêzere J; Vaquero J; Gouveia C; Russo A. The record precipitation and flood event in Iberia in December 1876: description and synoptic analysis. Frontiers in Earth Science 2014, vol. 2, pp. 1-15, doi: 10.3389/feart.2014.00003.
3. Trigo R; Ramos C; Pereira S; Ramos A; Zêzere J; Liberato M. The deadliest storm of the 20th century striking Portugal: Flood impacts and atmospheric circulation. Journal of Hydrology 2016, vol. 541, pp. 597-610, doi:10.1016/j.jhydrol.2015.10.036.
4. Zêzere J; Pereira S; Tavares A; Bateira C; Trigo R; Quaresma I; Santos P; Santos M; Verde J.
Comentado [A3]: Please, write references in the same format.
10
DISASTER: A GIS database on hydro-geomorphologic disasters in Portugal. Natural Hazards 2014, vol. 72, pp. 503-532, doi: 10.1007/s11069-013-1018-y.
5. Fragoso, M.; Trigo, R. M.; Pinto, J. G.; Lopes, S.; Lopes, A.; Ulbrich, S.; Magro, C. The 20 February 2010 Madeira flash-floods: synoptic analysis and extreme rainfall assessment. Natural Hazards and Earth System Science 2012, vol. 12, pp. 715-730, doi: 10.5194/nhess-12-715-2012.
6. Trigo R; DaCamara C. Circulation weather types and their influence on the precipitation regime in Portugal. Int. J. Climatol. 2000, vol. 20, pp. 1559-1581, doi: 10.1002/1097-0088(20001115)20:13<1559::AID-JOC555>3.0.CO;2-5
7. Compo, G. P.; Whitaker, J. S.; Sardeshmukh, P. D.; Matsui, N.; Allan, R. J.; Yin, X.; Gleason, B. E.; Vose, R. S.; Rutledge, G.; Bessemoulin, P.; Brönnimann, S.; Brunet, M.; Crouthamel, R. I.; Grant, A. N.; Groisman, P. Y.; Jones, P. D.; Kruk, M. C.; Kruger, A. C.; Marshall, G. J.; Maugeri, M.; Mok, H. Y.; Nordli, Ø.; Ross, T. F.; Trigo, R. M.; Wang, X. L.; Woodruff, S. D.; Worley, S. J. The Twentieth Century Reanalysis Project. Q.J.R. Meteorol. Soc. 2011, vol. 137, pp.1–28, doi:10.1002/qj.776.
8. M. Belo-Pereira; E. Dutra; P. Viterbo. Evaluation of global precipitation data sets over the Iberian Peninsula. Journal of Geophysical Research Atmospheres 2011, vol. 116, doi:10.1029/2010JD015481.2.
9. Ramos A; Trigo R; Liberato M; Tomé R. Daily Precipitation Extreme Events in the Iberian Peninsula and Its Association with Atmospheric Rivers. Journal of Hydrometeorology 2015, vol. 16, pp. 579-597, doi:10.1175/JHM-D-14-0103.1.
10. Ramos A; Cortesi N; Trigo R. Circulation weather types and spatial variability of daily precipitation in the Iberian Peninsula. Frontiers in Earth Science 2014, vol. 2, doi: 10.3389/feart.2014.00025.
11. D. A. Lavers; G. Villarini; R. P. Allan; E. F. Wood; A. J. Wade. The detection of atmospheric rivers in atmospheric reanalyses and their links to British winter floods and the large-scale climatic circulation. Journal of Geophysical Research Atmospheres 2012, vol. 117, doi:10.1029/2012JD018027.
© 2017 by the authors; licensee MDPI, Basel, Switzerland. This article is an open access article distributed under the terms and conditions of the Creative Commons by Attribution (CC-BY) license (http://creativecommons.org/licenses/by/4.0/).