Corresponding Author E-mail: joanaap@isa.utl.pt
An Individual Tree Growth Model for Juvenile Cork Oak
Stands in Southern Portugal
Joana A. Paulo* and Margarida Tomé** *Engenheira Florestal
**Professora Catedrática
Departamento de Engenharia Florestal. Instituto Superior de Agronomia, Tapada da Ajuda, 1349-017 LISBOA
Abstract. The juvenile and adult stages in cork oak are distinct because of the periodic
debarking of the stem and branches that characterizes the adult stage. This fact implies the use of diameter under bark for the adult stage while diameter over bark is the natural variable for juvenile stands in growth and yield studies. Tree growth in the adult stage may also be affected by the periodic debarking. The differences between the two stages justify the development of different models for each of them. The objective of this paper is to develop an individual tree growth and yield model for juvenile cork oak stands for general application on the cork oak distribution area in Southern Portugal. The most important modules of this growth model were developed using data collected from a large number of trees in the juvenile stage, from several plots distributed around the South of Portugal. These modules were: an individual tree diameter growth model, a height-diameter model and a model for crown diameter prediction.
Key words: Quercus suber L.; growth and yield model
Modelo de Crescimento para Árvores em Povoamentos Juvenis de Sobreiro em Portugal Sumário. A fase juvenil e adulta no sobreiro distinguem-se entre si pela existência de
descortiçamentos periódicos no fuste e nas pernadas ao longo da fase adulta. Este facto obriga ao uso do diâmetro sem cortiça na fase adulta, enquanto o diâmetro com cortiça é a variável natural em estudos de crescimento e produção realizados em povoamentos jovens. As diferenças entre as duas fases justificam o desenvolvimento de diferentes modelos para cada uma. O objectivo deste trabalho é desenvolver um modelo de crescimento e produção da árvore individual para povoamentos juvenis de sobreiro, para aplicação geral na área de distribuição do sobreiro em Portugal. Os módulos mais importantes deste modelo de crescimento foram desenvolvidos com dados recolhidos num grande número de árvores em fase juvenil, de um conjunto de parcelas distribuídas pelo Sul de Portugal. Estes módulos são: um modelo de crescimento em diâmetro para a árvore, uma curva hipsométrica e um modelo para a predição do diâmetro da copa.
Palavras-chave: Quercus suber L.; modelo de crescimento e produção
Un Modèle de Croissance pour des Jeunes Peuplements de Chêne Liège au Portugal
des arbres adultes on mesure le diamètre sur liège, alors que sur des arbres jeunes la variable mesurée est naturellement le diamètre sous liège. Cette différence oblige au développement d'un modèle de croissance et production spécifique pour les arbres jeunes. Ce modèle est l'objectif de cette étude et comprend des équations pour la modélisation de la croissance en diamètre de l'arbre et de sa cime et une courbe hypsométrique. Les données ont été relevées sur des jeunes arbres dans plusieurs parcelles de l'aire d'expansion de l'espèce dans le sud du Portugal.
Mots clés: Quercus suber L.; modèle de croissance Introduction
Cork oaks (Quercus suber L.) are currently the second most widespread tree species in Portugal, covering 693 103 hectares (pure stands and mixed stands with cork oak as dominant species) and corresponding to 21% of the total forest area in continental Portugal (TOMÉ et al., 2007). According to the last published data about 33% of the cork oaks are trees that have never had the bark removed, with a circumference at breast height over bark (c) under 70 cm (DGF, 1990). Since according to official statistics the rates of plantation have increased in the last decades (FERREIRA, 2006), it is possible that this value as also rise.
When modelling growth and yield of cork oak stands it is important to consider three stages, corresponding to the different forest exploitation periods which the "montado" undergoes, namely the regeneration, juvenile and mature stages. The juvenile stage refers to trees that have not yet been debarked and lasts until the cork is stripped for the first time, which, according to specific legislation, can only be done when the tree reaches 70 cm of perimeter at breast height. At that time the tree enters the adult stage.
The major difference between the juvenile and adult stages is the periodic debarking of the tree, which occurs in the adult stage. Additionally, the cork that is
produced in the juvenile stage, known as virgin cork, characterized by an uneven surface with several cracks due to the quick initial diameter growth, is quite different from mature cork both in composition and market value.
From a modelling point of view, there is an important difference between the two stages: in the juvenile stage, the diameter over bark (d) is the main predictor variable of other tree level variables, such as tree height, crown diameter or crown ratio, whereas in the mature stage this role belongs to the diameter at breast height under cork (du). After the cork harvest a new phellogen is regenerated and a new cork layer starts being produced. Cork growth is remarkable, ranging from around 8 to 1 mm per year, depending on the number of years since the last debarking and on the cork growth rate, which varies considerably among trees. This fact makes diameter over cork an unstable variable, with fair correlation with other tree variables such as tree height or crown diameter.
Despite the importance of knowing the characteristics of trees in the juvenile stage, namely to decide on when debarking should begin, there is an almost absolute lack of models and scientific studies regarding this tree life period. This article reports research that was undertaken with the objective of filling this gap, therefore focusing
exclusively on the juvenile stage.
Prediction equations for the most important tree-level variables were developed: an equation for predicting diameter at breast height over cork growth, an equation for the prediction of tree total height and, finally, another for the prediction of crown diameter. In all cases, the equations can be given a regional character, as long as the parameters are expressed as a function of the stand variables that are expected to modify these relationships between stands. The three models that were developed considered not only the
diameter over cork (d) variable as a
predictor but also other stand variables, which were always calculated using diameter over cork.
Materials and methods
Data
The available data was gathered from measurements in eight sets of permanent plots (a total of 46 plots) located in even-aged stands. These measurements were performed between 1993 and 2002, depending on the plot. Each plot was
measured 1 to 4 times, at intervals of 2 to 5 years, with a 3-year interval being the most frequent period between measurements.
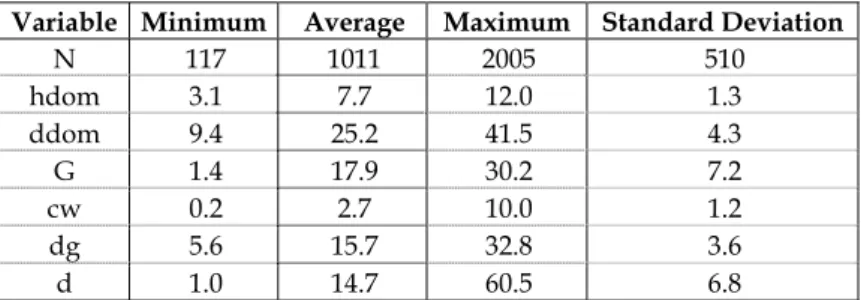
The variability of tree and stand characteristics is quite remarkable (Table 1). The presence in the data set of individual trees with measured diameters larger that 22.3 cm (corresponding to 70 cm of perimeter at breast height defined by specific legislation for the first debarking) is due to the fact that two of the measured stands, although never debarked, had 42 and 36 years old when the last measurements occurred in 2002. This also affects stand variables such as quadratic mean diameter, which then presents a maximum value of 32.8 cm. The presence of these undebarked trees with large dimensions makes possible to observe the tendencies of the claimed models when values of the independent variable are above 22.3 cm, allowing to apply the fitted models to individual trees that although present a diameter that allows cork extraction, for some specific reason concerning tree or stand management are still in the juvenile stage.
Table 1 - Characterization of the data used in the study
Variable Minimum Average Maximum Standard Deviation
N 117 1011 2005 510 hdom 3.1 7.7 12.0 1.3 ddom 9.4 25.2 41.5 4.3 G 1.4 17.9 30.2 7.2 cw 0.2 2.7 10.0 1.2 dg 5.6 15.7 32.8 3.6 d 1.0 14.7 60.5 6.8
N – number of trees per hectare; hdom – dominant height (m); ddom – dominant diameter (cm); G – stand basal area (m2ha-1); cw – crown diameter (m); dg – quadratic mean diameter (cm); d – diameter at breast height over cork (cm).
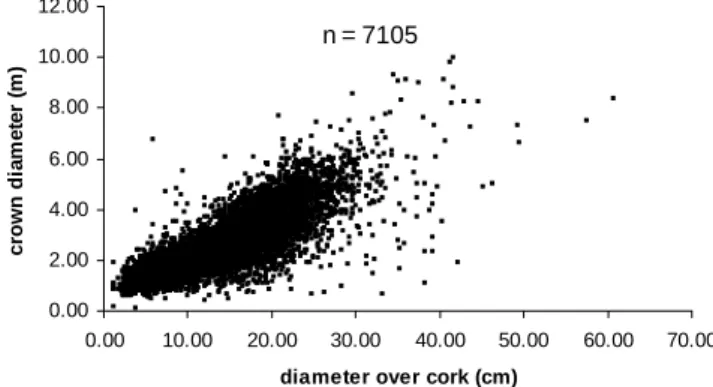
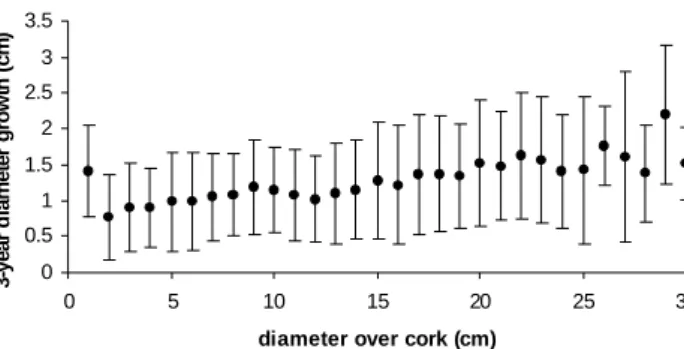
The total data set is composed of 9320 observations. However, height measure-ments were only available for 8259 of the observations (Figure 1) and crown diameter measurements for 7105 of them (Figure 2). The development of the model for diameter growth at breast height required data that included several measurements on the same tree, only available in three sets of permanent plots (a total of 23 plots), each of them with a different number of measure-ments, originating a total of 2795
available tree data pairs (Figure 3). Like all oak species, cork oak grows slowly, with a very small diameter increment per year. This is the main reason why consecutive measurements have been made, generally, for growing periods of at least three years. With three years being the most frequent measurement period in the data set, diameter increment data was standardized to growth in three-year periods by assuming linear growth for the interval between measurements.
0.00 2.00 4.00 6.00 8.00 10.00 12.00 14.00 16.00 18.00 0.00 10.00 20.00 30.00 40.00 50.00 60.00 70.00
diameter over cork (cm)
to ta l h e ig h t (m ) n = 8259
Figure 1 - Relationship between total height and diameter over cork
0.00 2.00 4.00 6.00 8.00 10.00 12.00 0.00 10.00 20.00 30.00 40.00 50.00 60.00 70.00
diameter over cork (cm)
c row n di a m e te r ( m ) n = 7105
0 0.5 1 1.5 2 2.5 3 3.5 0 5 10 15 20 25 30
diameter over cork (cm)
3-ye ar d iam e te r grow th ( cm )
Figure 3 - Relationship between 3-year mean diameter growth and diameter over cork class. y error bars represent standard deviation intervals
Selection of the candidate models
Diameter growth model
Three types of models were tested to model individual tree diameter growth: i) a linear model expressing diameter growth (id3) as a function of tree and stand variables; ii) a linear model expressing dt+3 as a function of dt and tree and stand variables (dt is diameter at age t); iii) a non-linear growth model for dt+3 formulated as an age-independent difference equation.
As a starting point for the definition of the linear models, the all possible
regressions method of the SAS REG
procedure was used to select the best regressors among a large set of tree and stand variables, such as stand basal area (G), number of trees per hectare (N), maximum diameter (dmax), dominant height (hdom), dominant diameter (ddom) defined as the quadratic mean diameter of dominant trees, and quadratic mean diameter (dg), as well as distance-independent competition indices. A total of seven indices were tested, comprising dominance indices (ratio between individual tree dimension
and the mean or maximum dimension in the stand) and the spacing coefficient that expresses the ratio of the mean distance between trees and the mean crown width. The tested formulations are as follow. Dominance indices: ddom di Rddom , max d di max Rd , dg di Rdg= = = , gdom gi Rbdom , max g gi max Rb , gm gi Rbm= = = ;
Area proportional to tree basal area (APB): ⎟⎟ ⎠ ⎞ ⎜⎜ ⎝ ⎛ ⎟ ⎠ ⎞ ⎜ ⎝ ⎛ = gm gi N 10000
APB (TOMÉ and BURKHART,
1989); Spacing coefficient: cw N 100 Sc = ,
where di is tree diameter at breast height; dg is quadratic mean diameter; gi is tree basal area; gm is mean basal area; dmax and ddom are maximum and dominant diameter; gmax and gdom are maximum and dominant basal area in the plot; N is number of trees per hectare, and cw is mean crown diameter in the plot.
Two non-linear growth models were tested: one derived from the Lundqvist
growth function and the other from the Richards growth functions, using the method presented by TOMÉ et al. (2006) that expresses the original function as an age-independent difference equation function. This makes it possible to use the growth models even when age is not known, as is usually the case in most stands. This method resulted in the following growth functions, independent of age: ( ) m m 1 t 3 A d log k k 3 t Ae d ⎟⎟ ⎟ ⎟ ⎠ ⎞ ⎜⎜ ⎜ ⎜ ⎝ ⎛ + ⎟⎟ ⎠ ⎞ ⎜⎜ ⎝ ⎛ − − + = (Lundqvist-t function) m 1 1 m 1 t k 3 3 t A 1 e 1 dA d − − − + ⎟⎟ ⎠ ⎞ ⎜ ⎜ ⎝ ⎛ ⎟ ⎟ ⎠ ⎞ ⎜ ⎜ ⎝ ⎛ ⎟ ⎠ ⎞ ⎜ ⎝ ⎛ − − = (Richards-t function)
where A is the asymptotic value for diameter at breast height and k and m are the parameters. Using the results obtained by TOMÉ et al. (2006), parameter k was expressed as a function of stand variables and competition indices.
Height-diameter model
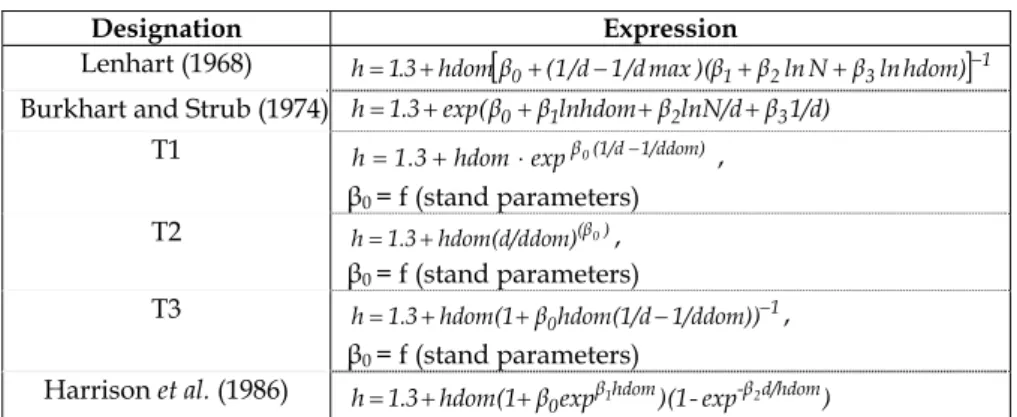
Candidate models for the height-diameter model were selected from the literature. The objective was to obtain a general curve that could predict height from the diameter at breast height over cork and from stand variables, the ones already tested in the diameter growth model. The literature regarding height-diameter modelling (e.g. SOARES and
TOMÉ, 2002) mentions several regional models, which are listed in Table 2. The models referred to as T1, T2 and T3 (TOMÉ, 1989) are modifications of local height-diameter models from
MICHAILOFF (1943), STOFFELS and VAN SOEST (1953), and PRODAN (1965), developed in order to restrict the origin of the equation at the point (d, h) = (0, 1.30), where h represents total tree height. Exact tree age is not usually available; therefore, the age variable was not used in the models that use it as a regressor.
Table 2 - Height-diameter relationship models tested
Designation Expression Lenhart (1968)
[
]
1 3 2 1 0 (1/d 1/dmax)(β β lnN β lnhdom) β hdom 3 . 1 h= + + − + + −Burkhart and Strub (1974) h=1.3+exp(β0+β1lnhdom+β2lnN/d+β31/d)
T1 h=1.3+hdom⋅expβ0(1/d−1/ddom) ,
β0 = f (stand parameters) T2 h=1.3+hdom(d/ddom)(β0), β0 = f (stand parameters) T3 1 0hdom(1/d 1/ddom)) β hdom(1 3 . 1 h= + + − − , β0 = f (stand parameters)
Harrison et al. (1986) h 1.3 hdom(1 βexpβhdom)(1-exp-βd/hdom)
0 1 2
+ + =
h – total tree height (m); dmax – maximum diameter at breast height in the plot (cm); other variables are as explained in Table 1
Crown diameter model
Regarding the crown diameter (cw) prediction, the simplest and most commonly used model is the simple linear model in which the most significant regressor is, usually, the diameter at breast height (GONÇALVES, 2002; GILL et al., 2000; PAULO, 2002). Other authors employ multiple linear models and different polynomial functions. From a biological standpoint, the straight line can only be used for young stands in which both variables (d and crown width) are in the linear phase of the growth curve. Later on, d and crown width growth are no longer proportional, and the slope of the relationship decreases, with crown width enlarging at a slower rate than diameter.
All three models – linear (simple and multiple) and polynomial functions – were therefore tested. The selection of regressors for the linear models was based on analysis of the results of the all possible regressions algorithm, as well as on the stepwise algorithm of the SAS
REG procedure. The regressors tested are the same ones used for the linear diameter growth models.
Concerning the quadratic model,
formulated as , the
incorporation of several stand variables, and their transformations, were tested on the three parameters (β
2 2 1 0 d d cw=β +β +β 1, β2 and β3). In addition to the linear models, some non-linear models, comprising forms proven to be compatible with the biological development of the tree crowns, have been used. GONÇALVES
(2002) and TOMÉ et al. (2001), for instance, applied the exponential and the monomolecular functions that were also
considered here. The first has the form .
2
d cw=β0+β1 β
In this function, the parameter β0 stands for the crown diameter when the tree reaches 1.30 m of height. Therefore, it has to be positive. Several alternative models, expressing one or the two parameters as a function of stand variables, were also tested.
The monomolecular function is formulated as cw=β0(1−eβ1d).
The parameter β0 is the asymptote of this function. Once again, both parameters were expressed as functions of stand variables.
Model fitting and evaluation
The fitting of the several models proposed for each equation was performed with SAS, using the REG
procedure (SAS Institute Inc., 1989) for the linear models, as well as the NLIN
(SAS Institute Inc., 1989) and MODEL
procedures for the non-linear models (SAS Institute Inc., 1993). As mentioned before, in the REG procedure, the stepwise method, as well as the all possible regressions algorithm, was used to help in the selection of regressors.
The convergence of the non-linear models with the three parameters (A, k, m) was difficult and, sometimes, originated asymptote estimates that were not logical from a biological standpoint.
TOMÉ et al. (2006) had the same problem, and based on the analysis of data from monumental cork oak trees in Portugal (GOES, 1984), proposed using A=200 cm. The same procedure was adopted here.
Models with high colinearity can lead to unstable parameter estimations. Therefore, models that show high colinearity levels should be avoided. The
colinearity analysis was based on the condition number of the w'w matrix (ncond), where w is the matrix of the partial derivatives, with respect to each parameter evaluated at the least squares estimates obtained from the final iteration. According to MYERS (1990) ncond values must be less than 1000. Thus, every model to which this condition did not apply was discarded.
Model bias and precision were evaluated with the press residuals (MYERS, 1990), the first by the value of the mean of the press residuals and the second by the mean of the absolute values of the press residuals, as suggested by SOARES and TOMÉ (2002). Plots of observed versus estimated values were also used for model evaluation, as well as the 1, 5, 95 and 99 percentiles of press residuals distribution.
The model efficiency – the proportion of variation explained by the model (ef) - was evaluated as:
( )
∑
∑
-n 1 i 2 i n 1 i 2 pi y y r 1 ef = = − = ,where rpi is the press residual for
observation i and n is the number of observations.
In order to detect any tendencies in the residuals with the size of the trees, the mean value and the mean of absolute value of the residuals by diameter class were computed and plotted against the mean value of the respective diameter class.
The homocedasticity hypothesis was assessed by examining the plot of studentized residuals against the predicted values; the normality hypothesis by analysing the qq-plot. No
signs of important heterocedasticity were found on any of the models.
The non-normality of the residuals, when evident, was corrected iteratively by means of the influence function method, using the Huber's influence function presented in MYERS (1990). Results
Diameter growth model
All the models are reasonably unbiased and precise, and the attained modelling efficiency is very good (Table 3). Generally, the linear models did not perform as well as the non-linear ones. Note that the R2 obtained for the linear model that uses the diameter growth as a dependent variable is very low, as a result of the small total variability shown by this variable. However, the ability of this model to predict diameter growth is comparable to the one obtained by the other candidate models.
All the selected models reveal the importance of the effect of competition on diameter growth, by incorporating a competition index function of the maximum diameter of the plot as well as the spacing coefficient.
The tested non-linear models have the advantage of being based on a biological growth function, a fact that implies, in principle, better extrapolation ability. The performance of the two tested non-linear models is almost equivalent. Considering the results obtained by
TOMÉ et al. (2006) for adult stands, in which the Richards function outperformed the Lundqvist function, the Richards function was also selected for juvenile stands. The selected model did not show any kind of tendency of the residuals regarding tree size.
Table 3 - Statistics used to evaluate fitting and prediction ability for the growth models for
diameter at breast height, the height prediction models and the crown diameter prediction models for juvenile cork oaks
Model Designation R2 Mpress Mapress P95 P5 ef
Linear – id3 0.143 0.047 0.520 1.293 -0.925 0.988 Linear – dt+3 0.991 0.047 0.521 1.297 -0.925 0.988 Lundqvist 0.992 0.048 0.523 1.291 -0.931 0.988 Diameter Gr owth (n = 2795) Richards 0.991 0.049 0.521 1.289 -0.927 0.988 Lenhart (1968) 0.868 -0.028 0.605 1.302 -1.315 0.810 Burkhart (1974) 0.878 0.011 0.573 1.336 -1.411 0.816 T1 0.757 -0.311 0.878 1.357 -1.975 0.670 T2 0.803 -0.264 0.759 1.260 -1.826 0.717 T3 0.794 -0.274 0.775 1.352 -1.783 0.711 Height- Diameter (n = 8259) Harrison (1986) 0.848 -0.040 0.622 1.508 -1.401 0.792 Linear 0.723 0.005 0.530 1.184 -1.119 0.640 Polynomial 0.724 0.008 0.529 1.186 -1.102 0.645 Exponential 0.728 0.008 0.527 1.185 -1.100 0.648 Crown Diameter (n = 7105) Monomolecular 0.700 0.053 0.566 1.170 -1.185 0.612 R2 – percentage of variance explained, computed as R2=1−
∑
(
y−yˆ)
/∑
(
y−y)
; Mpress - mean press residuals; Mapress - mean absolute press residuals; Pi - press residuals i percentile; ef - model efficiency. All values are expressed in centimetresHeight- diameter model
Table 3 shows the statistics that were used to evaluate the fitting and the predictive ability of the tested height-diameter models. Taking into consideration the values shown in Table 3, it can be concluded that the
BURKHART and STRUB (1974) model has shown a better predictive ability.
The plots of the mean and of the mean of absolute values of the residuals of the selected model, over the respective diameter class, clearly showed that the
residuals do not reveal any tendency with the size of the tree.
The non-normality of the residuals was evident for all the adjusted models and, therefore, Huber's influence function (MYERS, 1990) was applied iteratively.
Crown diameter
The fitting and predictive statistics of the candidate models are presented in Table 3. In order to obtain convergence in the monomolecular model, the
asymptote had to be fixed. Several values for the asymptote were tested, the asymptote equal to 14 being deemed the most appropriate. Some extremely high residuals were detected in all the tested models, originating the non-normality of the residuals. Therefore, all of them were fitted again, according to the Huber method.
The quadratic function, in which β1 and β2 were expressed as functions of stand variables: dg 2 1 1 α α β = + and dg 3 2 α β = ,
proved to be the model with the best prediction capabilities. Note that the second parameter of the equation, being associated with d2, can be re-written as
dg d 3
2 α
β = .
The model includes, therefore, the distance-independent competition index Rdg that expresses the hierarchical position of the tree in the stand. This suppression of crown development in dominated trees makes sense from a biological standpoint. Regarding the value for the β0 parameter, which has converged for 0.73, it represents an estimate for the crown diameter when
the tree gets to 1.3 m of total height, which seems reasonable.
Once more, there was no evidence of a tendency of the mean or mean of absolute values of the residuals, according to the tree diameter classes.
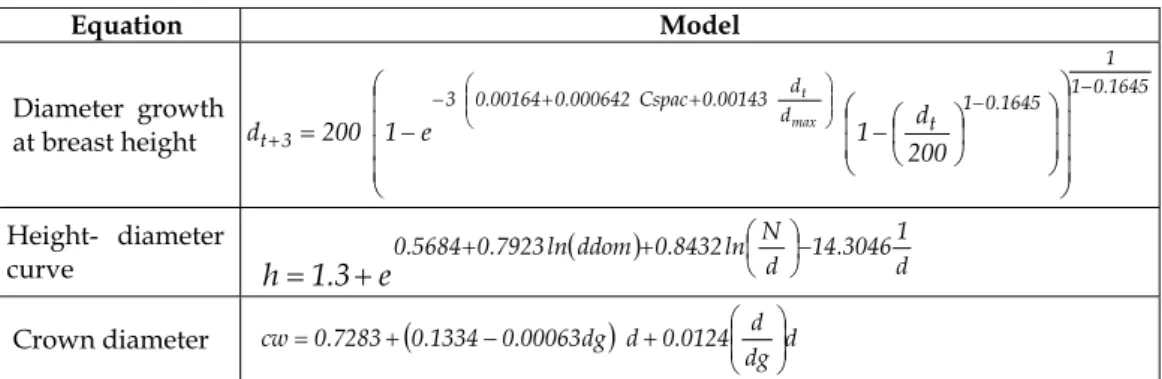
Table 4 summarizes the models that were selected for individual tree diameter growth, height prediction and crown diameter prediction.
Conclusions
The juvenile stage of the cork oak, preceding its adulthood, is characterized by the fact that the tree still has its original cork (virgin cork). After the first stripping of the cork, the trees enter the adult stage. Regardless of the importance of this event, the majority of the existing empirical models, both for diameter growth and for tree or stand variables prediction, are commonly developed considering data taken from adult trees (RIBEIRO et al., 2003; VÁSQUEZ and
PEREIRA, 2004; GONZÁLEZ et al., 2006). Due to the availability of data concerning the juvenile stage, specific models have been developed, in this work, for this important stage of cork oak growth.
Table 4 - Models selected
Equation Model Diameter growth at breast height 1645 . 0 1 1 1645 . 0 1 t d d 00143 . 0 Cspac 000642 . 0 00164 . 0 3 3 t 200 1 e 1 200d d max t − − ⎟⎟ ⎠ ⎞ ⎜⎜ ⎝ ⎛ + + − + ⎟ ⎟ ⎟ ⎟ ⎠ ⎞ ⎜ ⎜ ⎜ ⎜ ⎝ ⎛ ⎟ ⎟ ⎠ ⎞ ⎜ ⎜ ⎝ ⎛ ⎟ ⎠ ⎞ ⎜ ⎝ ⎛ − − = Height- diameter curve ( ) d 1 3046 . 14 d N ln 8432 . 0 ddom ln 7923 . 0 5684 . 0 e 3 . 1 h ⎟⎠− ⎞ ⎜ ⎝ ⎛ + + + = Crown diameter
(
)
d dg d 0124 . 0 d dg 00063 . 0 1334 . 0 7283 . 0 cw ⎟⎟ ⎠ ⎞ ⎜ ⎜ ⎝ ⎛ + − + =All the selected models had parameters which depend on stand variables, so that, in the future, they can be adapted according to the characteristics of each particular stand, being appropriate for most of the even-aged cork oak stands in the juvenile stage. Some competition indices proved to be significant in two of the selected models, revealing the importance of the relative position of the tree within the stand.
The three resulting models, together with a model for the prediction of diameter at breast height under cork, a model for virgin cork's dry weight and a model for the simulation of the branches’ height, constitute a new module for the
SUBER model (TOMÉ et al., 1999), a growth and yield model that is currently used in Portugal as a support tool for management of cork oak stands.
Acknowledgements
This work was developed within the Forest Resources Inventory and Modelling Group (GIMREF) of the Forest Research Centre (CEF) of the Instituto Superior de Agronomia and was
supported by the SUBERMODEL
(FCT/1999/AGR/35173) and
SUBERWOOD (QLK5-CT-2000-00701) research projects.
References
BURKHART, H., STRUB, M., 1974. A model for simulation of planted loblolly pine stands. In: Fries, J. (ed.), Growth models for tree and stand simulation. Royal College
Forestry, Res. Not. 30, Stockholm, pp.
128-135.
DGF, 1990. Inventário Florestal do Sobreiro de 1990. Estudos e informação nº 300. Divisão de Inventário Florestal, Direcção Geral das Florestas, Lisboa, Portugal.
FERREIRA, V.G., PEREIRA, T.C., SEABRA, T. TORRES, P., MACIAL, H., 2006. Portuguese national inventory report on greenhouse gases, 1990-2004 – submitted under the United Nations Framework on Climate Change. Ministry of the Environment and Landuse Planning, Institute for the Environment, Amadora, Portugal.
GILL, S.J., BIGING, G.S., MURPHY, E.C., 2000. Modelling conifer tree crown radius and estimating canopy cover. Forest Ecology
and Management 126: 405-416.
GOES, E., 1984. Árvores Monumentais de
Portugal. Portucel.
GONÇALVES, A.C., 2002. Modelação de
povoamentos adultos de pinheiro bravo com regeneração de folhosas na Serra da Lousã.
Tese de Doutoramento, Instituto Superior de Agronomia, Universidade Técnica de Lisboa, Lisboa, Portugal.
GONZÁLEZ, M.S., TOMÉ, M., MONTERO, G., 2005. Modelling height and diameter growth of dominant cork oak trees in Spain. Annals of Forest Science 62: 633-643. HARRISON, W., BURK, T., BECK, D., 1986.
Individual tree basal area increment and total height equations for Appalachian mixed hardwoods after thinning. Southern
Journal of Applied Forestry 10: 99-104. LENHART, J., 1968. Yield of old-field loblolly pine
plantations in the Georgia piedmont. Ph. D.
Thesis, University of Georgia, Georgia. MICHAILOFF, I., 1943. Zahlenmassiges
verfarhen fur die ausfuhrung der Bestandeshohenkurven. Forstw. Cbl. U.
Thar. Forsatl. Jahrb. 6: 273-279. (cit. CURTIS, R.O. 1967. Height-diameter and height- -diameter-age equations for second- -growth Douglas-fir. Forest Sci. 13: 365-375).
MYERS, R.H., 1990. Classical and Modern
Regression with Applications. Second
PAULO, M.J., 2002. Statistical sampling and
modelling for cork oak and eucalyptus stands.
PhD Thesis, Wageningen University, Wageningen, the Netherlands.
PRODAN, M., 1965. Holzmesslehree. I. D. Saver Laender's Verlag. Frankfurt am Main. (cit. Curtis, R.O. 1967. Height-diameter and height-Height-diameter-age equations for second-growth Douglas-fir.
Forest Sci. 13: 365-375).
RIBEIRO, N., OLIVEIRA, A., SUROVY, P., PRETZSCH, H., 2003. Simulation and sustainability of cork oak stands. In: A. Amaro, D. Reed and P. Soares (eds). Modelling forest systems. CABI Publishing,
pp. 259-266.
SAS Institute Inc. 1989. SAS/STAT® User's
guide, Version 6, 4th ed., volume 2, Cary, NC: SAS Institute Inc..
SAS Institute Inc. 1993. SAS/ETS® User's
Guide, version 6, 2nd ed., Cary, NC: SAS
Institute Inc..
SOARES, P., TOMÉ, M., 2002. Height-diameter equation for first rotation eucalypt plantations in Portugal. Forest Ecology and
Management Vol. 166: 99-109.
STOFFELS, A., VAN SOEST, J., 1953. The main problems in sample plots. Ned. Boschb.
Tijdschr. 25: 190-199. (cit. CURTIS, R.O. 1967. Height-diameter and height-diameter-age equations for second-growth Douglas-fir. Forest Sci. 13: 365-375.
TOMÉ, J., TOMÉ, M., BARREIRO, S., PAULO, J.A., 2006. Age-independent difference equations for modelling tree and stand growth. Canadian Journal of Forest Research Vol. 36: 1621-1630.
TOMÉ, M., BURKHART, H.E., 1989. Distance-dependent competition measures for predicting growth of individual trees.
Forest Science 35: 816-831.
TOMÉ, M., 1989. Modelação do crescimento da
árvore individual em povoamentos de Eucalyptus globulus Labill (1ª rotação). Região centro de Portugal. Tese de
Doutoramento, Instituto Superior de Agronomia, Universidade Técnica de Lisboa, Lisboa, Portugal.
TOMÉ, M., COELHO, M.B., PEREIRA, H., LOPES, F., 1999. A management oriented growth and yield model for cork oak and cork oak stands in Portugal. In: A. Amaro e M. Tomé (eds). Empirical and process–based models for forest tree and stand growth simulation. Edições Salamandra. Novas
Tecnologias, Lisboa, Portugal. Pp. 271-189. TOMÉ, M., COELHO, M.B., ALMEIDA, A., LOPES,
F., 2001. O modelo SUBER. Estrutura e equações utilizadas. Relatório Técnico nº 2/2001 do Grupo de Inventariação e Modelação dos Recursos Florestais, Centro de Estudos Florestais, Instituto Superior de Agronomia. Lisboa, Portugal. TOMÉ, M., BARREIRO, S., CORTIÇADA, A.,
PAULO, J.A., MEYER, A., RAMOS, T., 2007. Inventário florestal 2005-2006. Áreas, volumes e biomassas dos povoamentos florestais. Resultados Nacionais e por NUT's II e III. Publicações GIMREF. RT 5/2007. Universidade Técnica de Lisboa. Instituto Superior de Agronomia. Centro de Estudos Florestais. Lisboa.
VÁSQUEZ, J., PEREIRA, H., 2004. Modelos de crecimiento en diámetro para alcornocales del centro y sur de Portugal. Cuadernos de
la Sociedad Española de Ciencias Forestales 18: 219-226.
Entregue para publicação em Novembro de 2007 Aceite para publicação em Outubro de 2008