Taís Gaudencio MartinsI Maria Alice Altenburg de AssisII Markus Vinícius NahasIII Heide GaucheIV
Erly Catarina MouraV
I Programa de Pós-Graduação em Educação
Física. Centro de Desportos. Universidade Federal de Santa Catarina. Florianópolis, SC, Brasil
II Departamento de Nutrição. Centro de
Ciências da Saúde. Universidade Federal de Santa Catarina. Florianópolis, SC, Brasil
III Departamento de Educação Física. Centro
de Desportos. Universidade Federal de Santa Catarina. Florianópolis, SC, Brasil
IV Programa de Pós-Graduação em Saúde
Pública. Centro de Ciências da Saúde. Universidade Federal de Santa Catarina. Florianópolis, SC, Brasil
V Núcleo de Pesquisas Epidemiológicas em
Nutrição e Saúde. Universidade de São Paulo. São Paulo, SP, Brasil
Correspondence:
Maria Alice Altenburg de Assis Universidade Federal de Santa Catarina Campus Universitário - CCS
88040-900 Florianópolis, SC, Brasil E-mail: [email protected] Received: 9/10/2008 Revised: 1/6/2009 Approved: 2/10/2009
Leisure-time physical inactivity
in adults and factors associated
ABSTRACT
OBJECTIVE: To analyze the association between leisure-time physical inactivity and sociodemographic factors and risk or protection factors for chronic noncommunicable diseases among adults.
METHODS: Cross-sectional study comprising adults aged 18 years and older (n = 1,996). Data was obtained from the Surveillance System for Risk Factors for Chronic Noncommunicable Diseases (CNCDs), a random-digit-dialed telephone survey carried out in the city of Florianópolis, southern Brazil, in 2005. There were studied sociodemographic, and behavioral protective and risk factors. Results of the multivariate analysis of the association between leisure-time physical inactivity and independent variables were expressed as prevalence ratios.
RESULTS: The prevalence of leisure-time physical inactivity was 54.6% (47.3% among men, 61.4% among women). After adjustment, among men, higher physical inactivity was positively associated with older age, lower schooling, and inversely associated with working status; and lower physical inactivity was associated with alcohol abuse, regardless of age, schooling, and work status. Among women, higher leisure-time physical inactivity was positively associated with schooling (less than 12 years of education) and working status. The analyses adjusted for schooling and work status showed higher physical inactivity among those women reporting consuming fruits and vegetables less than ive times a day and whole milk.
CONCLUSIONS: Factors associated with leisure-time physical inactivity were different among men and women. Among women, physical inactivity was associated to risk factors for chronic diseases, especially eating habits. Among men, physical inactivity was associated to sociodemographic factors.
DESCRIPTORS: Physical Fitness. Leisure Activities. Risk Factors. Socioeconomic Factors. Chronic Disease, prevention & control. Health Surveys.
INTRODUCTION
According to the World Health Organization (WHO),23 80% of cases of coronary diseases, 90% of type 2 diabetes, and 30% of cancer could be prevented with changes in eating habits, levels of physical activity and tobacco use. Regular physical activity can reduce the risk of cardiovascular diseases, type 2 diabetes, colon and breast cancer, prevent osteoporosis and help keeping a healthy weight.23 Studies on the associations between diet and chronic diseases have also veriied a protective effect of healthy eating – high consumption of fruits, legumes, green vegetables, and whole cereals –, and a negative impact of high-saturated fat diets on the cardiovascular risk.23
Better understanding of the relationships between physical activity and food intake, both constituting protective or risk factors for chronic diseases, can help the development of interventions for improving people’s health status.
The objective of the present study was to assess the association between leisure-time physical inactivity among adults and sociodemographic and protective or risk factors for CNCD.
METHODS
A population-based cross-sectional study was carried out including adults aged 18 years or more living in households with ixed phone lines in the city of Florianópolis, southern Brazil. The study was based on data from the Local Monitoring System of Risk Factors for Chronic Noncommunicable Diseases (SIMTEL) Survey – “SIMTEL Five Cities,” collected in 2005 in Florianópolis and other four Brazilian capitals (Belém, Goiânia, Salvador, and São Paulo, Northern, West-Center, Northeastern and Southeastern Brazil, respectively). SIMTEL is a system that conducts annual surveys in probabilistic samples of adult population living in households with ixed phone lines. The survey scientiic background, objectives, and methods are published elsewhere.12
The sampling irst step in Florianópolis (SIMTEL/ Fpolis) consisted of systematic drawing of 14,000 out of 126,088 phone lines included in the electronic listing of a phone company through a self-weighting sample approach of home lines. The drawing process was stratiied by city districts and areas, keeping the same proportion for each stratum in the listing. The 14,000 lines drawn were then redrawn and divided into 40 sets of 350 lines, known as replicates, as they reproduced the same composition of the entire sample. The second step, conducted in parallel to interviews, consisted of drawing a resident younger than 18 years old for each phone number drawn, after listing the names of all adults living in the household contacted.
To obtain a minimum of 2,000 interviews required to estimate the rate of any risk factor in the population studied at 95% conidence interval and maximum error of about two percent points,12 15 replicates were used, totaling 5,250 phone lines. All lines were called up to ten times at different days (weekdays, Saturdays, and Sundays) and at different hours (morning, afternoon, and evening) based on the methods developed for this study design.12 There were considered eligible 3,280 phone lines (62.5%). Non-eligible phone lines were those out-of-service, belonging to businesses or deac-tivated (n=1,970).
There were considered losses calls that were not answered after ten attempted calls at different days and times; calls made to households where no adult resident was available for consent and drawing; households drawn but no new contact was possible; and calls made to busy lines, fax or voice mail (n=963). A total of 2,013 interviews (809 men and 1,204 women) were conducted between May and December 2005. The inal rate of interviews per eligible phone lines was 61.4%; the loss rate was 29.4% and refusal rate was 9.3%. The study interviews lasted on average 7.5 (standard deviation [SD]= 3.3) minutes.
For quality control, all 500 initial interviews and a random sample of 20% of subsequent interviews were reviewed and, as needed, a new call was placed to respondents for checking their answers.
The analyses of the present study included a sample of 1,996 respondents (51.8% of women), and data from pregnant women (n=17) was excluded.
SIMTEL questionnaire consisted of 75 short strai-ghtforward questions on demographic and socioe-conomic characteristics; eating and physical activity patterns associated to the occurrence of CNCD; frequency of tobacco and alcohol use; and self-per-ception of health status and past medical diagnosis of arterial hypertension, high cholesterol and triglycerides, diabetes, and osteoporosis.
The outcome variable was leisure-time physical inac-tivity, deined as non-engagement in physical activity or physical activity reported at a frequency lower than once a week during leisure time (physical exercise or sports).
a Brazilian Institute of Geography and Statistics. 2000 Census: Brazil [CD-ROM]. Brasília; 2000.
The reported age in full years was grouped into age groups (18–24; 25–34; 35–44; 45–54; or 55 and more). Skin color (from the options white, black, mixed, Asian) was categorized into white or non-white. Schooling was categorized in years of study (zero to four; ive to eight; nine to 11; or 12 and more). Marital status was catego-rized into married, and single, widowed and separated. Paid job was indicated through “yes/no” answers. Alcohol abuse (yes/no) was obtained based on the reported consumption of ive or more doses of any alcoholic drink at least once in the last month prior to the interview, regardless of gender.
Smoking was categorized into smoker (respondents who reported being a smoker at the time of interview); former smoker; or never smoked.
Excess weight was categorized into non-excess weight (body mass index [BMI] <25 kg/m2), pre-obesity (BMI ≥25 kg/m2 and <30 kg/m2), and obesity (BMI ≥30 kg/ m2)22 based on BMI calculated from weight (kg) divided by the squared height (m). Both weight and height measures were self-reported.
Consumption of carbonated beverages including diet or light was categorized into seldom (never and seldom); one to two times a week; and three and more times a week. Consumption of whole milk (yes/no) was computed by combining answers on the habit of consu-ming milk and type of milk consumed as for fat content. Consumption of fatty meat (yes/no) was obtained by combining the answers on the habit of consuming fatty red meat and poultry with skin with the visible fat.
The daily frequency of intake of fruits, green vegetables, and legumes was categorized by combining the answers on frequency of intake of fruits, raw salads, green vege-tables and cooked legumes into ive or more times, three to four, one to two or less than once a day.
Bivariate and multiple regression analyses were performed using Stata program version 9.0. Prevalence ratios (PR) and 95% conidence intervals (95% CI) were estimated through Poisson regression with robust variance and the inclusion of variables following a hierarchical model.21 In the irst level of the model were included sociodemographic variables and in the second level, protective and risk variables for chronic diseases. Indicators included in the hierarchical model were selected based on their relevance for establishing leisure-time physical inactivity in studies carried out in Brazil1,5,11 and other countries.3,8-10
Variables with p<0.20 were included in the model according to the hierarchical level to control for confounders. The factors associated to leisure-time physical inactivity were those with signiicant tests for heterogeneity or linear trend (p<0.05).
Data were stratiied by gender and prevalence esti -mates were produced for the entire adult population in the city using expansion factors according to the sociodemographic distribution based on the 2000 Population Census.12
The study was approved by the Human Research Ethics Committee of Universidade Federal de Santa Catarina
and Universidade de São Paulo School of Public
Health. A free informed consent form was replaced by a verbal consent that was properly recorded at the time phone calls were placed.
RESULTS
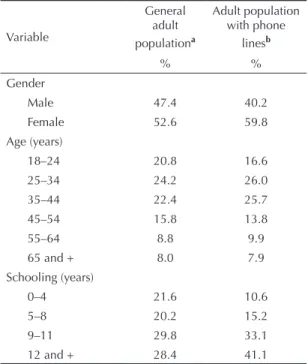
Table 1 shows sociodemographic characteristics of the population with phone lines studied by SIMTEL in Florianópolis compared to the characteristics of the city’s adult population of a random sample of 10% of households surveyed in the 2000 Population Census.a Both samples have similar characteristics, although the population studied by SIMTEL in Florianopolis had a higher proportion of women (59.8% in the study
Table1. Estimated distributions of general adult population and adult population with phone lines according to sociodemographic variables. City of Florianópolis. Southern Brazil. 2000-2005.
Variable
General adult populationa
Adult population with phone
linesb
% %
Gender
Male 47.4 40.2
Female 52.6 59.8
Age (years)
18–24 20.8 16.6
25–34 24.2 26.0
35–44 22.4 25.7
45–54 15.8 13.8
55–64 8.8 9.9
65 and + 8.0 7.9
Schooling (years)
0–4 21.6 10.6
5–8 20.2 15.2
9–11 29.8 33.1
12 and + 28.4 41.1
sample versus 52.6% in the Census), lower proportion of young people aged between 18 and 24 years (16.6% versus 20.8% in the Census), and higher proportion of respondents with schooling equal to or higher than nine years (74.2% versus 58.2%, in the Census).
In the sample studied, mean age was 39.7 years old (SD= 15.0) and mean schooling was 11.2 (SD= 4.4) years.
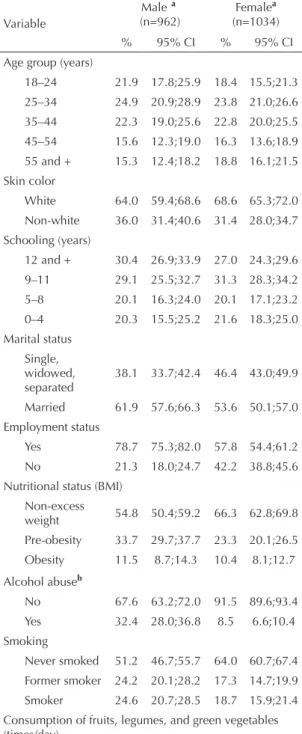
Similar distributions of sociodemographic variables were seen between men and women at different age and levels of schooling with a predominance of white men and women. A higher proportion of men compared to women reported being married and having a paid job. As for protective or risk factors for chronic diseases, compared to women, a higher rate of men had pre-obesity, and reported alcohol abuse and smoking. On the other hand, compared to men, a higher proportion of women reported consuming fruits, legumes, and green vegetables at a frequency greater than three to four times a day, seldom consuming carbonated beverages, and not consuming whole milk and fatty meat. (Table 2)
Of 1,996 respondents, 1,090 reported leisure-time physical inactivity, and 58.3% of them were women. The prevalence of leisure-time physical inactivity was overall 54.6% (95% CI: 51.8;57.4); 47.3% (95% CI: 42.8;51.7) among men; and 61.4% (95% CI: 58.1;64.7) among women.
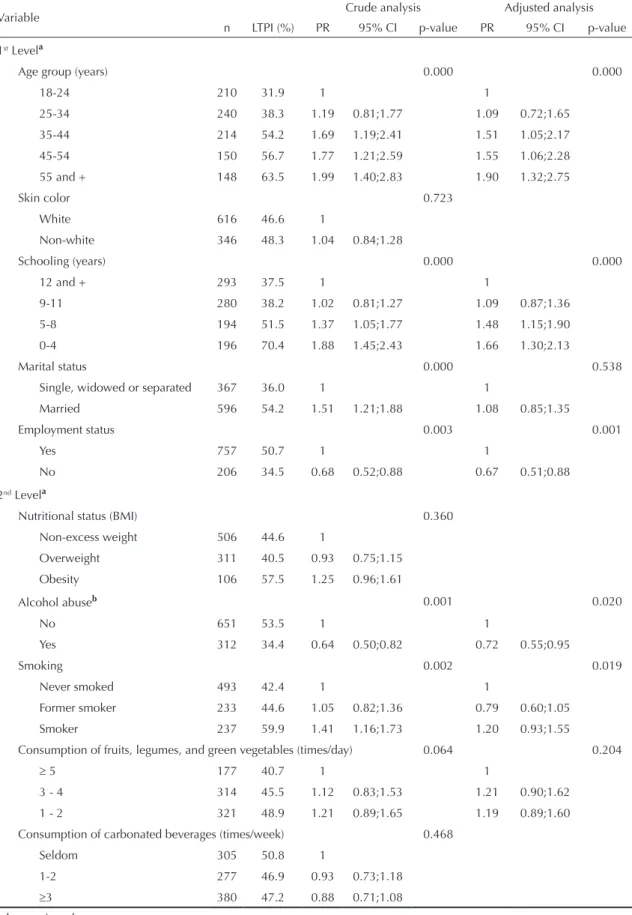
Tables 3 and 4 show prevalences and crude and adjusted prevalence ratios for the association between leisure-time physical inactivity and sociodemographic and risk or protective factors for chronic diseases among men and women.
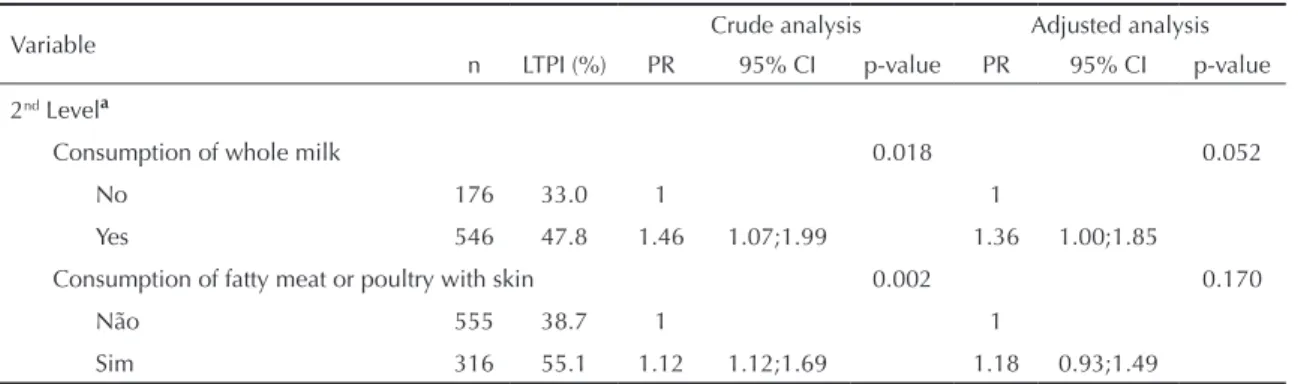
Among men, the bivariate analysis showed an associa-tion between leisure-time physical inactivity and older age, lower schooling, being married and employed. As for behavioral risk factors, men who reported smoking and consuming whole milk and fatty meat were more likely to be inactive during their leisure time. On the other hand, alcohol abuse was associated to lower prevalence of leisure-time physical inactivity.
In the adjusted analyses at the irst level of the hierar-chical model, the associations between higher preva-lence of leisure-time physical inactivity and older age, lower schooling, and employment status remained, but the association with the marital status married disappeared. In the adjusted analyses at the second level controlled for age, schooling, and employment status, the association between lower prevalence of leisure-time physical inactivity and alcohol abuse was conirmed but with a reduced magnitude of effect. The adjustments also produced loss of statistical signiicance of the associations between leisure-time inactivity and consumption of fatty meat and whole milk. In regard
Table 2. Sociodemographic characteristics and protective or risk factors for chronic noncommunicable diseases in adult population by gender. City of Florianópolis, southern Brazil, 2005.
Variable
Malea (n=962)
Femalea (n=1034) % 95% CI % 95% CI Age group (years)
18–24 21.9 17.8;25.9 18.4 15.5;21.3 25–34 24.9 20.9;28.9 23.8 21.0;26.6 35–44 22.3 19.0;25.6 22.8 20.0;25.5 45–54 15.6 12.3;19.0 16.3 13.6;18.9 55 and + 15.3 12.4;18.2 18.8 16.1;21.5 Skin color
White 64.0 59.4;68.6 68.6 65.3;72.0 Non-white 36.0 31.4;40.6 31.4 28.0;34.7 Schooling (years)
12 and + 30.4 26.9;33.9 27.0 24.3;29.6 9–11 29.1 25.5;32.7 31.3 28.3;34.2 5–8 20.1 16.3;24.0 20.1 17.1;23.2 0–4 20.3 15.5;25.2 21.6 18.3;25.0 Marital status
Single, widowed, separated
38.1 33.7;42.4 46.4 43.0;49.9
Married 61.9 57.6;66.3 53.6 50.1;57.0 Employment status
Yes 78.7 75.3;82.0 57.8 54.4;61.2 No 21.3 18.0;24.7 42.2 38.8;45.6 Nutritional status (BMI)
Non-excess
weight 54.8 50.4;59.2 66.3 62.8;69.8 Pre-obesity 33.7 29.7;37.7 23.3 20.1;26.5 Obesity 11.5 8.7;14.3 10.4 8.1;12.7
Alcohol abuseb
No 67.6 63.2;72.0 91.5 89.6;93.4 Yes 32.4 28.0;36.8 8.5 6.6;10.4 Smoking
Never smoked 51.2 46.7;55.7 64.0 60.7;67.4 Former smoker 24.2 20.1;28.2 17.3 14.7;19.9 Smoker 24.6 20.7;28.5 18.7 15.9;21.4 Consumption of fruits, legumes, and green vegetables (times/day)
≥5 18.4 14.7;22.1 24.1 21.2;27.0 3–4 32.6 28.7;36.6 43.6 40.2;47.0 1–2 33.3 29.1;37.5 25.3 22.3;28.2 <1 15.6 12.1;19.2 7.1 5.2;9.0 Consumption of carbonated beverages (times/week)
Seldom 31.7 27.7;35.7 41.4 38.1;44.8 1–2 28.8 24.5;33.1 34.5 31.1;37.8
to smoking, the statistical signiicance in the test for heterogeneity was preserved, but the lower limits of conidence intervals in the categories former smoker and smoker were smaller than the unit. (Table 3)
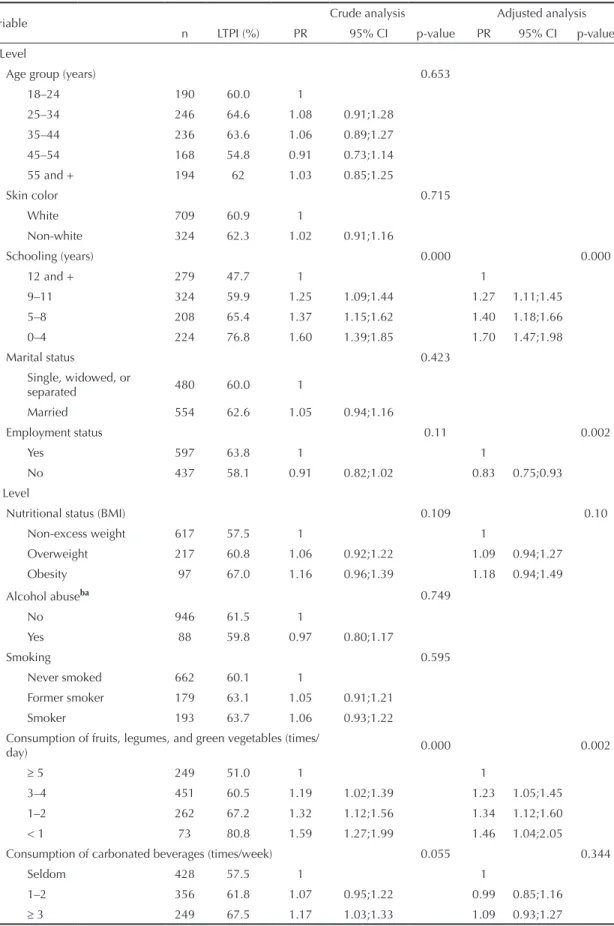
Among women, in the bivariate analyses with socio-demographic factors, only schooling was associated to leisure-time physical inactivity. The lower the schooling, the more likely respondents were inactive. In these analyses, the selected nutritional protective or risk factors were positively associated to greater likelihood of leisure-time physical inactivity. Alcohol abuse, smoking, and nutritional status did not show any association with leisure-time physical inactivity.
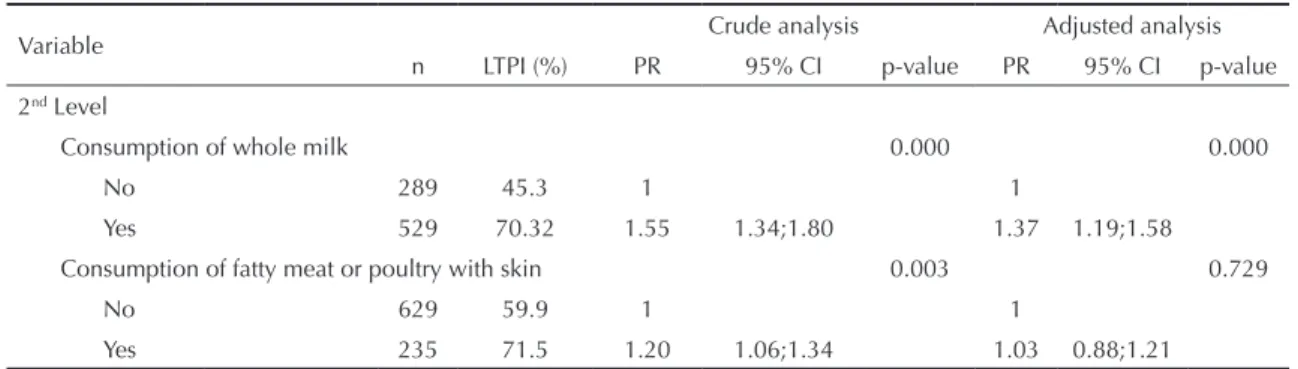
The analyses at the irst level of the hierarchical model, adjusted for schooling and employment, potentiated the magnitude of the associations between higher preva-lence of leisure-time physical inactivity and less than 12 years of schooling and revealed an inverse associa-tion with employment status, which was previously not identiied in the bivariate analysis. The adjusted analyses at the second level, controlled for schooling and employment, conirmed the associations between higher prevalence of leisure-time physical inactivity and intake of fruits, legumes, and green vegetables in the categories of frequency less than ive times a day, reduced the magnitude of effect of the association between physical inactivity and consumption of whole milk and eliminated the association with consump-tion of fatty meat, as previously seen in the bivariate analysis. (Table 4)
DISCUSSION
The results of the present study showed the association between leisure-time physical inactivity and risk factors for CNCD among males and females and corroborated the well-known different patterns of leisure-time physical activity (women are less active than men) and risk factors for chronic diseases (overall, women had less major risk factors).
Leisure-time physical activity is only one dimension of physical activity. Public health recommendations stress the importance of cumulative physical activity in the different scenarios of daily life including leisure time (physical exercises and sports), occupational activities, commuting, and home physical activities.6 However, the measure of leisure-time physical activity has become increasingly relevant as it is an optional, pleasant activity and has more consistent associations with risk factors for cardiovascular diseases when compared to occupational activities.19
The present study has some limitations. First, the sample interviewed by SIMTEL only allows infe-rences for adult population living in households with ixed phone lines, which does not have a universal coverage, and may have low coverage in lower socio-economic areas. Hence, to minimize biases resulting from non-universal phone coverage, post-stratiication weighting was applied.12 Second, the study was based on self-referred information. However, indicators of physical activity and sedentary lifestyle and food and alcohol consumption showed good reproducibility and adequate validity in studies including SIMTEL/São Paulo respondents,13,14 though these results cannot be extended to Florianópolis or other cities, especially due to regional and cultural differences. Third, the indings of the present study are based on a cross-sectional study, which is an adequate design for assumptions of asso-ciations or co-occurrence of behaviors but it does not provide information on how the associated behaviors affect health. The risk factors and outcome were studied at the same time and bias of reverse causality for beha-vioral factors cannot be eliminated. The study design did not allow to establishing whether, for example, smoking, non-consumption of alcohol, low intake of fruits, legumes, and green vegetables and/or intake of whole milk precede physical inactivity.
As for the positive aspects of the study, it should be noted the sampling procedures and the training of interviewers in conducting standardized interviews with strict quality control.
The prevalence of leisure-time physical inactivity found in the present study (54.6% overall; 47.3% among men; and 61.4% among women) was lower than that reported in SIMTEL/Goiânia (66.5% overall; 53.2% among men; and 67.1% among women).17
SIMTEL questionnaire had different questions on physical activity compared to other questionnaires, limiting comparisons with leisure-time physical inac-tivity rates obtained in other population-based studies in Brazil. Most large studies conducted in Brazil with adult populations used different questionnaires and deinitions for leisure-time physical inactivity. In a study investigating lifestyles carried out in northeastern and southeastern Brazil in 1996–1997, including people Table 2 continuation
Variable
Malea (n=962)
Femalea (n=1034)
% 95% CI % 95% CI Consumption of whole milk
No 24.4 20.3;28.4 35.4 31.8;38.9 Yes 75.6 71.6;79.7 64.6 61.1;68.2 Consumption of fatty meat or poultry with skin
Table 3. Crude and adjusted prevalence ratios of the hierarchical model for the association between leisure-time physical inactivity, sociodemographic and protective or risk factors for chronic noncommunicable diseases among males. City of Florianópolis, Southern Brazil, 2005.
Variable Crude analysis Adjusted analysis
n LTPI (%) PR 95% CI p-value PR 95% CI p-value
1st Levela
Age group (years) 0.000 0.000
18-24 210 31.9 1 1
25-34 240 38.3 1.19 0.81;1.77 1.09 0.72;1.65
35-44 214 54.2 1.69 1.19;2.41 1.51 1.05;2.17
45-54 150 56.7 1.77 1.21;2.59 1.55 1.06;2.28
55 and + 148 63.5 1.99 1.40;2.83 1.90 1.32;2.75
Skin color 0.723
White 616 46.6 1
Non-white 346 48.3 1.04 0.84;1.28
Schooling (years) 0.000 0.000
12 and + 293 37.5 1 1
9-11 280 38.2 1.02 0.81;1.27 1.09 0.87;1.36
5-8 194 51.5 1.37 1.05;1.77 1.48 1.15;1.90
0-4 196 70.4 1.88 1.45;2.43 1.66 1.30;2.13
Marital status 0.000 0.538
Single, widowed or separated 367 36.0 1 1
Married 596 54.2 1.51 1.21;1.88 1.08 0.85;1.35
Employment status 0.003 0.001
Yes 757 50.7 1 1
No 206 34.5 0.68 0.52;0.88 0.67 0.51;0.88
2nd Levela
Nutritional status (BMI) 0.360
Non-excess weight 506 44.6 1
Overweight 311 40.5 0.93 0.75;1.15
Obesity 106 57.5 1.25 0.96;1.61
Alcohol abuseb 0.001 0.020
No 651 53.5 1 1
Yes 312 34.4 0.64 0.50;0.82 0.72 0.55;0.95
Smoking 0.002 0.019
Never smoked 493 42.4 1 1
Former smoker 233 44.6 1.05 0.82;1.36 0.79 0.60;1.05
Smoker 237 59.9 1.41 1.16;1.73 1.20 0.93;1.55
Consumption of fruits, legumes, and green vegetables (times/day) 0.064 0.204
≥ 5 177 40.7 1 1
3 - 4 314 45.5 1.12 0.83;1.53 1.21 0.90;1.62
1 - 2 321 48.9 1.21 0.89;1.65 1.19 0.89;1.60
Consumption of carbonated beverages (times/week) 0.468
Seldom 305 50.8 1
1-2 277 46.9 0.93 0.73;1.18
≥3 380 47.2 0.88 0.71;1.08
To be continued
aged 20 or more, 87% reported not engaging in any leisure-time physical activity (deined as 30 minutes or more of physical exercises or sports at least one a week).11 In the city of Rio de Janeiro, Southeastern Brazil, in 1996, leisure-time physical inactivity rate (not engaging regularly in any physical activity or sports in the month prior to the interview) among men and women aged 12 or more was 59.8% and 77.8%, respectively.4 In Salvador, in 2000, the prevalence of leisure-time physical inactivity (not engaging in any physical activity during leisure time in a typical week) among men and women aged between 20 and 94 years was 60.4% and 82.7%, respectively.18 In the city of Pelotas, Southern Brazil, in 2003, the prevalence of leisure-time physical inactivity among men and women aged 20 years or more (evaluated using the International Physical Activity Questionnaire – long version and deined as score = zero minute per week) was 49.8% and 64.4%, respectively.5
The associations between leisure-time physical inac-tivity and sociodemographic factors found in the present study corroborate the indings of other studies conducted in Brazil1,4,5,11 and in the United States (US):8 older individuals with lower schooling had higher prevalence of physical inactivity. The asso-ciation between leisure-time physical inactivity and age among men only was also reported in the city of Pelotas in a study conducted in 2003.1 In the present study, among both men and women, no association was found between leisure-time physical inactivity and skin color, and pre-obesity and obesity, corroborating the Pelotas study.5
An inverse association was found between leisure-time physical inactivity and alcohol consumption with higher prevalence of inactivity (53.5%) among men who reported not abusing alcohol compared to those who reported alcohol abuse (34.4%). This behavior, also reported in other studies with industry workers
in the state of Santa Catarina2 and in the Behavioral Risk Factor Systemin the US,15 indicates a lifestyle where protective and risk factors coexist with leisure-time physical activity. This inding can be partially explained by the presence of a residual confounder not measured in the present study and, consequently, not controlled for in the analysis. For example, a Swedish study (The Malmö Diet and Cancer Study) found that individuals with lower leisure-time physical activity reported engaging less in social activities (parties, meetings, collective sports) compared to those with higher physical activity.7 Further studies are needed to investigate whether those who are physically inactive during leisure time would be less exposed to environ-ments facilitating alcohol consumption. The indings of the Lifestyle Study11 showed that Brazilian men engage more in group activities (soccer, volleyball, basketball) than women. Among Brazilian men, leisure-time physical activity is related more to pleasure and fun than health concerns.1,11
On the other hand, the association between employ-ment and leisure-time physical inactivity, indicating higher prevalence of inactivity among those employed compared to non-employed, can be easily explained by no time for leisure among working individuals, which is often reported as a barrier to physical exercises and sports.
Similar associations between leisure-time physical acti-vity and eating habits were seen in studies conducted in the US3,9,15 and European countries.10,16,20 Leisure-time physical activity was associated to higher intake of fruits, fruit juices, legumes, and green vegetables, lower intake of saturated and total fat3,9,10,15,21 and more healthy eating habits seen during breakfast.10,16
The indings of the present study are consistent with data of other population-based studies conducted through phone surveys and household interviews. The prevalence of leisure-time physical inactivity tends to ≥
≥
Table 3 continuation
Variable Crude analysis Adjusted analysis
n LTPI (%) PR 95% CI p-value PR 95% CI p-value
2nd Levela
Consumption of whole milk 0.018 0.052
No 176 33.0 1 1
Yes 546 47.8 1.46 1.07;1.99 1.36 1.00;1.85
Consumption of fatty meat or poultry with skin 0.002 0.170
Não 555 38.7 1 1
Sim 316 55.1 1.12 1.12;1.69 1.18 0.93;1.49
BMI: Body mass index
LTPI: Leisure-time physical inactivity
Table 4. Crude and adjusted prevalence ratios of the hierarchical model for the association between leisure-time physical inactivity, sociodemographic and protective or risk factors for chronic noncommunicable diseases among females. City of Florianópolis, Southern Brazil, 2005.
Variable Crude analysis Adjusted analysis
n LTPI (%) PR 95% CI p-value PR 95% CI p-value 1st Level
Age group (years) 0.653
18–24 190 60.0 1
25–34 246 64.6 1.08 0.91;1.28
35–44 236 63.6 1.06 0.89;1.27
45–54 168 54.8 0.91 0.73;1.14
55 and + 194 62 1.03 0.85;1.25
Skin color 0.715
White 709 60.9 1
Non-white 324 62.3 1.02 0.91;1.16
Schooling (years) 0.000 0.000
12 and + 279 47.7 1 1
9–11 324 59.9 1.25 1.09;1.44 1.27 1.11;1.45
5–8 208 65.4 1.37 1.15;1.62 1.40 1.18;1.66
0–4 224 76.8 1.60 1.39;1.85 1.70 1.47;1.98
Marital status 0.423
Single, widowed, or
separated 480 60.0 1
Married 554 62.6 1.05 0.94;1.16
Employment status 0.11 0.002
Yes 597 63.8 1 1
No 437 58.1 0.91 0.82;1.02 0.83 0.75;0.93
2nd Level
Nutritional status (BMI) 0.109 0.10
Non-excess weight 617 57.5 1 1
Overweight 217 60.8 1.06 0.92;1.22 1.09 0.94;1.27
Obesity 97 67.0 1.16 0.96;1.39 1.18 0.94;1.49
Alcohol abuseba 0.749
No 946 61.5 1
Yes 88 59.8 0.97 0.80;1.17
Smoking 0.595
Never smoked 662 60.1 1
Former smoker 179 63.1 1.05 0.91;1.21
Smoker 193 63.7 1.06 0.93;1.22
Consumption of fruits, legumes, and green vegetables (times/
day) 0.000 0.002
≥ 5 249 51.0 1 1
3–4 451 60.5 1.19 1.02;1.39 1.23 1.05;1.45
1–2 262 67.2 1.32 1.12;1.56 1.34 1.12;1.60
< 1 73 80.8 1.59 1.27;1.99 1.46 1.04;2.05
Consumption of carbonated beverages (times/week) 0.055 0.344
Seldom 428 57.5 1 1
1–2 356 61.8 1.07 0.95;1.22 0.99 0.85;1.16
≥ 3 249 67.5 1.17 1.03;1.33 1.09 0.93;1.27
be incorporated into risk behaviors for CNCD such as smoking (among men) and less healthy eating habits especially among women. Other factors that were not investigated in the present study, such as healthy food price (e.g., prices of fruits, legumes, and green vegeta-bles), purchase power, and environmental background characteristics, could help interpreting associations between unhealthy eating patterns and leisure-time physical inactivity.
In conclusion, the indings of the present study indicate that, among women, leisure-time physical inactivity is more likely in those with less than 12 years of
schooling, those who were employed and those repor-ting intake of fruits, legumes and green vegetables less than ive times a day and intake of whole milk. Among men, leisure-time physical inactivity was more likely to be associated to older age, lower schooling, and employment; inactivity was less likely among those who reported alcohol abuse.
The availability of comprehensive data as well as a surveillance system of health risk factors can help the development of speciic actions for promoting more healthy and active lifestyles among adults.
Table 4 continuation
Variable Crude analysis Adjusted analysis
n LTPI (%) PR 95% CI p-value PR 95% CI p-value
2nd Level
Consumption of whole milk 0.000 0.000
No 289 45.3 1 1
Yes 529 70.32 1.55 1.34;1.80 1.37 1.19;1.58
Consumption of fatty meat or poultry with skin 0.003 0.729
No 629 59.9 1 1
Yes 235 71.5 1.20 1.06;1.34 1.03 0.88;1.21
BMI: Body mass index
LTPI: Leisure-time physical inactivity
aAdjusted for the entire adult population in the city
1. Azevedo MR, Araújo CL, Reichert FF, Siqueira FV, Silva MC, Hallal PC. Gender differences in leisure-time physical activity. Int J Public Health. 2007;52(1):8-15. DOI: 10.1007/s00038-006-5062-1
2. Barros MVG, Nahas MV. Comportamentos de risco, auto-avaliação do nível de saúde e percepção de estresse entre trabalhadores da indústria. Rev Saude Publica. 2001;35(6):554-63. DOI: 10.1590/S0034-89102001000600009
3. Gillman MW, Pinto BM, Tennstedt S, Glanz K, Marcus B, Friedman RH. Relationships of physical activity with dietary behaviors among adults. Prev Med.
2001;32(3):295-301. DOI: 10.1006/pmed.2000.0812
4. Gomes VB, Siqueira KS, Sichieri R. Atividade física em uma amostra probabilística da população do Município do Rio de Janeiro. Cad Saude Publica. 2001;17(4):969-76. DOI: 10.1590/S0102-311X2001000400031
5. Hallal PC, Reichert FF, Siqueira FV, Dumith SC, Bastos JP, Silva MC, et al. Correlates of leisure-time physical activity differ by body-mass-index status in Brazilian adults. J Phys Act Health. 2008;5(4):571-8.
6. Haskell LW, Lee IM, Pate RR, Powell KE, Blair SN, Franklin BA, et al. Physical activity and public health: updated recommendation for adults from the American College of Sports Medicine and the American Heart Association. Circulation. 2007;116(9):1081-93. DOI: 10.1161/CIRCULATIONAHA.107.185649
7. Lindström M, Hanson BS, Ostergren PO.
Socioeconomic differences in leisure-time physical activity: the role of social participation and social capital in shaping health related behavior. Soc Sci Med. 2001;52(3):441-51. DOI: 10.1016/S0277-9536(00)00153-2
8. Marshall SJ, Jones DA, Ainsworth BE, Reis JP, Levy SS, Macera CA. Race/ethnicity, social class, and leisure-time physical inactivity. Med Sci Sports Exerc. 2007;39(1):44-51. DOI: 10.1249/01. mss.0000239401.16381.37
9. Matthews CE, Hebert JR, Ockene IS, Saperia G, Merriam PA. Relationship between leisure-time physical activity and selected dietary variables in the Worcester Area Trial for Counseling in Hyperlipidemia.
Med Sci Sports Exerc. 1997;29(9):1199-207. DOI: 10.1097/00005768-199709000-00013
10. Mensink GB, Loose N, Oomen CM. Physical activity and its association with other lifestyle factors. Eur J Epidemiol. 1997;13(7):771-8. DOI: 10.1023/ A:1007474220830
11. Monteiro CA, Conde WL, Matsudo SM, Matsudo VR, Bonsenor IM, Lotufo PA. A descriptive epidemiology of leisure-time physical activity in Brazil, 1996-1997. Rev Pan Saude Publica. 2003;14(4):246-54. DOI: 10.1590/ S1020-49892003000900005
12. Monteiro CA, Moura EC, Jaime PC, Lucca A, Florindo AA, Figueiredo ICR, et al. Monitoramento de fatores de risco para doenças crônicas não transmissíveis por meio de entrevistas telefônicas. Rev Saude Publica. 2005;39(1):47-57. DOI: 10.1590/S0034-89102005000100007
13. Monteiro CA, Florindo AA, Claro RM, Moura EC. Validade de indicadores de atividade física e sedentarismo obtidos por inquérito telefônico. Rev Saude Publica. 2008;42(4):575-81. DOI: 10.1590/ S0034-89102008000400001
14. Monteiro CA, Moura EC, Jaime PC, Claro RM. Validade de indicadores do consumo de alimentos e bebidas obtidos por inquérito telefônico. Rev Saude Publica. 2008;42(4):582-9. DOI: 10.1590/S0034-89102008000400002
15. Mukamal KJ, Ding EL, Djoussé L. Alcohol consumption, physical activity, and chronic disease risk factors: a population-based cross-sectional survey. BMC Public Health. 2006;6:118. DOI: 10.1186/1471-2458-6-118
16. Oppert JM, Thomas F, Charles MA, Benetos A, Basdevant A, Simon C. Leisure-time and occupational physical activity in relation to cardiovascular risk factors and eating habits in French adults. Public Health Nutr. 2006;9(6):746-54. DOI: 10.1079/PHN2005882 17. Peixoto MRG, Monego ET, Alexandre VP, Souza
RG, Moura EC. Monitoramento por entrevistas telefônicas de fatores de risco para doenças crônicas: experiência de Goiânia, Goiás, Brasil. Cad Saude Publica. 2008;24(6):1323-33. DOI: 10.1590/S0102-311X2008000600013
18. Pitanga FJ, Lessa I. Prevalência e fatores associados ao sedentarismo no lazer em adultos. Cad Saude Publica. 2005;21(3):870-7. DOI: 10.1590/S0102-311X2005000300021
19. Sofi F, Capalbo A, Marcucci R, Gori AM, Fedi S, Macchi C, et al. Leisure time but not occupational physical activity significantly affects cardiovascular risk factors in an adult population. Eur J Clin Invest. 2007;37(12):947-53. DOI: 10.1111/j.1365-2362.2007.01884.x 20. Tormo MJ, Navarro C, Chirlaque MD, Barber X,
Argilaga S, Agudo A. Physical sports activity during leisure time and dietary intake of foods and nutrients in a large Spanish cohort. Int J Sport Nutr Exerc Metab.
2003;13(1):47-64.
21. Victora CG, Huttly SR, Fuchs SC, Olinto MT. The role of conceptual frameworks in epidemiological analysis: a hierarchical approach. Int J Epidemiol.
1997;26(1):224-7. DOI: 10.1093/ije/26.1.224
22. World Health Organization. Obesity: Preventing and managing the global epidemic. Report of the WHO Consultation of Obesity. Geneva; 1998.
23. World Health Organization. Global strategy on diet, physical activity and health. Geneva; 2004.[Fifty-Seventh World Health Assembly, WHA 57.17]
REFERENCES
Study funded by the Conselho Nacional de Desenvolvimento Científico e Tecnológico (CNPq – National Council for Scientific and Technological Development, Process No.: 477272/2004-5)