& !
Rev Saúde Pública 2005;39(2):183-90 www.fsp.usp.br/rsp
Blood glucose control in diabetes patients
seen in primary health care centers
Controle glicêmico em pacientes diabéticos
atendidos em centros de atenção primária à
saúde
M aria Cecília F Assunçãoa, Iná S Santosb and N eiva C J Vallec
aDepartamentode Nutrição. Faculdade de Nutrição. Universidade Federal de Pelotas (UFPel). Pelotas,
RS, Brasil. bDepartamento de Medicina Social. Faculdade de Medicina. UFPel. Pelotas, RS, Brasil. cDepartamento de Matemática, Estatística e Computação. Instituto de Física e Matemática. UFPel.
Pelotas, RS, Brasil
Correspondence to:
Maria Cecília F. Assunção Faculdade de Nutrição - UFPel Caixa Postal 354 Campus Universitário 96010-900 Pelotas, RS, Brasil
E-mail: mcassuncao@epidemio-ufpel.org.br
Based on the doctorate tesis submitted to the Programa de Pós-Graduação em Epidemiologia da Universidade Federal de Pelotas in 2002.
Received on 1/1/2004. Reviewed on 18/8/2004. Approved on 24/9/2004.
Keywords
Diabetes mellitus, prevention & control. Primary health care. Delivery of health care. Diabetes mellitus, metabolism. Hyperglycemia. Socioeconomic factors.
D escritores
Diabetes mellitus, prevenção & controle. Cuidados primários de saúde. Prestação de cuidados de saúde. Diabetes mellitus,
metabolismo. Hiperglicemia. Fatores socioeconômicos.
Abstract
Objective
To identify factors associated to poor glycemic control among diabetic patients seen at primary health care centers.
Methods
A cross-sectional study was carried out in a sample of 372 diabetic patients attending 32 primary health care centers in southern Brazil. Data on three hierarchical levels of health unit infrastructure, medical care and patient characteristics were collected.
Results
The frequency of poor glycemic control was 50.5%. Multivariate analysis (multilevel method) showed that patients with body mass indexes below 27 kg/m2, patients on oral hypoglycemic agents or insulin, and patients diagnosed as diabetic over five years prior to the interview were more likely to present poor glycemic control when compared to their counterparts.
Conclusions
Given the hierarchical data structuring, all associations found suggest that factors associated to hyperglycemia are related to patient-level characteristics.
Resumo
Objetivo
Identificar fatores associados à falta de controle glicêmico em pacientes diabéticos atendidos em centros de atenção primária à saúde.
Métodos
Estudo transversal em amostra de 372 pacientes diabéticos atendidos nos 32 centros de atenção primária de uma cidade do sul do Brasil. Foram coletados dados ordenados em três níveis hierárquicos: estrutura das unidades de saúde, características do processo do cuidado médico e pacientes diabéticos.
Resultados
A freqüência de falta de controle glicêmico foi de 50,5%. A análise multivariada (método multinível) mostrou que pacientes com Índice de Massa Corporal abaixo de
27 kg/m2, em tratamento medicamentoso e com mais de cinco anos de diagnóstico de
& " Rev Saúde Pública 2005;39(2):183-90 www.fsp.usp.br/rsp
Characteristics associated to glycemic control Assunção MCF et al
Conclusões
Considerando a estrutura hierárquica dos dados, todas as associações encontradas sugerem que os fatores associados à hiperglicemia são relacionados a características dos pacientes.
INTRODUCTION
The association between diabetes complications and high glucose levels was postulated in the early twentieth century. Only during the last three decades, however, clinical research performed on diabetic pa-tients directly associated hyperglycemia to the de-velopment of complications.1 Adequate diabetes care, which includes glycemic control and early screening and treatment for end-organ damage, can prevent the appearance of severe complications. The greatest chal-lenge, however, resides in the fact that the treatment of such a complex disease requires multiple proc-esses and decisions which involve both healthcare providers and patients. Despite the numerous techni-cal advances observed in diabetes control and evalu-ation, diabetes care remains, perhaps, the most com-plex chronic disease to be managed at the primary health care level.12
There is a lack of studies in the literature designed to assess effectiveness of care of diabetic patients who are cared by primary health care physicians. The pur-pose of this study was to identify factors associated to poor glycemic control among diabetic patients seen at the primary health care network (PHCN).
M ETHODS
A cross-sectional study was conducted in the city of Pelotas, southern Brazil, between May and December 1998. A city of 320,000 inhabitants, 30% of Pelotas’ population are regular users of the PHCN. Coverage of this system reaches mainly individuals from poor so-cial classes. The sample size was calculated to detect a 2 prevalence ratio, given a 20% prevalence of glycemic control among unexposed individuals. This preva-lence was identified by a cross-sectional study per-formed in a primary health care facility.2 The exposure used for calculating the sample size was compliance with the recommended diet. In the aforementioned study it was observed for one in four subjects. Assum-ing 80% power and a 5% significance level, it resulted in a sample of 232 diabetic patients. This was increased by 15% for confounder control, and by 15% for possi-ble losses and refusals, leading to a total sample of 372 subjects. During the study period, the PHCN in the
city’s urban area comprised 32 health centers. A trained field worker visited every health center and examined all claims that would be submitted for federal reim-bursement searching for registries of diabetes diag-noses. In two non-consecutive weeks every health center was screened to identify at least 15 diabetic patients, who attended a medical visit in the previous seven days. At centers where the number of diabetic patients identified were smaller than 15, the screening was extended by a further 15 days, after which it was interrupted at the number already found.
Each subject received a home visit during the week following consultation. To be included in the study, the patient was required to be aware of his/her dia-betic condition, to live within the city’s urban area, and not to be hospitalized at the time of the inter-view. A pre-tested structured questionnaire was ap-plied by trained interviewers in order to identify the following characteristics: demographics (gender, race, marital status, and age); socio-economic data (years of schooling and income); disease history (time span since diagnosis, family history, and hospitalization during the preceding year); self-reported co-morbidi-ties (heart or kidney disease, retinopathy, and sys-temic arterial hypertension); self-reported compliance with the treatment prescribed (diet, physical activity, and medication), smoking history, and number of vis-its in the preceding six months.
At the end of the interview patients were weighed and their height was measured by study personnel using a portable scale and anthropometer. The body mass index (BMI) was calculated as weight (kg) di-vided by height squared (m2). Blood pressure was measured in seated position, once on each arm, and measurements were corrected for arm perimeter,15 and the average of both arms was registered. Aneroid sphygmomanometers, calibrated monthly, were em-ployed. Capillary glycemia was measured at house-holds with a Glucotrend brand (Boehringer Mannheim). The values set for determining poor glycemic con-trol (dependent variable) were based upon levels de-fined by the American Diabetes Association (ADA)1 and the Latin American Diabetes Association (ALAD).* Results over 10 mmol/L (180 mg/dL) were considered hyperglycemia.
& #
Rev Saúde Pública 2005;39(2):183-90 www.fsp.usp.br/rsp
Characteristics associated to glycemic control Assunção MCF et al
Health center infrastructure and medical care were also assessed and have been published previously.3 Briefly, information on medication and supplies avail-ability (oral hypoglycemic agents, insulin, and blood glucose strips); adoption of a specific diabetes man-agement program; use of special registration forms for diabetic patients; health center opening hours; ap-pointment scheduling; and distribution of educational material directed to self-care of diabetic patients, were gathered by interviewing health facilities’ managers. All medical doctors attending diabetic patients in every health center were interviewed concerning their medi-cal specialty, current number of jobs, duration of ten-ure at the health center, and self-reported satisfaction with care delivered. Based upon recommendations from the American Diabetes Association,1 the quality of the care provided was assessed by asking medical doctors about physical examination and case management at their first contact with patients already known to have diabetes. Right answers should include, at least, meas-ure of the patient’s weight, prescription of diet and physical activity, and request of glycated hemoglobin test. Also, medical records were analyzed for at least one record of weight, blood pressure, and glycemia during the preceding year.
To check reliability of the data collected, 10% of the interviews with health center managers, physicians, and patients, randomly selected, were repeated by the fieldwork supervisor. The Kappa test results were al-ways higher than 0.85. This study has been approved by the Ethics Committee of the Faculdade de Medicina
da Universidade Federal de Pelotas and Secretaria
Municipal de Saúde. Data analyses were conducted
by logistic regression (multilevel method).10 A multi-variate model, aiming at taking into account the inter-dependence between patients attending the same PHC center, was used. The highest hierarchical level was the PHC center, the second level was the physicians, and the third level was the patients. Analyses were car-ried out according to a conceptual model for deter-mining poor glycemic control.
Considering the differences in diabetic patient enrollment time among the various health facilities, as
well as the possibility that patients seen at centers with lower demand could hence be managed less efficiently and, consequently, have worse disease control, data were weighted according to the number of patients per health center. After weighting, however, the propor-tion of patients with poor glycemic control did not change more than 1%, and thus this procedure was not taken into account in subsequent analyses.
RESU LTS
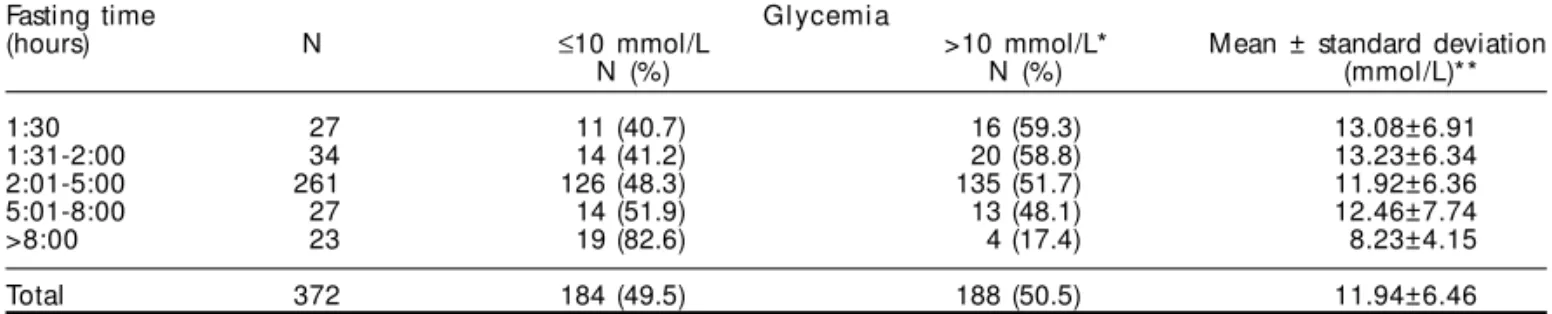
A total of 461 diabetic patients were identified. Of these, 65 were excluded: three died before the inter-view; five were hospitalized; 13 lived in other cities; and 44 were not aware of having diabetes. Of 396 eligible patients, eight refused to be interviewed and ten were not found at home after three visits on differ-ent days and at differdiffer-ent times, which resulted in 4.5% loss. Of 378 diabetic patients interviewed, 372 were included in the study – four were under 20 years old while inclusion criteria were for adult patients1 and two refused capillary blood sampling. The number of patients screened per facility ranged from two to 23. Table 1 describes the distribution of glycemic levels in relation to fasting period. A 50.5% prevalence of poor glycemic control was found. The minimal post-prandial period before blood collection was 1.5 hour. Most measurements (77%) were performed after peri-ods of fasting ranging between two and eight hours. The frequency of glycemic control increased linearly with the duration of the fasting period (p=0.02).
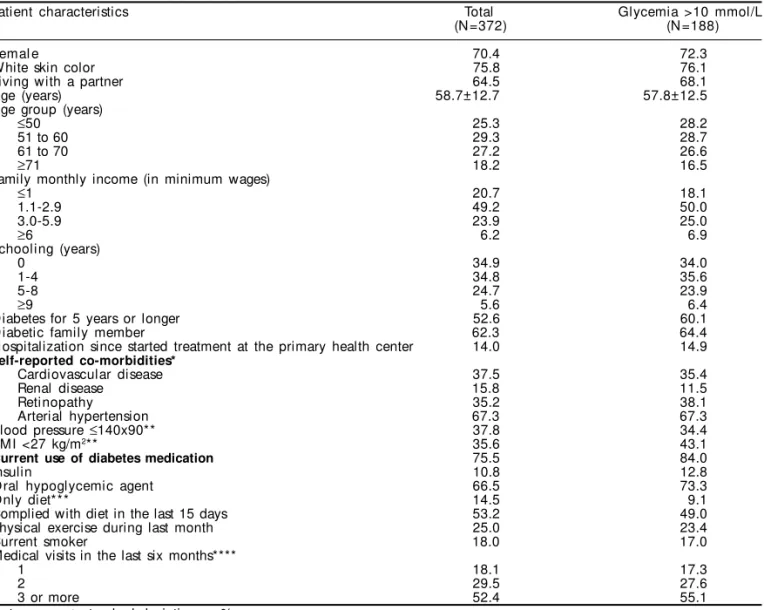
The majority of the subjects presenting hyperglyc-emia was over 50 years old, had a family income of fewer than three minimum wages, and up to eight years of schooling. About 15% of them had a history of at least one hospitalization due to diabetes since treat-ment was initiated in the health center at which they were identified. Among subjects who were diagnosed as having diabetes over five years prior to the inter-view, hypertension was the most prevalent self-reported co-morbidity. One third of the subjects presented nor-mal blood pressure, and about 43.1% had BMI below 27 kg/m2. As to treatment regimen, 84% said to be using an oral hypoglycemic agent. Of the 143
hyperg-Table 1 - Distribution of glycemic levels according to time since last meal. Pelotas, Brazil, 1998.
Fasting time Gl ycemi a
(hours) N ≤10 mmol/L >10 mmol/L* Mean ± standard deviation
N (%) N (%) (mmol/L)**
1:30 27 11 (40.7) 16 (59.3) 13.08±6.91
1:31-2:00 34 14 (41.2) 20 (58.8) 13.23±6.34
2:01-5:00 261 126 (48.3) 135 (51.7) 11.92±6.36
5:01-8:00 27 14 (51.9) 13 (48.1) 12.46±7.74
>8:00 23 19 (82.6) 4 (17.4) 8.23±4.15
Total 372 184 (49.5) 188 (50.5) 11.94±6.46
& $ Rev Saúde Pública 2005;39(2):183-90 www.fsp.usp.br/rsp
Characteristics associated to glycemic control Assunção MCF et al
lycemic patients who reported having received dietary advice, 49% said to have followed it in the last 15 days. The majority of patients (83%) had two or more visits in the previous six months (Table 2).
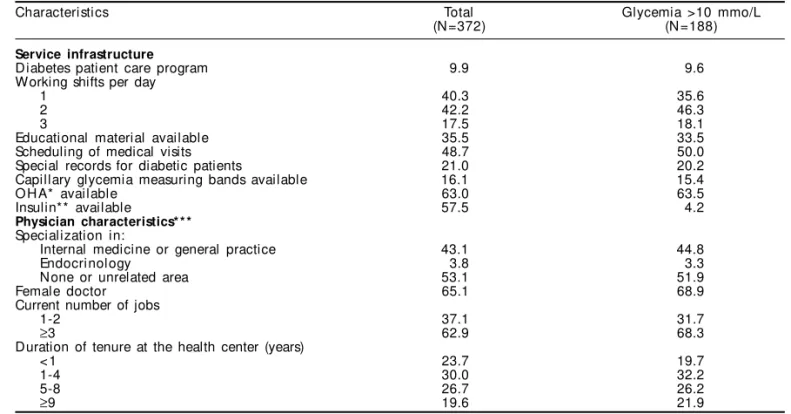
Characteristics of facility infrastructure as well as aspects of medical care of all patients included in the study and those presenting hyperglycemia are de-scribed in Table 3. Of all the patients seen at the health centers, 10% followed some kind of diabetes care pro-gram. Diabetic patients were assisted by 58 physi-cians and 52% hyperglycemic patients were managed by non-specialists, or by professionals specialized in internal medicine or general practice. About 80% of the patients were seen by physicians who worked at the health centers for over one year. The majority was seen by female physicians (65%), who had three or more different jobs (63%), and who reported them-selves as being satisfied with the available condi-tions at the health facility for diabetic patient man-agement. Table 3 shows that among patients using
oral hypoglycemic agents - OHA (n=246) or insulin (n=40), 63.0% and 57.5% attended visits where those medications were regularly available.
Of all subjects, 24 (6.5%) were seen by medical doctors who reported that at their first contact with an already known diabetic patient they would weigh the patient, prescribe a diet and physical activity, and request glycated hemoglobin for glycemic control evaluation purposes (there were no restrictions for this test in the PHCN). Considering 323 patients whose records could be analyzed, for 166 (51%) of them there was at least one record containing weight, blood pressure, and glycemia levels.
Crude analysis showed that lower BMI, longer span since diagnosis, insulin or oral hypoglycemic agent treatment, and physician having many jobs were vari-ables statistically associated to poor glycemic con-trol. The multivariate analysis isdescribed in Table 4. Variables which remained associated to
hyperglyc-Table 2 - D istribution and frequency of glycemia according to demographic and socio-economic characteristics, self-reported co-morbidities, disease history, and clinical management of patients.
Patient characteristics Total Glycemia >10 mmol/L
(N =372) (N =188)
Femal e 70.4 72.3
White skin color 75.8 76.1
Living with a partner 64.5 68.1
Age (years) 58.7±12.7 57.8±12.5
Age group (years)
≤50 25.3 28.2
51 to 60 29.3 28.7
61 to 70 27.2 26.6
≥71 18.2 16.5
Family monthly income (in minimum wages)
≤1 20.7 18.1
1.1-2.9 49.2 50.0
3.0-5.9 23.9 25.0
≥6 6.2 6.9
Schooling (years)
0 34.9 34.0
1-4 34.8 35.6
5-8 24.7 23.9
≥9 5.6 6.4
Diabetes for 5 years or longer 52.6 60.1
Diabetic family member 62.3 64.4
Hospitalization since started treatment at the primary health center 14.0 14.9
Self-reported co-morbidities*
Cardiovascular disease 37.5 35.4
Renal disease 15.8 11.5
Retinopathy 35.2 38.1
Arterial hypertension 67.3 67.3
Blood pressure ≤140x90** 37.8 34.4
BMI <27 kg/m2** 35.6 43.1
Current use of diabetes medication 75.5 84.0
Insulin 10.8 12.8
O ral hypoglycemic agent 66.5 73.3
Only diet*** 14.5 9.1
Complied with diet in the last 15 days 53.2 49.0
Physical exercise during last month 25.0 23.4
Current smoker 18.0 17.0
Medical visits in the last six months****
1 18.1 17.3
2 29.5 27.6
3 or more 52.4 55.1
Data: mean ± standard deviation or % BMI: Body mass index
*Only subjects diagnosed as diabetic over 5 years prior to the interviews (N=196/113) **N =370/186
& %
Rev Saúde Pública 2005;39(2):183-90 www.fsp.usp.br/rsp
Characteristics associated to glycemic control Assunção MCF et al
emia after controlling for family income, age, and fasting time were BMI, use of pharmacological treat-ment, and time span since diagnosis. Patients with BMI below 27 kg/m2 had a 1.72 odds ratio (OR) (95% CI 1.09-2.70) for poor glycemic control compared to those with BMI equal or above 27 kg/m2. The odds ratio for hyperglycemia in patients aware of their dis-ease for over five years was about 70% higher than that of diabetic patients with more recent diagnoses (OR=1.69; 95% CI 1.09-2.63). Insulin or oral hy-poglycemic agent use was also associated to poor glycemic control (OR=2.56; 95% CI 1.49-4.34).
D ISCU SSIO N
This study has simultaneously evaluated patient demographic and socio-economic characteristics,
treatment regimens, health facility infrastructure data and medical care delivered in a community-based representative sample of primary care patients. Con-sidering the reported 4% diabetes mellitus prevalence among adults in urban Brazil14 and the 30%, Pelotas PHCN utilization,6 the studied sample probably in-cluded about 20% of all adult diabetic patients seen by PHC physicians in the city.
The analysis performed through the multilevel method is a positive aspect of this study. Contextual or multilevel analysis challenge researchers to develop conceptual models which are able to extend through various levels and explain how group and subject-level variables interact.7 When the units in each level share a similar environment, or have similar characteristics, such as patients seen by the same physician or
physi-Table 3 - Distribution and frequency of glycemia of patients according to service infrastructure and physician characteristics of the primary health care system.
Characteristics Total Glycemia >10 mmo/L
(N =372) (N =188)
Service infrastructure
D iabetes patient care program 9.9 9.6
Working shifts per day
1 40.3 35.6
2 42.2 46.3
3 17.5 18.1
Educational material available 35.5 33.5
Scheduling of medical visits 48.7 50.0
Special records for diabetic patients 21.0 20.2
Capillary glycemia measuring bands available 16.1 15.4
O H A* available 63.0 63.5
Insulin** available 57.5 4.2
Physician characteristics* * *
Specialization in:
Internal medicine or general practice 43.1 44.8
Endocrinology 3.8 3.3
None or unrelated area 53.1 51.9
Female doctor 65.1 68.9
Current number of jobs
1-2 37.1 31.7
≥3 62.9 68.3
Duration of tenure at the health center (years)
< 1 23.7 19.7
1-4 30.0 32.2
5-8 26.7 26.2
≥9 19.6 21.9
Data: mean ± standard deviation or %
*Only for oral Hypoglycemic Agent users (N=246/137) **Only for insulin users (N=40/24)
***N =367/183
Table 4 - Crude and adjusted odds ratio (OR) for glycemia according to patient BMI, time span since diagnosis and use of insulin or hypoglycemic agents.
Variable Crude OR p-val ue Adjusted OR* p-val ue
(95% CI) (95% CI)
BMI**<27 kg/m2 0.01 0.02
N o 1.00 1.00
Yes 1.89 (1.20-2.86) 1.72 (1.09-2.70)
Time with diabetes 0.005 0.02
Less than 5 years 1.00 1.00
5 years or more 1.85 (1.22-2.78) 1.69 (1.09-2.63)
Use of insulin and/or OHA*** <0.001 <0.001
N o 1.00 1.00
Yes 2.70 (1.59-4.35) 2.56 (1.49-4.34)
BMI: Body mass index
*Adjusted for family income, age and fasting time * * N =370
& & Rev Saúde Pública 2005;39(2):183-90 www.fsp.usp.br/rsp
Characteristics associated to glycemic control Assunção MCF et al
cians of the same health facility, this assumed inde-pendence is violated, and a correlation emerges among the units of a same group.7,10 Such correlation can render the use of traditional regression models infeasi-ble for they are based upon the assumption that sub-jects being studied are independent from one another as well as from the outcome.
Apart from design constraints in terms of causality determination, this study has other methodological limitations that should be considered when interpret-ing its findinterpret-ings. Other patient characteristics, as self-care abilities and psychosocial adjustment for deal-ing with the disease, for example, were not measured. The main limitation, however, was how the assess-ment of medical care was investigated. It was based upon physicians self-reports, which could not always be compared to visit records (13% of patient files could not be located). In addition, the medical records generally contained only very brief descriptions, if any, being practically limited to the recording of blood pressure and test results. Consultation observations were not included in this study; these observations, although likely to overestimate the performance of certain procedures and managements, are indicated when recording is poor.8
An interesting finding was that half of the patients seen by internists or general practitioners had good glycemic control, pointing out to the adequacy of non-specialist medical doctors for managing diabetic patients at the PHC level (Table 3).
The use of capillary glycemia is another limita-tion of this study. Patient care should be evaluated through diabetes control, and that this control should be confirmed through glycated hemoglobin measurement, preferably A1c glycated hemoglobin (HbA1c). In a local study,2 however, 30% of patients did not show up for glycated hemoglobin measure-ments, and a similar proportion would likewise be expected in this study due to the similarities be-tween the populations studied. Such high loss would impair risk factor analysis.
Recent studies, however, have showed that post-prandial hyperglycemia is an independent risk factor for heart disease in type-2 diabetes patients. This sug-gests that treatment efficacy evaluations cannot be restricted to fasting plasma glucose and/or HbA1c evaluation,12,17,20 which would justify measurements at other times of the day. Thus, the finding of 50% hyperglycemic subjects in postprandial state or after more hours of fasting a short time after consultation – when all therapeutic recommendations should have been reviewed and/or reinforced – is worrisome for it
indicates that these patients are likely to remain in this state most of the time, which certainly has an effect upon the evaluation of disease control and the occurrence of complications.
In this study, no association (multilevel method) was found between poor glycemic control and health facility infrastructure or physician characteristics. It showed to be associated, instead, to the patient char-acteristics (time span since diagnosis, BMI and use of pharmacological treatment).
Due to the high prevalence of the outcome studied, however, risk estimates expressed as odds ratios were surely overestimating the actual relative risk.18 The crude odds ratios shown in Table 4, however, did not change the direction of the effects seen in the preva-lence ratios.
The observed association between hyperglycemia and time span since diagnosis is consistent with the literature5,9 suggesting that among diabetic patients a decreased sensitivity to insulin or a progressive fail-ure of pancreatic β-cells function develops over time.
Also in agreement with the literature is the observed association between poor glycemic control and the use of oral hypoglycemic agents,5,9 which remained significant even after controlling for time span since diagnosis. Corroborating to it is the fact that, in the studied sample, 41% of the patients in use of an oral hypoglycemic agent were taking dosages below or above those considered clinically effective.4 A sub-analysis of the patients receiving adequate dose, as an independent variable, however, showed no significant association with the glycemic control. Another aspect to be considered is that drug prescription for type-2 diabetic patients is recommended only when dietary and lifestyle changes fail to control the disease.19 Thus, drug prescription is compatible with manifestations of more severe forms of the disease, which go together with a greater occurrence of poor glycemic control.
& '
Rev Saúde Pública 2005;39(2):183-90 www.fsp.usp.br/rsp
Characteristics associated to glycemic control Assunção MCF et al
to require the use of insulin for glycemic control,16 and that this type of treatment is more likely to be used by slimmer patients.19 In Brazil this proportion is about 8%, possibly indicating a lack of training among medi-cal doctors on insulin prescription to type-2 diabetic patients.16 Reluctance of the latter’s in using this kind of medication can not also be ruled out. The high preva-lence of diabetes-related co-morbiditiesreported by subjects diagnosed as diabetic over five years prior to the interview is equally important. Even considering that the study design does not allow analyses of tem-porality, this finding suggests that these co-morbidities can be due to poorly-controlled diabetes. The fre-quency of these conditions, however, was obtained through self-reporting, which is a limitation in this study. For this reason, such characteristics were taken into consideration for descriptive purposes only, not being employed in the multivariate analysis.
In conclusion, inferences about the adequacy of the impact of diabetic patients care at PHCN in Pelotas can be properly drawn from this study.10 The results showed that only half of the patients met the set crite-ria for adequate glycemic control. Only vacrite-riables at the patient level showed to be statistically associated
with the outcome. Among those, the use of drug therapy for diabetes management was most strongly associated with poor glycemic control. Drug prescrip-tion, however, is a medical action and part of the dis-ease control depends upon its appropriateness. As is the case in many PHC settings in developing coun-tries, at the time of this study there was no diabetic patient care program running at local level. From the study results it seems that such a program is needed. The totality of the health facilities should be appro-priately equipped for diabetes care and protocols for case management should be instituted as a mean of care process orientation. Meanwhile, in the short term, special attention must be given to patients diagnosed as diabetic a long while ago, as well as to the ad-equacy of drug prescription and to weight monitor-ing of diabetic patients.
ACKN O W LED GM EN TS
To the head of the “Secretaria Municipal de Saúde de Pelotas” for his prompt interest on adopting a Dia-betes Management Program to be implemented in the entire primary health care system of the Pelotas city as a result of the study findings.
REFEREN CES
1. American D iabetes Association. Standards of medical care in diabetes. Diabetes Care 2004;27 Suppl 1:S15-S35.
2. Araújo RB, Santos I, Cavaleti MA, Costa JSD, Béria JU. Assessment of diabetic patient management at primary health care level. Rev Saúde Pública 1999;33:24-32.
3. Assunção MC, Santos IS, Gigante DP. Atenção primária em diabetes no sul do país: estrutura, processo e resultado. Rev Saúde Pública 2001;35:88-95.
4. Assunção MC, Santos IS, Costa JSD. Clinical management of diabetic patients: process evaluation in Pelotas, Southern Brazil. Cad Saúde Pública 2002;18:205-11.
5. Blaum CS, Velez L, Hiss RG, Halter JB. Characteristics related to poor glycemic control in NIDDM patients in community practice. Diabetes Care 1997;20:7-11.
6. Costa JSD, Fachini LA. Use of outpatient services in an urban area of Southern Brazil: place and frequency. Rev Saúde Pública 1997;31:360-9.
7. Diez-Roux AV. Bringing context back into epidemiology: variables and fallacies in multilevel analysis. Am J Public Health 1998;88:216-22.
8. Donabedian A. The quality of care. How can it be assessed? JAMA 1988;260(12):1743-8.
9. Ferrannini E, Stern MP, Galvan AQ, Mitchell BD, Hafner SM. Impact of associated conditions on glycemic control of NIDDM patients. Diabetes Care 1992;15:508-14.
10. Goldstein H. Multilevel statistical models. 2nd ed. London: Kendall’s Library of Statistics; 1995.
11. Habicht JP, Victora CG, Vaughan JP. Evaluation designs for adequacy, plausibility and probability of public health programme performance and impact. Int J Epidemiol 1999;8:10-8.
12. Hanefeld M, Koehler C, Schaper F, Fuecker K, H enkel E, Temelkova-Kurktschiev T. Postprandial plasma glucose is an independent risk factor for increased carotid intima-media thickness in non-diabetic individuals. Atherosclerosis 1999;144:229-35.
' Rev Saúde Pública 2005;39(2):183-90 www.fsp.usp.br/rsp
Characteristics associated to glycemic control Assunção MCF et al
14. Malerbi DA, Franco LJ. The Brazilian Cooperative Group on the Study of Diabetes Prevalence. Multicenter study of the prevalence of diabetes mellitus and impaired glucose tolerance in the urban Brazilian population aged 30-69 years. Diabetes Care 1992;15:1509-16.
15. Maxwell MH, Schroth PC, Dornfield LP, Waks AU, Karam M. Error in blood-pressure measurement due to incorrect cuff size in obese patients. Lancet 1982;2:33-6.
16. Ministério da Saúde. Diabetes mellitus: guia básico para diagnóstico e tratamento. Brasília (DF); 1997.
17. Parkin CG, Brooks N. Is postprandial glucose control important? Is it practical in primary care settings? Clin Diabetes 2002;20:71-6.
18. Rothman KJ, Greenland S. Modern epidemiology. 2nd ed. Philadelphia: Lippincott-Raven; 1998.
19. Schmidt MI. Diabetes mellitus. In: Duncan BB, Schmidt MI, Giugliani E et al. Medicina ambulatorial: condutas clínicas em atenção primária. Porto Alegre: Artes Médicas; 1996. p. 476-89.
20. Temelkova-Kurktschiev TS, Koehler C, H enkel D, Leonhardt W, Fuecker K, Hanefeld M . Postchallenge plasma glucose and glycemic spikes are more strongly associated with atherosclerosis than fasting glucose or HbA1c level. Diabetes Care