N
o
ta
T
é
c
ni
c
a
*e-mail: [email protected]
DEVELOPMENT OF A UV/VIS SPECTROPHOTOMETRIC METHOD FOR ANALYSIS OF TOTAL POLYPHENOLS FROM Caesalpinia peltophoroides BENTH.
Fernanda G. Bueno, Maria A. D. Machareth, Gean P. Panizzon, Gisely C. Lopes e João C. P. Mello*
Departamento de Farmácia, Universidade Estadual de Maringá, Av. Colombo, 5790, 87020-900 Maringá - PR, Brasil Eneri V. S. Leite-Mello
Departamento de Ciências Morfológicas, Universidade Estadual de Maringá, Av. Colombo, 5790, 87020-900 Maringá - PR, Brasil
Recebido em 23/8/11; aceito em 3/11/11; publicado na web em 4/1/12
Caesalpinia peltophoroides is a domesticated tree found in Brazil. It was necessary to develop an analytical method to determine the content of total polyphenols (TP) in this herbal drug. The pre-analytical method was standardized for analysis time, wavelength, and the best standard to use. The optimum conditions were: pyrogallol, 760 nm, and 30 min respectively. Under these conditions, validation by UV/Vis spectrophotometry proved to be reliable for TP of the crude extract and semipuriied fractions from C. peltophoroides. Standardization is required for every herbal drug, and this method proved to be linear, precise, accurate, reproducible, robust, and easy to perform.
Keywords: Caesalpinia peltophoroides; total polyphenols; UV/VIS spectroscopy validation.
INTRODUCTION
The family Fabaceae contains the second-largest number of medicinal plants worldwide.1 In Brazil, the family includes over 210 genera and 2694 species.2 One of its members, Caesalpinia peltophoroides Benth. is popularly known as “sibipiruna” or “false Brazil wood”, and is sometimes reported as Caesalpiniapluviosa var. peltophoroides (Benth.) G.P. Lewis.3It is a domesticated tree, which in Brazil is found mainly in the Atlantic Forest and the Pantanal. C. peltophoroides is used as an ornamental tree in cities and has a potential use for timber,4 and in Bolivia the bark is popularly used to treat dysentery.5 Previous studies using a 70% ethanol extract from the bark of C. peltophoroides showed in vitro antimalarial activity against chloroquine-resistant Plasmodium falciparum, with an IC50 of 8.3 µg/mL.6 In recent studies in vitro and in vivo against the same agent, using a 50% ethanol extract of the bark, our group found an IC50 of 3.41 µg/mL, and conirmed the presence of quercetin by mass spectrometry.7
The Folin-Ciocalteu method is widely used to determine total polyphenols. This reaction occurs by the phosphotungstic acid reduction, forming a blue chromophore constituted by a phospho-tungstic-phosphomolybdenum complex.8,9 The maximum absorption of this chromatophore depends on the pH of the solution and the concentration of phenolic compounds.8 Cicco et al.10 considered this to be a generalized technique, because some speciic details may be modiied,9,11 such as the amount of Folin-Ciocalteu rea-gents and the sequence in which they are added, sodium-carbonate concentration, wavelength, the standard used, time period, and temperature. Modiications of this method are found in several pharmacopeias12-14 and laboratory routines.10,15,16 Considering the variations in this method, the present study aimed to develop a standard procedure for the pre-analytical method and analytical validation for the determination of total polyphenols in the crude extract from Caesalpinia peltophoroides bark.
EXPERIMENTAL
Reagents and standards
The solvents used were: ethanol (Cereálcool®), Folin-Ciocalteu (Dynamics®), ethyl acetate (Synth®), methanol (Mallinckrodt®), anhydrous sodium carbonate (Nuclear®), and the standards gallic acid (98%), tannic acid (purissimum), catechin (98%), and pyrogallol (99%) (all from Sigma®).
Plant material and preparation of extracts
Samples of Caesalpinia peltophoroides bark were collected at the Universidade Estadual de Maringá, Maringá, Paraná, Brazil. A voucher specimen was deposited at the UEM herbarium under number HUEM 12492. IBAMA-SISBIO gave permission for this collection under a license granted to J. C. P. de Mello (No. 11995-2, 03/12/2008). The bark (2 kg) was dried under forced-air circulation and then milled in a Tigre ASN-5 stainless-steel hammer mill. The milled bark (1.5 kg; 10% w/v) was extracted in 50% ethanol by turbo-extraction (Ultra-Turrax, UTC115KT, 15 min; t < 40 °C). The crude extract was concentrated in a rotavapor under reduced pressure and lyophilized (CE; 150 g). CE (50 g) was dissolved in water (500 mL) and partitioned with ethyl acetate (10 x 500 mL), resulting in two semipuriied fractions: ethyl-acetate fraction (EAF) and aqueous fraction (AQF). The EAF (3 g) was fractioned employing a chromatography column (h: 15 cm ∅: 2.5 cm) containing Sephadex® LH-20 as the stationary phase. 50% ethanol (500 mL), 100% ethanol (400 mL), 50% methanol (300 mL), 100% methanol (300 mL) and 70% acetone (300 mL) as the mobile phase were used, resulting in ive fractions: F1 (2.17 g), F2 (0.21 g), F3 (0.06 g), F4 (0.17 g), and F5 (0.08 g).
Pre-analytical method standardization for determination of total polyphenols (TP)
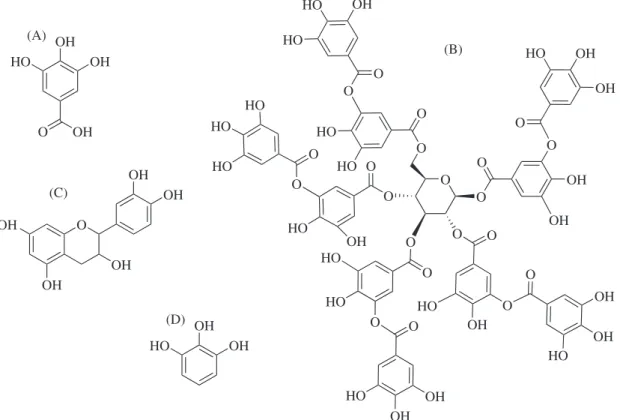
The method described by the European Pharmacopoeia12 for determi-nation of TP was used as a guideline for the dilution of the CE and standards (gallic acid, tannic acid, catechin, and pyrogallol) (Figure 1). We used a solution of 10.75% anhydrous sodium carbonate.
Stock solutions of each standard (gallic acid, tannic acid, catechin and pyrogallol, 25 µg/mL) and CE (200 µg/mL) were prepared in distilled water. Two milliliters of each solution was transferred to a 25-mL lask containing distilled water (10 mL) and Folin-Ciocalteu (1 mL). The volume was completed with 10.75% anhydrous sodium carbonate (w/v), resulting in inal concentrations of 2 µg/mL of each standard and 16 µg/mL of CE. The samples were scanned in a UV/Vis spectrophotometer (Shimadzu PC-1650) beginning 10 to 40 min after the addition of the sodium-carbonate solution, and scanning from 400 to 800 nm at intervals of 2 min between each reading, to determine the spectra.Distilled water was used as a blank. The kinetic reaction was veriied comparing the absorbance percentage increase of each solution, for the wavelengths of 691,15 715,13 760,12 and 800 nm. This percentage increase was calculated by dividing the difference in ab-sorbance between two wavelengths by the mean abab-sorbance of the shorter wavelength and multiplying by 100. The reaction times were observed and compared statistically, using the percentage increase between the times (10, 20, 30, and 40 min).
To determine the best standard to characterize the CE from C. peltophoroides, the molar absorptivity of each standard and the CE was calculated by the equation: A = ε.bc, where A = sample absor-bance (µg/mL); ε = molar absorptivity (mol/L); b = thickness of the cell (cm); c = sample concentration (g/100 mL).13,17
Analytical method validation
For validation of the analytical method, the guidelines establi-shed by the ICH (International Conference on the Harmonization of Technical Requirements for the Registration of Pharmaceuticals for Human Use) and by Brazilian regulation RE No. 899/2003 of the National Health Surveillance Agency (ANVISA) were employed.18
The standardized method, with a reaction time of 30 min, wavelength of 760 nm and pyrogallol as the standard, was used to validate the method for the determination of total polyphenols. Analyses were performed in triplicate.
Curve of the standard and CE linearity
The calibration curve of the pyrogallol standard (1.6 to 4.8 µg/ mL) and CE linearity (6.49 to 26.93 µg/mL) were determined from ive concentration points over the range of concentrations (0.32 to 32.45 µg/mL), following the Lambert-Beer law. The slope and other statistics of the calibration curves were calculated by linear regres-sion, with the software Statistica® 8.0.
Limits of detection and quantitation
The limits of detection (LOD) and quantitation (LOQ) were calculated from the relationship between the standard deviation (SD) of the CE linearity and the slope, using the appropriate multiplier. Precision
Precision was evaluated at two levels: repeatability (intra-day) and intermediate (inter-day) precision, where the SD and relative standard deviation (RSD) of six replicates (16.23 µg/mL) were considered. An RSD over 5% was considered unacceptable.
Accuracy
The accuracy was evaluated based on the recovery, following the addition of 1, 2, or 3 mg of pyrogallol in the linearity solution. To determine the recovery, the values determined from the calibration curve of the standard and the linearity of the CE were used as the expected absorbance, and transformed into the expected TP content. Specificity and selectivity
Speciicity and selectivity were determined during the pre--validation, by adding pyrogallol (3.2 mg) to the linearity solutions of the CE, and comparing with CE linearity.
O
OH OH
OH OH O
OH
HO OH
OH
OH (A)
(C)
OH
HO OH
(D)
HO
HO
OH
O O
HO
HO
O
O O HO
HO HO
O O
HO
O O
OH HO
OH
OH OH O
O O
O
OH OH
HO HO
OH O
O O
O
OH OH HO
HO
HO O
O O
O OH
(B)
Robustness
With regard to robustness, the stability of the solution under the inluence of natural light and pH (14.06 and 7.5% (w/v) anhydrous sodium carbonate solutions) was evaluated. Following the validation, the PT in the CE and semipuriied fractions (EAF, AQF, and F1-F5) was determined.
Statistical analyses
The statistical analyses were performed using Statistica® 8.0 (StatSoft Copyright, Inc.). Results were expressed as mean ± SD [RSD (%)] and were analyzed using ANOVA. Signiicant differences from the control group were determined by Dunnett’s test, with P < 0.05 as the signiicance criterion. Tests for linear correlation and residual analysis were performed by simple linear regression and the residual “r” was set as equal to or greater than 0.99.
RESULTS AND DISCUSSION
Molecular absorption spectrophotometry in ultraviolet/visible light (UV/VIS) is an analytical method based on the property of an ion or molecular species to absorb at certain wavelengths of UV/VIS radiation. In the process of absorbing the radiation, the energy of the photons is transferred to the molecules of the medium under analysis to cause electron transitions associated with vibrational and rotational transitions.19 Having in mind that the energy levels of the molecules are quantum, only those wavelengths whose photons have identical energy to an allowed transition are absorbed. Thus, the absorption can be considered as a speciic process related to the structure of the absorbing species, which determines the energy involved in the electron transition. However, to make the method more selective, normally reagents are used to convert the species of interest into a form that allows the absorption of the radiation to be measured with greater sensitivity and/or selectivity.20
The development of less onerous methods, easier to execute and normally using less complex apparatus, requires validation studies of these techniques for each plant species, in order to assure the reliability of the results.21 In general, the methodologies have not provided coherent results when used for different families, genera and even species of plants, that contain the same groups of substances in their composition. Therefore, the irst-order kinetics, wavelength, and molar absorptivity of the reference substance must be evaluated, as a prerequisite for the selectivity of the method under development.
The European Pharmacopoeia12 indicates a single general method for determination of total polyphenols in all herbal drugs. The Brazilian Pharmacopeia12 method provides a monograph for each plant, describing different techniques for quantifying total polyphenols. These variations consist of the reading time (2 to 30 min), wavelength (691 to 760 nm), amount of Folin-Ciocalteu, the standards used, and sodium carbonate concentration. The use of an individually developed method for each herbal drug serves to reduce the inluence of the presence of other phenolic compounds on the inal content and increase the speciicity of the method, and is therefore more accurate than the more general methods recommended in other pharmacopeias.12,14 However, not all herbal drugs are described in the Brazilian Pharmacopeia.13 It is necessary to standardize and validate the analysis method for each herbal drug.
In the pre-analysis standardization technique for determination of total polyphenols, all the standards (2 µg/mL) and CE (16 µg/mL) were used. It was necessary to establish the differences among the standards because the CE contains several substances that may affect the concentration of total polyphenols. If the standard were used in the same concentration as the CE, it would show an absorbance above
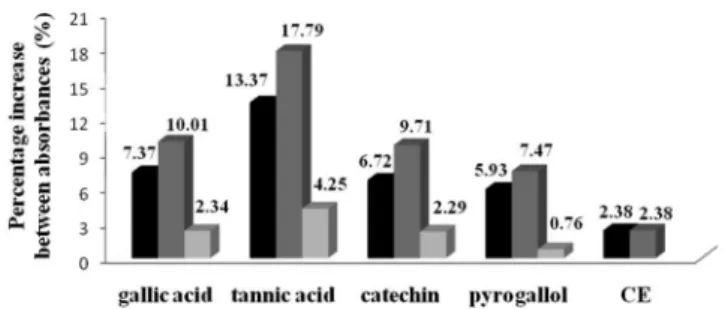
the linear range. Figure 2 shows the reaction kinetics of the standards and CE, determined by scanning the samples at different wavelengths (691, 715, 760, and 800 nm). The increase in percentage absorbance between the wavelengths of 691-715 and 715-760 was signiicant for the standards and CE, as follows: gallic acid F60,3 = 1081.9; tannic acid F60,3 = 1213.8, catechin F60,3 = 1033.2; pyrogallol F60,3 = 3442.9, and CE F60,3 = 5984.4, P < 0.05. Between the wavelengths of 760-800 for the standard, the increase was signiicant, but less than 5% compared to the value obtained at 760 nm. For the CE there was a decrease between 760-800 nm. Comparing the reaction time for phosphotungstic acid reduction (10 to 40 min), there was no signiicant difference between the values (P > 0.05). The reaction kinetics with respect to the increase in percentage and wavelengths were similar for pyrogallol and CE. According to Glasl15 each substance has a characteristic variation in the absorption at different wavelengths, and similar reaction kinetics should occur in substances with similar structures.
The Folin-Ciocalteu method shows a response proportional to the number of phenolic groups, forming a blue complex that is pro-portional to the number of hydroxyl groups on the aromatic ring.22,23 The structure and activity of phenolic compounds are related to the number of hydroxyl groups on the aromatic ring.22 The standard molecules analyzed have different structures, and pyrogallol has the most hydroxyl groups attached to the aromatic ring, proportional to its mass. This can be observed by the molar absorptivity, as shown by the Lambert-Beer Law, which relates the absorbance and molar concentration of the analyte.17 A high absorptivity demonstrates the capacity of the chromophore to absorb light in certain conditions, and the higher this value, the more precise will be the determination of absorbance.13 With more hydroxyl groups linked to the aromatic ring, pyrogallol has similar reaction kinetics to CE, and is therefore considered the best standard for the determination of TP for this herbal drug. Table 1 shows the variations that can occur in estimates of the total polyphenol content based on standards with different molar absorptivities and reaction kinetics, demonstrating that the use of an inappropriate standard can lead to error.
Pre-analytical standardization of the method for the CE of C. pel-tophoroides indicated that the best wavelength to use is 760 nm. For
Figure 2.Percentage increase in the mean absorbances of the raw extract
and the standards, of the longer compared to the next shorter wavelength (691, 715, 760, and 800 nm)
Table 1. Comparison among the molar absorptivity of the standards and total
polyphenol content of the crude extract of C. peltophoroides Samples Molar absorptivity TP (%)
Gallic acid 975.0 41.74
Tannic acid 802.6 57.63
Catechin 1191.0 40.98
different reaction times (10-40 min) with Folin-Ciocalteu, no signiicant difference among the absorbances of the CE and the standards was observed. Therefore, to carry out the validation, the method described in the European Pharmacopoeia12 was followed, using an analysis time of 30 min, absorbance of 760 nm, and pyrogallol as the standard.
The analysis curves obtained for pyrogallol (y = 0.1277x + 0.0421, r = 0.999) and CE linearity (y = 0.03x + 0.0089, r = 0.999) showed that the method is linear over the concentrations examined and for the response obtained by the apparatus. This is observed from the linear correlation coeficient “r” which has a value greater than 0.99, as allowed by RE No. 899.18 The value of F found for the model was greater than the critical F value, and the reverse for the lack of it of adjustment. From the linear equation obtained, the detection and quantiication limits were estimated as concentrations of 0.23 and 0.75 µg/mL, respectively.
With respect to precision, the variation coeficients of repea-tability (0.36%) and intermediate precision (0.05%) show that the results were within the limits allowed by law, with a residual standard deviation of up to 5%.18 There was no statistical difference in the intra--day and interintra--day tests, with P > 0.05 (0.87 and 0.42, respectively). Accuracy is considered the most important aspect of the analysis, indicating the effect of variations in a laboratory due to factors such as different days, analysts, or apparatus, thereby ensuring that the method is reproducible.18,24
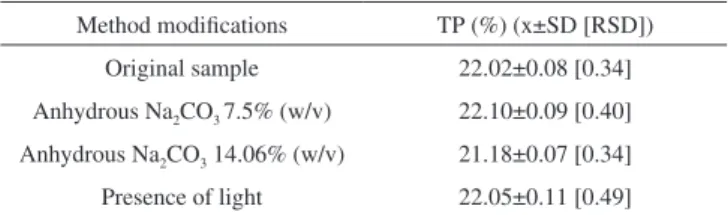
With respect to robustness (Table 2), the values found for the different variations in the method were similar. However, the sam-ples prepared with a 14.06% solution of anhydrous Na2CO3 were statistically different (P < 0.05) from those prepared with 10.75% anhydrous Na2CO3. The remaining samples, in the presence of light and with a 7.5% anhydrous Na2CO3 solution, showed no statistical differences (P > 0.05) from 10.75% anhydrous Na2CO3. An increased quantity of sodium carbonate may mean a decreased percentage of total polyphenols. The use of sodium carbonate decahydrate was recommended by the European Pharmacopoeia12 whereas anhydrous sodium carbonate was used in this study. Accuracy is considered as the degree of agreement, i.e., the nearness to a true result, the calibration curve, and the indings of the trial. One method is to evaluate the ac-curacy by adding a standard at three different levels of concentration. The standard addition method is often used in cases where no blank matrix is prepared, for example, in the case of extracts, where the matrices are complex and unknown.21
In the case of complex matrices, if the matrix without the analyte is not available, the effects of the matrix system can be tested by comparing the slopes of linearity and speciicity.18,24,25 If the curves are parallel, we can afirm that the method is selective.24 The selectivity of the method for CE (y = 0.029 + 0.137, r = 0.999) was conirmed by superimposing the analytical curves (Figure 3). The sample reco-very was used to determine the accuracy, and we obtained a variation from 98.08 to 103.21%, showing that the method is accurate for the complex matrix.
Following the demonstration of the method’s validity, we determi-ned the percentage of TP for the extracts and fractions, as follows: CE (22.74 ± 0.01 [1.23]), EAF (27.98 ± 0.52 [1.98]), AQF (26.16 ± 0.50 [1.81]), F1 (42.84 ± 0.01 [1.23]), F2 (22.83 ± 0.01 [1.23]), F3 (33.78 ± 0.52 [1.53]), F4 (48.67 ± 0.67 [1.38]), and F5 (31.21 ± 0.31 [0.99]).
CONCLUSIONS
In this study, the estimated concentration of total polyphenols changed when changes were made in the reaction time, wavelength, and the standard, demonstrating that it is necessary to standardize the method for each herbal drug. To quantify total polyphenols in the extract from C. peltophoroides, the method described by the European Pharmacopoeia12 proved to be eficient, meeting the requirements for a valid technique. The reference substance that provided the best reliability of the analytical method for this herbal drug was pyrogallol.
ACKNOWLEDGMENTS
We thank CAPES, CNPq Fundação Araucária, INCT_if, and FINEP for inancial support. The technical assistance provided by A. Arantes and C. R. Novello is gratefully acknowledged. Our gra-titude to Dr. J. W. Reid for revising the English text. The valuable observations of anonymous reviewers contributed signiicantly to improvements in the manuscript.
REFERENCES
1. Gao, T.; Yao, H.; Song, J.; Liu, C.; Zhu, Y.; Ma, X.; Pang, X.; Xu, H.; Chen, S.; J. Ethnopharmacol.2010, 130, 116.
2. http://loradobrasil.jbrj.gov.br/2010, accessed March 2011.
3. http://loradobrasil.jbrj.gov.br/2010/FB018164, accessed January 2011. 4. Corte, V. B.; Borges, E. E. L.; Ventrella, M. C.; Leite, I. T. A.; Braga, J.
T.; Rev. Árvore 2008, 32, 641.
5. Deharo, E.; Bourdy, G.; Quenevo, C.; Muñoz, V.; Ruiz, G.; Suvain, M.; J. Ethnopharmacol. 2001,77, 91.
6. Baelmans, R.; Deharo, E.; Bourdy, G.; Muñozv, V.; Quenevo, C.; Sauvain, M.; Ginsburg, H.; J. Ethnopharmacol. 2000, 73; 271. 7. Kayano, A. C. A. V.; Lopes, S. C. P.; Bueno, F. G.; Cabral, E. C.;
Souza-Neiras, W. C.; Yamauchi, L. M.; Foglio, M. A.; Eberlin, M. N.; Mello, J. C. P.; Costa, F. T. M.; Malar. J. 2011, 10, 112.
8. Schoield, P.; Mbugua, D. M.; Pell, A. N.; Anim. Feed Sci. Technol.
2001, 91, 21.
9. Gülçin, I.; Sat, I. G.; Beydemir, S.; Elmastas, M.; Küfrevio lu, Ö. I.; Food Chem. 2004, 87, 393.
10. Cicco, N.; Lanorte, M. T.; Paraggio, M.; Viggiano, M.; Lattanzio, V.; Microchem. J. 2009, 91, 107.
Table 2. Levels of total polyphenols (TP) in samples obtained with two
mo-diications of the method: presence or absence of light, and concentrations of 7.5 and 14.06% anhydrous Na2CO3
Method modiications TP (%) (x±SD [RSD]) Original sample 22.02±0.08 [0.34] Anhydrous Na2CO3 7.5% (w/v) 22.10±0.09 [0.40] Anhydrous Na2CO3 14.06% (w/v) 21.18±0.07 [0.34] Presence of light 22.05±0.11 [0.49] x = mean; SD = standard deviation; RSD(%) = relative standard deviation
Figure 3. Comparison between specificity and linearity curve of the crude
11. Andrade, C. A.; Costa, C. K.; Bora, K.; Miguel, M. D.; Miguel, O. G.; Kerber, V. A.; Rev. Bras. Farmacogn.2007, 17, 231.
12. European Pharmacopoeia, 6th ed., Council of Europe: Strasbourg, 2008. 13. http://www.anvisa.gov.br/hotsite/cd_farmacopeia/index.htm, accessed
March 2011.
14. Farmacopeia Portuguesa, 8th ed., Infarmed: Lisboa, 2005; British Phar-macopeia 2009, London: The Stationery Ofice, 2008.
15. Glasl, H.; Dtsch. Apoth. Ztg.1983, 123, 1979.
16. Turkman, N.; Sari, F.; Velioglu, Y. S.; Food Chem. 2006, 99, 835; Tawaha, K.; Food Chem. 2007, 104, 1372.
17. Pelillo, M.; Cuvelier, M. E.; Biguzzi, B.; Toschi, T. G.; Berset, C.; Lercker, G.; J. Chromatogr., A 2004, 1023, 225.
18. ICH; International Conference on Harmonization of Technical Requeriments for Registration of Pharmaceuticals for Human Use, Q2B(R1): Guideline on Validation of Analytical Procedure- Methodology, 2005; Agência Nacional de Vigilância Sanitária - ANVISA; RE No. 899, on 29/5/2003: Guia para Validação de Métodos Analíticos e Bioanalíticos, Ministério da Saúde: Brasília, 2003.
19. Leal, A. A. X.; Henriques, C. A.; Luna, A. S.; Rev. Analytica2008, 32, 28.
20. Rocha, F. R. P.; Teixeira, L. S. G.; Quim. Nova2004, 27, 807. 21. Pelozo, M. I. G.; Cardoso, M. L. C.; Mello, J. C. P.; Braz. Arch. Biol.
Technol. 2008, 51, 447; Silva-Corazza, P. E. R.; Lopes, G. C.; DiCiaula, M. C.; Lima, M. M. S.; Palazzo de Mello, J. C.; Lat. Am. J. Pharm.
2010, 29, 830.
22. Singleton, V. L.; Orthofer, R.; Lamuela-Raventos, R. M.; Methods in Enzymol. 1999, 299, 152.
23. Chun, O. K.; Kim, D.; Food Res. Int.2004, 37, 337.
24. Ribani, M.; Bottoli, C. B. G.; Collins, C. H.; Jardim, I. C. S. F.; Melo, L. F. C.; Quim. Nova 2004, 27, 771.