Giancarlo BacchieriI,II
Aluísio J D BarrosII
I Instituto Federal Sul-rio-grandense. Pelotas, RS, Brasil
II Programa de Pós-graduação em Epidemiologia. Universidade Federal de Pelotas. Pelotas, RS, Brasil
Correspondence:
Giancarlo Bacchieri
Instituto Federal Sul-rio-grandense Praça 20 de setembro, 455 – Centro 96015-360 Pelotas, RS, Brasil E-mail: [email protected] Received: 1/8/2011 Approved: 8/4/2011
Article available from: www.scielo.br/rsp
Traffi c accidents in Brazil from
1998 to 2010: many changes
and few effects
ABSTRACT
The paper describes the situation of road traffi c accidents in Brazil since 1998, when a new Brazilian traffi c law was approved, up to the year 2010. A review of both academic and non-academic literature was carried out, including journals (both indexed and non-indexed), technical reports, author searches, searches in paper reference lists and direct contact with researchers. The main problems related to road traffi c accidents in Brazil identifi ed were the increase in the absolute number of deaths and in the mortality rates, a rapid increase in the number of motorcycles, and drink & driving. Infl uent authors in the fi eld and centers of expertise were identifi ed. Some potential solutions are presented by the authors, who suggest that the public offi ces related to traffi c regulation and control are not taking suitable measures for control and reduction of road traffi c accidents.
DESCRIPTORS: Accidents, Traffi c, trends. External Causes. Accident Prevention. Review. Mortality. Pedestrian. Motorcyclists. Motor Vehicles.
INTRODUCTION
Around 1.2 million people die worldwide from road traffi c accidents (RTA) every year and more than 90% of these deaths occur in low- and middle-income countries.a In addition to people’s suffering from deaths and physical disabilities, RTA also pose a heavy economic burden on health systems. The World Health Organization (WHO) estimates that annual losses due to RTA exceed $500 billion.b In Brazil, the annual number of killed and severely injured people exceeds 150,000c and the Brazilian Institute of Applied Economic Research (IPEA) has estimated that total RTA costs amount to R$ 28 billion per year.d,e
Brazil ranks high among countries with the world’s most dangerous roads and it has sought to reduce the high number of accidents in recent years. After the implementation of the new Brazilian Vehicle Code (BVC)f in 1998 RTA mortality rate has remained stable (around 20 deaths per 100,000 inhabitants),
a World Health Organization - WHO. Global Status Report on Road Safety – Time for action. Geneva; 2009.
b World Health Organization - WHO. The Global Burden of Disease: 2004 update. Geneva: 2008.
c Ministério da Saúde. Departamento de Informática do SUS – DATASUS Informações em saúde. Brasília (DF); 2008 [cited 2010 Feb 21]. Available from: http://www2.datasus.gov.br/DATASUS/ index.php?area=02
d Instituto de Pesquisa Econômica Aplicada; Associação Nacional dos Transportes Públicos. Impacto social e econômico dos acidentes de trânsito nas aglomerações urbanas brasileiras: relatório executivo. Brasília (DF): IPEA; São Paulo: ANTP; 2003.
e Instituto de Pesquisa Econômica Aplicada; Departamento Nacional de Trânsito. Impactos sociais e econômicos dos acidentes de trânsito nas rodovias brasileiras: relatório executivo. Brasília (DF): IPEA; DENATRAN; 2006.
which is higher than the rates reported in Japan, Sweden and Canada (fi ve to eight deaths per 100,000).a New laws, local traffi c control, improved vehicle safety and increased electronic traffi c monitoring has all failed to signifi cantly reduce deaths and disabilities.
This article aimed to present a panorama of road traffi c since the implementation of the new BVC.
METHODS
In light of the small number of scientifi c publica-tions on RTA and low interaction between areas such of knowledge such as epidemiology, engineering, psychology, medicine and others, a descriptive review was conducted with extensive literature search. This review study included scientifi c articles and publica-tions in Portuguese, English and Spanish published between 1998 and 2010 with data collected in Brazil and that evaluated RTA as a primary or secondary outcome. There was conducted a search of indexed journals in electronic databases, non-indexed jour-nals, technical reports, search by specifi c authors, reference lists of articles and communications with researchers. The electronic search was conducted in MEDLINE (National Library of Medicine), LILACS (Latin American and Caribbean Health Sciences), SciELO (Scientifi c Electronic Library Online) and Google Scholar databases. It included the following descriptors: “traffic accidents”, “road accidents”, “epidemiology” and “external causes”. The descriptor “Brazil” was added to restrict the search to publications in Brazil. There was no restriction on demographic and socioeconomic factors and types of studies. The search for articles was carried out between February and October 2010. Publications were pre-selected based on their titles and abstracts. The full text of the publica-tions selected was obtained and examined. Brazilian websites such as the National Traffic Department (Denatran), National Department of Transport and Infrastructure (DNIT), Brazilian Federal Highway Authority (DPRF) and Brazilian Ministry of Health Mortality Database (Datasus) were searched. Manual search for non-indexed journals was also carried out at the Universidade Federal de Pelotas (UFPEL) and Universidade Católica de Pelotas (UCPEL) libraries.
The data here presented follow the WHO 10th Revision of the International Classifi cation of Diseases and Related Health Problems (ICD-10).g Data on mortality and morbidity (hospital admission) between 1998 and
2005 was obtained from the “Traffi c Accidents in Brazil – An Atlas of their Distribution,” a publication of the Brazilian Traffi c Medicine Association (ABRAMET).h Data on mortality and morbidity between 2006 and 2008 was obtained from Datasus database.i The 2008 mortality data are preliminary and morbidity data include the year of 2009. The DENATRANj provided information on the motor vehicle fl eet.
DATA AND TRENDS FROM 1998 TO 2008
Law No. 9503 established in 1998 —the fi rst year of this review study—the new BVC.f The new BVC was regarded as a promising action to reduce the growing number of RTA and address this issue. It included strin-gent laws, higher fi nes and chapters on traffi c educa-tion in traffi c. However, RTA mortality and hospital admission rates remained the same or even increased.
By the end of 1998, a total of 30,890 people died from RTA. It increased by 19% in 2008 (36,666 deaths) while the Brazilian population increased 17%. From 1998 to 2000 there was a decrease in the fatality rate (28,995 deaths) but it increased steadily in the following years, amounting to 37,407 deaths in 2007. The number of hospital admissions resulting from RTA increased by 9%, from 108,988 in 1998 to 123,168 in 2009. It increased until 2000 (119,585), then fell from 2000 to 2003 (109.696), increased from 2003 to 2006 (120,997) and then fell again in 2007. A peak and a dip were seen during 2008 and 2009: a decline in 2008 (~95,000 hospital admissions), followed by an increase by more than 30% (123,168) in 2009. This variation may be explained by the impact of the National Prohibition Act (Law No. 11.705/08) or errors in the database.
Figure 1 shows mortality rates from RTA with denomi-nators commonly used in the Brazilian scientifi c litera-ture (deaths per 100,000 inhabitants and per 10,000 vehicles).
The mortality rate from RTA declined during the fi rst two years of follow-up (from 19.1 deaths per 100,000 in 1998 to 17.1 in 2000). There was a steady increase between 2001 and 2004, reaching 19.6 deaths per 100,000, which remained stable and close to 20 deaths per 100,000 in subsequent years. The RTA mortality rate per vehicles remained stable (around 10 deaths per 100,000 vehicles) until 2002. From 2003 to 2008 there was a slow decrease, 6.7 deaths per 100,000. This decrease may be explained by an 85% increase of the
g Organização Mundial da Saúde. Classifi cação estatística internacional doenças e problemas relacionados à saúde: CID 10 [cited 2010 Oct 28]. Available from: http://cid10.datasus.gov.br/
h Mello Jorge MHP, Koizumi MS. Acidentes de trânsito no Brasil. Um atlas de sua distribuição. São Paulo: Associação Brasileira de Medicina de Tráfego; 2007. [cited 2010 Mar 10). Available from: http://www.abramet.org.br/Site/Pagina.aspx?ID=399&MenuID=73&lang=pt_BR i Ministério da Saúde, Departamento de Informática do SUS – DATASUS. Informações em saúde. Brasília (DF); 2008 [cited 2010 Feb 21]. Available from: http://www2.datasus.gov.br/DATASUS/index.php?area=02
Brazilian vehicle fl eet, from 29.5 million vehicles to over 54 million.
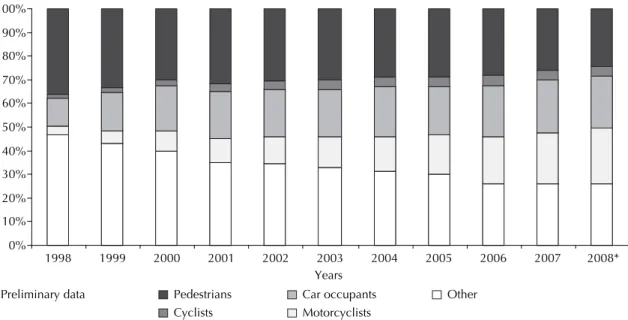
Figure 2 shows RTA according to categories of victims. “Other” included occupants of three-wheeled motor vehicle, heavy vehicles (trucks), and buses, other road
accidents and unspecifi ed road accidents. The category “Car occupants” included occupants of vans.
In “Other” category there were approximately 14,500 deaths in the beginning of the study period, accounting for 45% of all deaths. After a steady decline, there were seen 9,603 deaths in 2008, just over 26%. This decrease may be resulting from improved data quality as it also included unspecifi ed road accidents.
There was a 12% reduction in relative pedestrian deaths (36% in 1998 to 24% in 2008). However, the number of deaths remained quite constant (from 9,000 to 10,000 deaths/year).
Deaths of car occupants accounted for 22% of total deaths in 2008 compared to 12% in 1998. The number of fatalities increased by 121% (from 3,736 to 8,093 deaths), being higher in 2007 (8,273 deaths).
Fatalities among motorcycle drivers and passengers increased over 700% during 1998–2008 (from 1,028 to 8,529 deaths). Motorcyclist deaths rose from 3% to 23% of all deaths and cyclist fatalities increased from 1% (396 deaths) to 4% (1,556 deaths), being higher in 2006 (1,668 deaths).
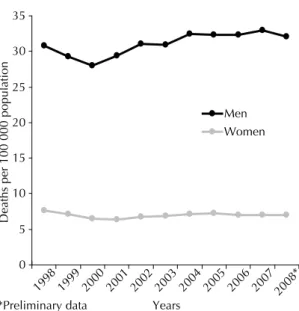
Similar to other countries, Brazilian males died more from RTA than females (approximately 4.5 male: female). There was a reduction of RTA mortality rate among males from 1998 to 2000, reaching the lowest rate of the study period (28 deaths per 100,000 males) (Figure 3). After a steady rise, it reached 33 deaths per 100,000 in 2007. Among females, after a decline Figure 1. Mortality rate from traffi c accidents per 100,000
population and 10,000 vehicles. Brazil, 1998-2008. Sources: Acidentes de trânsito no Brasil – Um Atlas de sua distribuição – ABRAMET (Data until 2005).
Brazilian Ministry of Health/Secretaria de Vigilância em Saú-de/Departamento de Análise de Situação de Saúde – Sistema de Informações sobre Mortalidade - SIM (Data from 2006).
0 5 10 15 20 25
1998 1999 2000 2001 2002 2003 2004 2005 2006 2007 2008*
Years
Deaths
*Preliminary data
Per 100 000 population Per 10 000 vehicles
Figure 2. Proportion of deaths from traffi c accidents according to the categories of victims. Brazil, 1998-2008. Sources: Acidentes de trânsito no Brasil – Um Atlas de sua distribuição – ABRAMET (Data until 2005).
Brazilian Ministry of Health/Secretaria de Vigilância em Saúde/Departamento de Análise de Situação de Saúde – Sistema de Informações sobre Mortalidade - SIM (Data from 2006).
0% 10% 20% 30% 40% 50% 60% 70% 80% 90% 100%
1998 1999 2000 2001 2002 2003 2004 2005 2006 2007 2008*
Years Pedestrians
Cyclists
Car occupants Motorcyclists
between 1998 and 2000, it remained stable at seven deaths per 100,000.
MOTORCYCLES
Motorcycles have taken up urban spaces as an effi -cient means of transportation and work to avoid traffi c congestion in large cities. Defi cient public transport, the growing delivery service industry, the possibility of generating income for unskilled young people and ease of purchasing a motorcycle have all lead to a 5-fold increase in motorcycle fl eet compared to car fl eet. There are more than 14 million circulating motor-cycles, accounting for 25% of the national fl eet.j The motorcycle has become the most popular single means of transportation in Brazil.36 But careless riding and increased vulnerability of the driver and passenger have led to an increase in the number of accidents involving motorcyclists, especially young males, 2,9,42,61 and their main victims, pedestrians.9,61,k Motorcycle drivers are a priority group in prevention programs9,11,59 because they are seven times more at risk of dying, four times more likely of being injured and two times more likely to hit a pedestrian compared to car drivers.9 Pedestrians were historically the main victims of road accidents but now they involve mainly motorcyclists.2,9,11,59 In four large urban centers (Belém in the northern state of Pará, Recife in the northeastern state of Pernambuco, São Paulo in the southeastern state of São Paulo and Porto
Alegre in the southern state of Rio Grande do Sul), 7% of all car accidents involved victims while this propor-tion ranged from 61% to 82% in motorcycle accidents.d The cost of RTA involving motorcyclists was estimated at R$ 5.3 billions between 1998 and 2006, R$ 1,400.00 per circulating motorcycle.k
Motorcycle courier and motorcycle taxi driver have become regulated professions under Law No. 12,009 of 29 July 2009 requiring a minimum age of 21 years, a two-year driver’s license in this category and specialized training. Most drivers are young adult males.32,64 The motorcycle as a means of work is regarded as a poten-tial factor for increased motorcycle casualties,2,9,11,59 and motorcycle couriers are at high risk of RTA due to their job demands.19,36,64,73 In São Paulok and Porto Alegre74 37% of deaths and 28% of emergency hospital admissions of motorcyclists were among motorcycle couriers. Pressure from customers and employers for fast deliveries,19,73 pay on the basis of productivity and daily work shifts exceeding 10 hours19,64 have been identifi ed as determinants of inappropriate driving. Increased productivity is a justifi cation for their disrespect for traffi c laws.19,32,65,73 Typical behaviors of young males including boldness, immaturity, a sense of invulner-ability, a tendency to overestimate their abilities and driving inexperience allied to the need to become part of a group make them push the limits and transgress them,1 which makes it more complex the issue of RTA. The executive veto of BVC Article 56 that prohibited driving between the lanes of traffi c on the grounds of offering “greater fl exibility of movement” further jeopardizes the safety of road users.
The expanding market of delivery services and motorcycle taxis indicates that these workers’ job is demanded in our society. A qualitative study conducted in Porto Alegre showed the social dichotomy involving motorcycle couriers: while they are discriminated as drivers, their services are needed for fast deliveries.73 This pressure —recognizably a causing factor for traffi c accidents— is key to secure their jobs and is encouraged by employers and clients.65
Diniz et al19 have suggested the work reality of these workers outgrows the thrill of riding a motorcycle. They often have to cope with poor work conditions, lack of formal contracts, long working hours, stress, psycho-logical pressure for greater productivity, low income and high risk of accidents. Motorcycle couriers live with the dialectic of risk-need as described by Veronese & Oliveira:73 “To work at risk of an RTA or not to work, that’s the question. All that motorcycle couriers can do is to manage the risk.”
The phenomenon of motorcycle couriers is a major issue for traffi c authorities in Brazil.14 Some actions
k Vasconcellos EA. O custo social da motocicleta no Brasil. Rev Transp Publicos 2008;Ano30/31;3°/4°trimestres:127-42. Figure 3. Proportion of deaths from traffi c accidents per
100,000 population stratifi ed by sex. Brazil, 1998-2008. Sources: Acidentes de trânsito no Brasil – Um Atlas de sua distribuição – ABRAMET (Data until 2005).
Brazilian Ministry of Health/Secretaria de Vigilância em Saú-de/Departamento de Análise de Situação de Saúde – Sistema de Informações sobre Mortalidade - SIM (Data from 2006).
0 5 10 15 20 25 30 35
1998 1999 2000 2001 2002 2003 2004 2005 2006 2007 2008*
*Preliminary data Years
Deaths per 100 000 population
have been pointed as critical for reducing RTA. Employers and clients have to take part of this respon-sibility, reducing their demands for deliveries that involve unsafe behaviors and extenuating working hours.32,73 Companies must be required to hire profes-sional motorcycle couriers who have been trained on defensive driving and use of safety equipment, in addi-tion to greater motorcycle inspecaddi-tion and use of speed control devices.32,73 However, a new debate on BVC Article 5614 and targeted actions to promote motorcycle courier behavior change73 are unlikely to be effective. Vasconcellos said the motorcycle-related deaths have cancelled out the gains achieved with BVC in reducing RTA by other vehicles.k
The motorcycle has defi nitely a social role, either at work, for commuting or during leisure time, and occu-pies 82% less public space than cars.63 Its new status is part of an irreversible change of the motor vehicle fl eet composition.36 The challenge is to ensure safety of road users.
DRINKING AND DRIVING
The association of alcohol and RTA has been well docu-mented in the literature. It is a major cause of morbidity and mortality affecting mostly young males.l The First Household Survey on Patterns of Alcohol Consumption conducted in 143 Brazilian cities in 2009 showed a 35% prevalence of drinking and driving (43% among men and 9% among women).54 Studies carried out in São Paulo, the Federal District, and Porto Alegre between 2005 and 2009 on the association between alcohol use and related deaths found blood alcohol contents (BAC) in 45%, 43% and 32% of cases, respectively.30,49,m Among non-fatal injuries treated at trauma care centers and emergency rooms in São Paulo and Uberlândia (southeastern state of Minas Gerais), the prevalence of alcohol use was 24% and 29%, respectively,24,27 Alcohol use was suspected in nearly 17% of RTA cases seen at emergency services in the cities covered by the Sentinel Surveillance System on Violence and Injuries.37
Under the 1998 BVC driving under the infl uence of alcohol (BAC ≥0.6 grams of alcohol per liter of blood) is a criminal offense. Law No. 11,705 that went into effect on June 20, 2008 changed blood alcohol limit for drivers to zero (with a tolerance of up to 0.2 g/L) punish-able with more strict penalties up to imprisonment in fl agrante delicto if BAC >0.6 g/L. Few studies have assessed the effectiveness of the Prohibition Act or Zero
Tolerance law. Mello Jorge & Koizumi47 found 28% reduction in hospital admissions between the two halves of 2008, as well as signifi cantly reduced hospital stay (42%), hospital costs (39.2%) and mortality (13.6%). In the city of São Paulo, there was a 48% to 36% reduction in BAC in fatal injuries when compared data from the second half of 2007 and 2008.28 Despite not having been based on a time series that could support or refute the fi ndings, the results suggest that the new law was effective.
Moura et al50 monitored through phone calls the frequency adults drove after using alcohol in 27 Brazilian cities. They found a decrease in the months immediately following the enactment of the law but further increase was seen in the following months. These studies, together with morbidity data from the Brazilian National Health System Database (SIH-SUS), suggest that the Zero Tolerance law of 2008 was effective in reducing alcohol-related RTA for a limited period.
The city of Porto Alegre passed a law against alcohol consumption at gas stations in 2006. De Boni et al17 showed no difference in BAC among groups of young patrons pre- and post-law enforcement. Studies using breathalyzers to estimate BAC at sobriety checkpoints on weekends showed very high prevalences in other two cities. In the city of Belo Horizonte BAC was detected in 38% of drivers and was above the legal limit in 20%.13 In the city of Diadema, state of São Paulo, the proportions were 24% and 19%, respectively, which are up to six times higher than those reported in international studies.21 A study conducted post-law enforcement with individuals potentially at risk for alcohol-related RTA found 51% with BAC and they intended to drive.n Studies13,17,21,n pointed defi cient over-sight as a factor for failed law enforcement, in addition to high prevalence of BAC. Pinsky et al56 showed that 85% of young people applying for a driver’s license did not know anyone who has been legally punished for drinking and driving, 74% believed that no offender would receive the statutory penalty and 64% said it was very unlikely they would be stopped by police or subject to penalties. A study conducted post-enforcement of the Zero Tolerance law found that, while 86% of respon-dents said they had drunk and driven in the last year, 9% were stopped and asked to perform a breathalyzer test.n Twenty percent of professional drivers working in Brazilian federal highways said they had been asked to take the breathalyzer test while 9% and 8% of car and motorcycle drivers were asked to do so, respectively.
l Pinsky I, Laranjeira R. O fenômeno de dirigir alcoolizado no Brasil e no mundo. Rev ABP-APAL. 1998;20(4):160-5.
m Stampe MZ, Silva HH, Schroeter D, De Boni R, Pechansky F, Camargo J et al. Acidentes de trânsito com vítimas fatais necropsiadas no Departamento Médico Legal de Porto Alegre. In: Pechanski F, Duarte PCAV, De Boni RV, organizadores. Uso de bebidas alcoólicas e outras drogas nas rodovias brasileiras e outros estudos. Porto Alegre: Secretaria Nacional de Políticas sobre Drogas; 2010. p. 78-83.
BAC was detected in 1% of bus drivers to up to 5% of truck drivers.o
Souza et alp reported that 47% of RTA cost is related to excess alcohol use in Porto Alegre. Mello Jorge & Koizumi47 showed 28% reduction in hospital admis-sions and 36% cost reduction with a public saving of more than R$ 23 million after the enforcement of Zero Tolerance law. They stressed this law has saved lives since it came into force.
The negligence of state authorities with inadequate over-sight can kill thousands of people each year.13,17,21,o The Zero Tolerance law would not be required if there were effective oversight and enforcement of the previous law. Countries with low RTA mortality rates (<8 deaths per 100,000) enforce BAC limits close to that provided in the 1998 BVC such as 0.3 g/L in Japan,0.5 g/L in France, 0.5 g/L in Germany, 0.5 g/L in the Netherlands, 0.8 g/L in England, and 0.8 g/L in Canada.a They all have strict enforcement of alcohol laws.
The Global Road Safety Partnership (GRSP)q recom-mends actions to reduce alcohol-related accidents such as political commitment to reduce drinking and driving, clear laws for alcohol limits and penalties for offenders, mass campaigns and dissemination of law enforcement, education to change behavior and strict penalties for offenders.
WHO recommends the implementation of sobriety checkpoints with breathalyzer tests, which is a cost-effective action than can reduce accidents by 20%.a They should be operated primarily on weekend nights when most alcohol-related RTA occur.24,28,49
According to the Brazilian Consensus on Public Policies on Alcohol29 (2004), evidence-based measures are an approach with great potential for success in preventing alcohol-related RTA and should include low BAC tolerance, evident and frequent oversight, suspen-sion of offenders’ driver’s license and increasing the certainty of punishment through spot checks (oversight of checkpoints).
It is critical to improve control and oversight of alcohol sale and advertising. Beer must be categorized as an “alcoholic beverage” and subject to restrictions on advertising and broadcasting times since the greatest investment are made in alcohol products.34,57
The First Household Survey on Patterns of Alcohol Consumption in the Brazilian population showed that
people support public policies that address the drinking and driving problem including increasing taxes on alcohol, restrictions on alcohol advertising and alcohol industry sponsorship of cultural and sports events and stricter penalties.r Nascimento & Garcia51 have examined many public policies, emphasizing the need to defi nitely set the alcohol issue high in the Brazilian political agenda. Yet the power of the parties of interest including alcohol industry, retailers and consumers should not be underestimated. These policies must be implemented as the people’s wish should prevail.
PEDESTRIANS AND CYCLISTS
Pedestrians account for almost one-third of deaths from RTA in Brazil (approximately 10,000 deaths per year) and an increasing number of deaths are seen among cyclists (over 1,500 in 2005).h Pedestrians are the third largest group of victims, following motorcyclists and car occupants in southern Brazil, but they are the leading group in casualties (38% of deaths and 11% mortality rate).9 There is high underreporting of RTA in pedestrians and cyclists, 53% and 33%, respectively, with a corrected mortality rate of 5%, the highest for both groups. Among injured pedestrians 70% were children or elderly.9
In the city of Maringá, southern state of Paraná,68 pedestrians and cyclists had a 119% and 65% higher risk of RTA hospital admission, respectively, compared to car occupants. In 1998, 47% of the deaths occurred in pedestrians and cyclists62 and almost 90% of deaths in elderly (65 years or more) were caused by run overs. Andrade & Mello Jorge2 found that even if pedestrians are 12% of total RTA in Londrina, southern state of Paraná, they account for almost one-third of the deaths and have the highest rates of hospital admission (18%) and mortality (5%). Soares & Soares study67 showed that children and elderly are the main groups of injured pedestrians, with high rates of RTA incidence and mortality among the elderly (256 and 44 per 100,000, respectively). Pedestrians accounted for 42% while cyclists accounted for 15% of RTA deaths in the city of Fortaleza, northeastern state of Ceará, in 2001–2002, These two groups accounted for 38% of all injuries.16
The elderly are the main injured group among pedes-trians. Gawryszewski et al26 pointed RTA as a leading cause of death from external causes in this group, half of them occurring by run overs. In the city of
o Pechansky F, De Boni R, Duarte P, de Paula FC, Benzano D, von Diemen L et al. Consumo de álcool e drogas entre motoristas privados e profi ssionais do Brasil. In: Pechanski F, Duarte PCAV, De Boni RV, organizadores Uso de bebidas alcoólicas e outras drogas nas rodovias brasileiras e outros estudos. Porto Alegre: Secretaria Nacional de Políticas sobre Drogas; 2010. p. 54-63.
p Souza TRV, Correa E, Stampe MZ, Porto Junior SS, De Boni R. Custos dos acidentes com vítimas associados ao uso de álcool em Porto Alegre. In: Pechanski F, Duarte PCAV, De Boni RV, organizadores Uso de bebidas alcoólicas e outras drogas nas rodovias brasileiras e outros estudos. Porto Alegre: Secretaria Nacional de Políticas sobre Drogas; 2010. p. 100-11.
Ribeirão Preto, southeastern state of São Paulo, 41% of RTA in individuals over 60 were in pedestrians, of which 60% had sequelae due to their injuries, and 12% were cyclists.66 About 52% of the elderly injured were pedestrians and 13% were cyclists.71 They were all able to perform daily activities before but RTA have prevented them from their activities causing serious fi nancial diffi culties. The authors noted the importance of the elderly in society: many work in the community, care for relatives, support their families, work and consume goods and services. In the city of Londrina, of 121 elderly who were injured and treated in hospitals, 9% died and the main underlying cause was run over. According to the families, the elderly were totally independent before they were injured.12
Similar to the elderly, child pedestrians are frequently injured. There were more than 1,000 deaths per year due to run overs in children under 15 years between 2000 and 2005 (2.2 deaths per 100,000 inhabitants).15 The male-to-female ratio was 1.8:1 and the most affected age group was fi ve to nine. Because of poor data quality or run away from the accident scene 83% of reports did not specify the causing vehicle in 2000, decreasing to 70% in 2005. Among the vehicles specifi ed, there was a higher proportion of passenger vehicles, and the highest number of deaths occurred in pedestrians under 15 when compared to other RTA in this age group (64% in 2000 and 67% in 2005). In the city of Uberlândia, 46% of injured victims from zero to 14 years of age25 were cyclists and 31% pedestrians. Among the most severely injured (admission to an intensive care unit), 81% were pedestrians and 7% cyclists. Two-thirds of deaths occurred in pedestrians. The large proportion of RTA involving bikes can be possibly explained by the fact that they are commonly used for recreation in the fl at, sunny streets of Uberlândia. In Londrina, most injured people were cyclists (66%) and pedestrians (20%) and the rates of hospital admission were 38% and 35%, respectively. Of eight deaths reported, fi ve were pedestrians and two cyclists.35
With an estimated fl eet of 75 million units, bikes are the main means of transportation among workers in Brazil.s In the city of Pelotas, southern state of Rio Grande do Sul, 17% of the working population use bikes for daily commute. It is the main means of transportation among men (27%).6 Over a 12-month period, 6% of cyclists have suffered some RTA during work commute, a proportion that is higher than that reported in offi cial local data. In Maringá, cyclists accounted for 18% of deaths from RTA in 1992. The
use of bikes as a means of transportation is common in Brazilian inner cities with mild temperatures and fl at topography, and is an economic means especially among lower income population.62
Most studies have recommended measures to reduce RTA in pedestrians and cyclists, from the reassessment of public policies that encourage one-person-per-car commute2 to the design of more friendly public spaces to pedestrians especially children and elderly.2,15,68 The main recommendations include creating safe spaces for recreation,35 educational programs for drivers15,66 children, parents15 and the elderly.66 Faria & Braga22 (1999) proposed a program of actions to reduce the risk of RTA involving children and adolescents, especially pedestrians. These recommendations included assess-ment of routes of circulation, traffi c engineering and educational activities at pedestrian crossings, improved monitoring and a new proposal for traffi c education.
The creation of exclusive spaces for bicycle travel (bicycle paths and lanes) is the main recommenda-tion for increasing the safety of cyclists,6,8,35,62 besides increasing public awareness about traffi c rules.6 Studies conducted in Pelotas have shown that behavior change of cyclists and educational interventions will not have a signifi cant impact on reducing RTA in the city.7,8
Although it makes no reference to RTA, it is worth mentioning the publication of the Brazilian Program for Bike Mobility – Bike Brazil by the Brazilian Ministry of Cities.s
FREIGHT AND PASSENGER TRANSPORTATION
Sixty-two percent of freight and 96% of passengers are transported in the Brazilian highway system,t with a fl eet estimated at more than two million trucks and about 700,000 buses and minibuses.j Between 2004 and 2007 road traffi c accidents involving trucks and freight vehicles on federal highways increased 14%, from 40,107 to 45,833 with 3,124 deaths and more than 20,000 injured.u In the United States 25 truck drivers per 10,000 die in road accidents every year compared to 281 per 10,000 in Brazil.14 Truck drivers fall into two categories: employees of truckload services companies with better work conditions and safety, and self-employed.14 In addition to their stressful job, self-employed truck drivers have to deal with low pay, little or no training, great pressure to deliver their freight on time, and excess workload.14 However, the association with RTA cannot be verifi ed due to a lack of scientifi c publications on these workers working on the Brazilian
s Ministério das Cidades, Secretaria Nacional de Transporte e da Mobilidade Humana, Programa Bicicleta Brasil. Programa Brasileiro de Mobilidade por Bicicleta. Caderno de referência. Brasília (DF); 2007.
t Confederação Nacional do Transporte. Atlas do transporte 2006 [cited 2011 Jun 18]. Available from: http://www.sistemacnt.org.br/ informacoes/pesquisas/atlas/2006/index.htm
highway system. However, there few studies on sleep disorders, use of amphetamines and alcohol among professional truck drivers.
Studies with truck drivers at gas stations and roadside restaurants showed that two-thirds would drive nine hours or more per day, 50% of them over 12 hours a day.52 Another study showed 43% of truck drivers would drive more than 16 hours a day.70 This work routine is associated with high prevalences of excessive daytime sleepiness (32%70 to 46%55) and RTA. Many truck drivers use amphetamines to reduce their fatigue on long journeys. Nascimento et al52 reported that two-thirds of truck drivers use amphetamines: 27% reported daily use and 60% reported using it two to three times a week. Most (76%) reported using it to get to their destination in less time and 27% reported road accidents associated to its use. Amphetamines are purchased at gas stations (58%), drugstores (38%), and in their truck companies (8%). Nearly half of truck companies in the southern state of Santa Catarina reported drug use by drivers in 2004; 65% of them reported amphetamine use. Most reported RTA causing deaths or permanent disabilities.77
A study showed that 91% of truck drivers interviewed reported alcohol use during working hours, 24% of them reported daily use. Forty-three percent of drivers reported gas stations as their preferred place of consumption, and 17% who reported alcohol use were involved in road traffi c accidents.52 Seventy-one percent of truck drivers working in the metropolitan areas of 26 Brazilian capitals reported at least one episode of binge drinking in the last year. About 10% had used alcohol on the day of the interview and 9% reported drinking and driving.o
There were found no studies on RTA associated with passenger transportation. Data from the Federal Highway Authority, apud Correa,14 showed that 4% of more than 177,000 RTA occurring on federal highways involved buses and minibuses in 2004. These accidents kill at least 2,000 people every year.14 A study found that 42% of bus drivers were involved in interstate road acci-dents and in 8% they were associated with excessive sleepiness.75 Excessive daytime sleepiness was found in 28% of drivers, 48% reported sleepiness while driving and 12% took daily medication to help them stay awake. It should be noted that these proportions may be under-estimated since these interviews were conducted in the transportation company. Another study found that 16% of the drivers interviewed reported having fallen asleep at the wheel of the bus while on duty.48
Researchers have recommended prevention programs, increased oversight of roads on the sale of alcohol and amphetamines,52,70 and implementation of education programs, specifi c treatments55 and management of sleep disorders.75
DATA QUALITY
Mello Jorge & Koizumi43 have asserted that knowledge, research and understanding of these issues would allow the implementation of actions aimed at changing the current panorama of road traffi c in Brazil.
RTA data come from three main data sources: police reports, SIH-SUS and Mortality Database (SIM). Data from these sources are not fully complete and accurate and are neither complementary nor interconnected.43
The police report is a record of RTA fi led at civil police and civil-military federal highway authority stations. This is not a standard record systematized at the national level.43 Studies with police reports have demonstrated signifi cant underreporting of RTA and deaths. Barros et al9 verifi ed that 39% of RTA in Pelotas were underre-ported, varying according to the category of the victim, type of injury and time of occurrence. Andrade & Mello Jorge3 reported only 33% of police reports compared to records of emergency room and hospital admissions and death certifi cates in Londrina. Police report coverage was 72% of accidents involving car occupants and 8% and 25% of those involving cyclists and pedestrians, respectively. These authors have argued that police reports can provide major information on RTA that is crucial for the development of prevention actions.
Death certifi cates are SIM core data form. For deaths from external causes, a death certifi cate is completed by medical examiners at Institutes of Forensic Medicine (IMLs) who is ethically and legally responsible for providing complete death certifi cates according to the Brazilian Ministry of Health.v Unlike police reports, deaths are recorded in the SIM regardless of the time between the RTA and death, resulting in inconsistent data.43 ICD-10 allows to include information on RTA victim category (pedestrian, cyclist, motorcyclist, and others) and characteristics. A study with death certifi -cate data collected in 1996 following the implementa-tion of ICD-10 in Brazil showed that RTA was not reported as a cause of death in about 35% of deaths and 20% of death certifi cates did not include information on the category of victim.3 Limited knowledge and/ or low motivation of health providers could explain inadequate quality of data. Also in 1996, Drumond Jr. et al20 found that the type of accident could be identi-fi ed in 53% of deaths from police reports sent with the bodies, and 33% were RTA suggesting that IMLs do not use information available at their own institute. A study carried out in 15 Brazilian cities based on data from IMLs, police stations and victim’s homes showed an increase by 90% of RTA deaths compared to that reported in death certifi cates only.44 The authors argued that IMLs have data that allow to identify the cause of death but they are not included in death certifi cates. Jorge Mello et al have suggested there is a need to focus on the search for information, which is usually avail-able but have to be retrieved.46 Matos et al38 identifi ed 83% of the 70 deaths classifi ed as “unspecifi ed injury” by combining IML and SIM data from the Municipal Health Department of Belo Horizonte, and 41% were RTA-related. The cause of death was identifi ed in 71% of events of undetermined intent, and RTA were the most common cause, resulting in a 6% increase in deaths from run overs and 33% from car accidents. This study suggests the need to improve coding and selection of underlying cause, death certifi cate comple-tion and quality of police and medical informacomple-tion. In the city of São Jose dos Campos, southeastern state of São Paulo, missing information on death certifi cates prevented the estimate of mortality rates by type of victim. Unspecified RTA was recorded in 57% to 70% of death certifi cates.39 A study in the state Paraná using SIM data showed a reduction in the proportion of deaths due to events of undetermined intent, 22% in 1980 to 2% in 2005.33 The reduction of 15 deaths per 100,000 during the triennium 1979–1981 to two deaths in 2003–2005 suggests improved quality of records as a result of local data processing (1993) and systematic training of technical coders. According to Jorge Mello et
al,46 SIM has greatly improved coverage and quality of data and is expected to have a coverage close to 100%. There is a need to encourage, raise awareness and guide managers, conduct research and learn from successful experiences to improve quality of data.
ROAD TRAFFIC ACCIDENT COSTS
Deslandes et al18 estimated emergency room costs due for violence-related injuries in the city of Rio de Janeiro in 1996 in two local public hospitals, Miguel Couto Hospital (HMMC) and Salgado Filho Hospital (HMSF). RTA accounted for 67% and 46% of the costs in HMMC and HMSF, respectively, from R$ 78.00 to 236.00 for run overs and R$ 74.00 to 119.00 for other RTA, with an annual expenditure close to R$ 1 million.
The fi nancial impact on injured patients was assessed based on AIH records obtained from a university hospital in the city of Curitiba, southern state of Paraná.76 Between September 2000 and February 2001 RTA accounted for 54% of hospital admissions amounting to over US$ 110,000. The cost of each hospital admission was on average US$ 600, ranging from US$ 21 to 2,722.
Mello Jorge & Koizumi45 estimated costs of hospital admissions due to external causes based on SIH data in the state of São Paulo in 2000. Because of costly procedures, external causes incurred in higher average cost and daily cost (about 4% and 50%, respectively) compared to patients admitted due to natural causes. RTA accounted for 17% of hospital admissions due to external causes and 26% of deaths post-admission. The average hospital stay was 5.7 days and hospital mortality rate was 4.7%, both above the average rates from other external causes. The average cost was R$ 721.15 for discharged patients, R$ 1,500.79 for deceased patients and the daily cost was R$ 132.18. The Technical Advisory Group for Injury and Violence Prevention of the Health Department of the State São Paulo reported that during 2005 RTA accounted for 17% of hospital admissions and 22% of all costs from external causes amounting to nearly R$ 34 million.x
Melione & Mello Jorge estimated direct costs of SUS with hospital admissions due to external causes in the city of São José dos Campos, southeastern state of São Paulo.40 RTA were the leading cause of hospital admissions (33%) and costs (41%), totaling almost R$ 200,000 during the fi rst half of 2003. The highest average cost per hospital admission was for injuries (R$ 614.63), with an average hospital stay of 7.7 days and daily cost of R$ 80.21.
v Ministério da Saúde. Declaração de óbito: documento necessário e importante. Brasília (DF): MS; Conselho Federal de Medicina; Centro Brasileiro de Classifi cação de Doenças; 2007. (Série A. Normas e Manuais Técnicos).
Rodrigues et al60 in 2009 proposed a methodology for estimating the cost of accidents and violence based on SUS databases, state and municipal budgets and estimates of demand for outpatient care (urgent and emergency) from the National Household Survey. They found that the cost of RTA treatment was 4.3 times higher than that recorded in 2004 increasing from R$ 106.5 million to R$ 453 million.
The Brazilian Institute of Applied Economic Research (IPEA) and the National Association of Public Transportation (ANTP) estimated the economic and social costs of RTA by the sum of direct costs (medical and hospital costs, rescue services, vehicle damage, police assistance, [actual] loss of productivity, among others) and indirect costs ([potential] loss of produc-tivity and traffi c congestion) in 2003.d The total cost was estimated at R$ 3.6 billion in 49 large urban areas and R$ 5.3 billion for all urban areas in Brazil. Loss of productivity accounted for 43% of the total cost of RTA, followed by property damage (30%), medical and hospital costs (16%), and other costs (11%) such as legal proceedings, removal of vehicles, police assistance, among others. Cars, which are 74% of the motor vehicle fl eet, accounted for 56% of all costs. Motorcycles, urban buses and trucks, which are a lower percentage of the fl eet, accounted for a high proportion of costs (11% to 19%, 1% to 13%, and 4% to 11%, respectively). A RTA had an average cost of R$ 8,782.49; a RTA without injured victims cost on average R$ 3,262.00; with injured victims more than R$ 17,000; and with deaths R$ 144,478.00. Although accidents with victims (injured or dead) represented 14% of all accidents, they accounted for 69% of the total cost (almost R$ 2.5 billion).
In 2006 the IPEA and the ANTP conducted a new study on the costs of RTA on Brazilian highways.e More than 100,000 RTA on federal highways had an estimated total cost of R$ 6.5 billion in 2005. Victim costs accounted for 68%. Loss of productivity and health care were the main components of cost while vehicle costs represented 31%. Accidents involving fatalities had an average cost of R$ 418,000 while accidents with injured victims and without victims had an average cost of R$ 86,000 and R$ 17,000, respectively. RTA costs in state highways, as determined by adjustment models, were estimated at R$ 14.1 billion and R$ 1.4 billion in local highways. RTA on Brazilian highways cost about R$ 22 billion every year. The annual RTA costs in Brazil exceed R$ 27.2 billion.d,e
ROAD TRAFFIC ACCIDENT MORBIDITY AND MORTALITY REDUCTION PROGRAM
The 2001 Brazilian Ministry of Health Decree 737 established the National Policy for the Reduction of
Morbidity and Mortality from Violence and Injuries. The Program for Road Traffi c Accident Morbidity and Mortality Reduction: Mobilizing Society and Promoting Health (PRMMAT)w was launched to put into practice the new public policy. Its starting point was the Brazilian Vehicle Code. The program aimed to implement health promotion activities in partner-ship with government, non-government organizations and society in large urban areas with extensive road systems and high rate of accidents. It was coordinated by the Brazilian Ministry of Health and implemented at state and local levels and its priority was intersectoral actions with involvement of civil society. The areas of actions were defi ned based on the magnitude, risk and relevance of RTA in overall mortality. There were selected 26 urban areas, covering 84 municipalities in 14 states, totaling over 46 million people.
Between 2003 and 2006 the Latin American Center for Studies on Violence and Health, the National School of Public Health, Fundação Instituto Oswaldo Cruz and the Brazilian Ministry of Health evaluated the implementation of PRMMAT in fi ve cities: Recife, Belo Horizonte, Goiânia (central-west Brazil), São Paulo and Curitiba.69 This study evaluated mainly the effective-ness and impact of this intervention using a quantita-tive approach to outline the epidemiological scenario of RTA and a qualitative approach (interviews with managers, program implementation staff, users, among others, and fi eld observations). PRMMAT implementa-tion in the fi ve cities studied occurred at different time points from October 2003 to August 2004. The authors pointed out weaknesses including lack of familiarity with intersectoral work; poor visibility of RTA as a problem; frequent changes in coordination; and political interference in the program projects. The strengths included the experience of local departments in dealing with RTA; the process of intersectoral coordination; raising public awareness on RTA; and the production of a set of indicators and methods for program evaluation.
There is no assessment of the effectiveness of PRMMAT based on RTA mortality and morbidity reduction data. PRMMAT reduction goals to be achieved and their terms have not been reported.
CONCLUSIONS
Although scientifi c production on RTA is still modest in Brazil, there was a 450% growth in publications during the review period, from 22 until 1997 to 100 from 1998 to 2010 (using the descriptor “traffi c accidents” in the SciELO database). It is of note focal points of knowledge production and leading authors in the areas studied, particularly the production of an atlas of RTA
distribution in Brazil.h However, there are gaps in RTA research in Brazil including ongoing studies on acci-dents and traffi c fl ow on highways, use of more reliable denominators for risk comparison (e.g., per mileage traveled) and assessment of intervention effectiveness.
Brazil is off track in the fi ght against RTA which is evidenced by a growing number of deaths and sustained high mortality and hospital admission rates. The BVC had at its implementation the required legal framework to produce an effective reduction of RTA. Over the years factors including modern electronic data systems, improved technologies (breathalyzers, radars, and elec-tronic speed control devices), improved vehicle safety, and development of traffi c engineering and pre-hospital emergency services have all contributed to increase its effectiveness. In addition, several cities have invested in traffi c safety, highways were privatized and properly maintained and the media has given due visibility to the problem helping to raise public awareness.
The process of reducing RTA has been hindered by several actions, or lack of actions, including the require-ment to warn the public on the location of traffi c control devices, veto of a law prohibiting motorcycles to ride between lanes of traffi c, reduced penalties and payment of fi nes in installments, non-implementation of a traffi c education and mild restrictions on advertising related to drinking and driving, among others.
Marin & Queiroz (2000)34 stressed that state authorities shall have the responsibility for the implementation of effective public policies and law enforcement. The orig-inal BVC and most recently Law No. 11,705/08 have constituted legal advancements. Yet, public policies and
law enforcement lacked strength with minor actions or actions limited to short periods after their imple-mentation. Studies on the implementation of the new BVC have emphasized that strict law enforcement and punitive measures may be effective in reducing traffi c accidents10,23 and increasing traffi c safety practices.31 Andrade et al5 demonstrated that the greatest impact on RTA mortality reduction observed from 1994 to 2005 was a result of the implementation of the new BVC. But there were no major advances in reducing mortality after 1999, possibly due to loosening law enforcement and penalties provided for under the new code.
Studies that have shown RTA reduction after imple-mentation of BVC and Law No. 11,705/08 suggest that state authorities have the power to reduce a great deal of accidents and save lives. It is key to have ongoing vigorous actions. Educational actions are also important and should be widely implemented, but they are not effective as a single measure.53 Improvements in public transport, investment in alternative healthier means of transport such as bikes and promotion of rational use of private cars are essential to improve quality of life in cities and reduce traffi c accidents.
1. American Academy of Pediatrics, Committee on Injury and Poison Prevention; American Academy of Pediatrics, Committee on Adolescence. The teenage driver. Pediatrics. 1996;98(5):987-90.
2. Andrade SM, Mello Jorge MHP. Características das vítimas por acidentes de transporte terrestre em município da Região Sul do Brasil. Rev Saude Publica. 2000;34:149-56. DOI:10.1590/S0034-89102000000200008
3. Andrade SM, Mello Jorge MHP. Acidentes de transporte terrestre em cidade da Região Sul do Brasil: avaliação da cobertura e qualidade dos dados. Cad Saude Publica. 2001;17:1449-56. DOI:10.1590/ S0102-311X2001000600028
4. Andrade SM, Tomimatsu MFAI, Soares DA, Souza RKT, Soares DFPP, Mathias TAF, et al. Melhoria da qualidade das informações sobre causas externas do Sistema de Informações Hospitalares do Sistema Único de Saúde: uma proposta de intervenção. Rev Espaço Saude. 2009;10:70-6.
5. Andrade TM, Soares DA, Matsuo T, Liberatti CLB, Iwakura M. Road injury-related mortality in a médium-sized brazilian city after some preventive interventions. Traffi c Inj Prevention. 2008;9:450-5. DOI:10.1080/15389580802272831
6. Bacchieri G, Gigante DP, Assunção MC.
Determinantes e padrões de utilização da bicicleta e acidentes de trânsito sofridos por ciclistas trabalhadores da cidade de Pelotas, Rio Grande do Sul, Brasil. Cad Saude Publica. 2005;21:1499-508. DOI:10.1590/S0102-311X2005000500023 7. Bacchieri G, Barros AJ, Dos Santos JV, Gigante DP.
Cycling to work in Brazil: users profi le, risk behaviors, and traffi c accident occurrence. Accid Anal Prev. 2010;42:1025-30. DOI:10.1016/j.aap.2009.12.009 8. Bacchieri G, Barros AJD, dos Santos JV, Goncalves H,
Gigante DP. Intervenção comunitária para prevenção de acidentes de trânsito entre trabalhadores ciclistas. Rev Saude Publica. 2010;44:867-75. DOI:10.1590/ S0034-89102010000500012
9. Barros AJ, Amaral RL, Oliveira MS, Lima SC, Goncalves EV. Acidentes de trânsito com vítimas: sub-registro, caracterização e letalidade. Cad Saude Publica. 2003;19:979-86. DOI:10.1590/S0102-311X2003000400021
10. Bastos YGL, Andrade SM, Cordoni Junior L. Acidentes de trânsito e o novo Código de Trânsito Brasileiro em cidade da Região Sul do Brasil. Informe Epidemiologico SUS. 1999;8(2):37-45. DOI:10.5123/ S0104-16731999000200005
11. Bastos YGL, Andrade SM, Soares DA. Características dos acidentes de trânsito e das vítimas atendidas em serviço pré-hospitalar em cidade do Sul do Brasil, 1997/2000. Cad Saude Publica. 2005;21(3):815-22. DOI:10.1590/S0102-311X2005000300015 12. Biazin DT, Rodrigues RA. Perfi l dos idosos que
sofreram trauma em Londrina-Paraná. Rev Esc Enferm USP. 2009;43(3):602-8. DOI:10.1590/S0080-62342009000300015
13. Campos VR, Salgado R, Rocha MC, Duailibi S, Laranjeira R. Prevalência do beber e dirigir em Belo Horizonte, Minas Gerais, Brasil. Cad Saude Publica. 2008;24(4):829-34. DOI:10.1590/S0102-311X2008000400013
14. Corrêa JP. 20 anos de lições de trânsito: desafi os e conquistas do trânsito brasileiro de 1987 a 2007. Curitiba: Infolio Editorial; 2009.
15. Costa EPC, Kist M. Óbitos por atropelamento de pedestres, menores de 15 anos, no Brasil, nos anos 2000 e 2005: aspectos epidemiológicos e preventivos. Rev ABRAMET. 2009;27(2):46-57.
16. Cunto FJC. Acidentes de trânsito em Fortaleza em 2001 e 2002: apresentação comparativa dos dados registrados no SIAT-FOR. Rev ABRAMET. 2004;(43):48-52.
17. De Boni R, Leukefeld C, Pechansky F. Young people’s blood alcohol concentration and the alcohol consumption city law, Brazil. Rev Saude Publica. 2008;42(6):1101-4. DOI:10.1590/S0034-89102008005000054
18. Deslandes SF, Silva C, Ugá MAD. O custo do atendimento emergencial às vítimas de violências em dois hospitais do Rio de Janeiro. Cad Saude Publica. 1998;14(2):287-99. DOI:10.1590/S0102-311X1998000200013
19. Diniz EPH, Assunção A, Lima FPA. Por que os motociclistas profi ssionais se acidentam? Riscos de acidentes e estratégias de prevenção. Rev Bras Saude Ocup. 2005;30(111):42.
20. Drumond Jr M, Lira MMTA, Freitas M, Nitrini TM, Shibao K. Avaliação da qualidade das informações de mortalidade por acidentes não especifi cados e eventos com intenção indeterminada. Rev Saude Publica. 1999;33(3):273-80. DOI:10.1590/S0034-89101999000300008
21. Duailibi S, Pinsky I, Laranjeira R. Prevalência do beber e dirigir em Diadema, estado de Sao Paulo. Rev Saude Publica. 2007;41(6):1058-61. DOI:10.1590/S0034-89102006005000045
22. Faria EO, Braga MGC. Propostas para minimizar os riscos de acidentes de trânsito envolvendo crianças e adolescentes. Cien Saude Coletiva. 1999;4(1):95-107. DOI:10.1590/S1413-81231999000100008
23. Figueiredo LFP, Rasslan S, Bruscagin V, Cruz Junior V, Rocha e Silva M. Increases in fi nes and driver license withdrawal have effectively reduced immediate deaths from trauma on Brazilian roads: fi rst-year report on the new traffi c code. Injury. 2001;32(2):91-4.
24. Freitas EAM, Mendes ID, Oliveira LC. Ingestão alcoólica em vítimas de causas externas atendidas em um hospital geral universitário. Rev Saude Publica. 2008;42(5):813-21. DOI:10.1590/S0034-89102008000500005
25. Freitas JPP, Ribeiro LA, Jorge MT. Vítimas de acidentes de trânsito na faixa etária pediátrica atendidas em um hospital universitário: aspectos epidemiológicos e clínicos. Cad Saude Publica. 2007;23(12):3055-60. DOI:10.1590/S0102-311X2007001200028
26. Gawryszewski VP, Mello Jorge MHP, Koizumi MS. Mortes e internações por causas externas entre os idosos no Brasil: o desafi o de integrar a saúde coletiva e atenção individual. Rev Assoc Med Bras. 2004;50(1):97-103.
27. Gazal-Carvalho C, Carlini-Cotrim B, Silva OA, Sauaia N. Prevalência de alcoolemia em vítimas de causas externas admitidas em centro urbano de atenção ao trauma. Rev Saude Publica. 2002;36(1):47-54. DOI:10.1590/S0034-891020
28. Koizumi MS, Leyton V, Carvalho DG, Coelho CA, Mello Jorge MHP, Gianvecchio V, et al. Alcoolemia e mortalidade por acidentes de trânsito no Município de São Paulo, 2007/2008. Rev ABRAMET. 2010;28(1):25-34.
29. Laranjeira R, Romano M. Consenso brasileiro sobre políticas públicas do álcool. Rev Bras Psiquiatr. 2004;26(Suppl 1):S68-77. DOI:10.1590/S1516-44462004000500017
30. Leyton V, Ponce JC, Andreuccett G, Coelho CAS, Greve JMD, Sinagawa DM et al. Mortes no trânsito relacionadas ao uso de álcool no Estado de São Paulo em 2006. Rev ABRAMET. 2009;27(1):26-31.
31. Liberatti CL, Andrade SM, Soares DA. The new Brazilian Traffi c Code and some characteristics of victims in southern Brazil. Inj Prev. 2001;7(3):190-3. DOI:10.1136/ip.7.3.190
32. Lima DD, Branquinho AL, Magalhães VS, Teixeira BP, Braga BB. Motociclistas de Brasília e Goiânia. Despreparo e vulnerabilidade no trânsito. Rev ABRAMET. 2004;(44):28-31.
33. Lozada EMK, Mathias TAF, Andrade SM, Aidar T. Informações sobre mortalidade por causas externas e eventos de intenção indeterminada, Paraná, Brasil, 1979 a 2005. Cad Saude Publica. 2009;25(1):223-8. DOI:10.1590/S0102-311X2009000100024 34. Marin L, Queiroz MS. A atualidade dos acidentes de
trânsito na era da velocidade: uma visão geral. Cad Saude Publica. 2000;16(1):7-21. DOI:10.1590/S0102-311X2000000100002
35. Martins CBG, Andrade SM, Soares DA. Morbidade e mortalidade por acidente de transporte terrestre entre menores de 15 anos no município de Londrina, Paraná. Cien Cuid Saude. 2007(4);6:494-501. 36. Martinez Filho A. Motocicletas: o confl ito entre a
agilidade e segurança. Rev ABRAMET. 2006;(48):29-31.
37. Mascarenhas MDM, Malta DC, Silva MMA, Carvalho CG, Monteiro RA, Morais Neto OL. Consumo de álcool entre vítimas de acidentes e violências atendidas em serviços de emergência no Brasil, 2006 e 2007. Cien Saude Coletiva. 2009;14(5):1789-96. DOI:10.1590/S1413-81232009000500020
38. Matos SG, Proietti FA, Barata RCB. Confi abilidade da informação sobre mortalidade por violência em Belo Horizonte, MG. Rev Saude Publica. 2007;41(1):76-84. DOI:10.1590/S0034-89102007000100011
39. Melione LPR. Morbidade hospitalar e mortalidade por acidentes de transporte em São José dos Campos, São Paulo. Rev Bras Epidemiol. 2004;7(4):461-72. DOI:10.1590/S1415-790X2004000400009
40. Melione LP, Mello Jorge MHP. Gastos do Sistema Único de Saúde com internações por causas externas em São José dos Campos, São Paulo, Brasil. Cad Saude Publica. 2008;24(8):1814-24. DOI:10.1590/S0102-311X2008000800010
41. Melione LPR, Mello Jorge MHP. Confi abilidade da informação sobre hospitalizações por causas externas de um hospital público em São José dos Campos, São Paulo, Brasil. Rev Bras Epidemiol. 2008;11(3):379-92. DOI:10.1590/S1415-790X2008000300005
42. Mello Jorge MHP, Koizumi MS, Gawryszewski VP, Borges F. Acidentes de moto no fi nal do segundo milênio: estudo dos pacientes internados no município de São Paulo. Rev ABRAMET. 2001;(36):53-62. 43. Mello Jorge MHP, Koizumi MS. Acidentes de trânsito
no Brasil. Breve análise de suas fontes de dados. Rev ABRAMET. 2001;38:49-57.
44. Mello Jorge MHP, Gotlieb SLD, Laurenti R. O sistema de informação sobre mortalidade: problemas e propostas para o seu enfrentamento. II – Mortes por causas externas. Rev Bras Epidemiol. 2002;5(2):212-23. DOI:10.1590/S1415-790X2002000200008 45. Mello Jorge MHP, Koizumi MS. Gastos governamentais
do SUS com internações por causas externas. Rev Bras Epidemiol. 2004;7(2):228-38. DOI:10.1590/S1415-790X2004000200012
46. Mello Jorge MHP, Laurenti R, Gotlieb SLD. Análise da qualidade das estatísticas vitais brasileiras: a experiência de implantação do SIM e do SINASC. Cien Saude Coletiva. 2007;12(3):643-54. DOI:10.1590/ S1413-81232007000300014
47. Mello Jorge MHP, Koizumi MS. Acidentes de trânsito causando vítimas: possível refl exo da lei seca nas internações hospitalares. Rev ABRAMET. 2009;27(1):16-25.
48. Mello MT, Santana MG, Souza LM, Oliveira PCS, Ventura ML, Stampi C, et al. Sleep patterns and sleep-related complaints of Brazilian interstate bus drivers. Braz J Med Biol Res. 2000;33(1):71-7. DOI:10.1590/ S0100-879X2000000100010
49. Modelli MES, Pratesi R, Tauil PL. Alcoolemia em vítimas fatais de acidentes de trânsito no Distrito Federal, Brasil. Rev Saude Publica. 2008;42(2):350-2. DOI:10.1590/S0034-89102008005000012
50. Moura EC, Malta DC, Morais Neto OL, Penna GO, Temporao JG. Direção de veículos motorizados após consumo de bebidas alcoólicas, Brasil, 2006 a 2009. Rev Saude Publica. 2009;43(5):891-4. DOI:10.1590/ S0034-89102009005000062
51. Nascimento AS, Garcia MLT. Álcool e direção: uma questão na agenda política brasileira. Psicol Soc. 2009;21(2):231-22. DOI:10.1590/S0102-71822009000200008
52. Nascimento EC, Nascimento E, Silva JP. Uso de álcool e anfetaminas entre caminhoneiros de estrada. Rev Saude Publica. 2007;41(2):290-3.
Article based on G Bacchieri doctoral thesis submitted to Universidade Federal de Pelotas in 2010. The authors declare no confl icts of interest.
54. Pechansky F, De Boni R, Diemen LV, Bumaguin D, Pinsky I, Zaleski M, et al. Highly reported prevalence of drinking and driving in Brazil: data from the fi rst representative household study. Rev Bras Psiquiatr. 2009;31(2):125-30. DOI:10.1590/S1516-44462009000200008
55. Pinho RS, Silva Junior FP, Bastos JP, Maia WS, Mello MT, de Bruin VM, et al. Hypersomnolence and accidents in truck drivers: A cross-sectional study. Chronobiol Int. 2006;23(5):963-71. DOI:10.1080/07420520600920759
56. Pinsky I, Labouvie E, Pandina R, Laranjeira R. Drinking and driving: pre-driving attitudes and perceptions among Brazilian youth. Drug Alcohol Depend. 2001;62(3):231-7. DOI:10.1016/S0376-8716(00)00173-3
57. Pinsky I, Pavarino Filho RV. A apologia do consumo de bebidas alcoólicas e da velocidade no trânsito do Brasil: considerações sobre a propaganda de dois problemas de saúde pública. Comunicação teórico-clínica. Rev Psiquiatr R Gd Sul. 2007;29(1):110-8. DOI:10.1590/S0101-81082007000100019 58. Porto SM, Santos IS, Ugá MAD. A utilização de
serviços de saúde por sistemas de fi nanciamento. Cien Saude Coletiva. 2006;11(4):895-910. DOI:10.1590/ S1413-81232006000400013
59. Queiroz MS, Oliveira PC. Acidentes de trânsito: uma visão qualitativa no Município de Campinas, Sao Paulo, Brasil. Cad Saude Publica. 2002;18(5):1179-87. DOI:10.1590/S0102-311X2002000500010
60. Rodrigues RI, Cerqueira DRC, Lobao WJA, Carvalho AXY. Os custos da violência para o sistema público de saúde no Brasil: informações disponíveis e possibilidades de estimação. Cad Saude Publica. 2009;25(1):29-36. DOI:10.1590/S0102-311X2009000100003
61. Santos AM, Moura ME, Nunes BM, Leal CF, Teles JB. Perfi l das vítimas de trauma por acidente de moto atendidas em um serviço público de emergência. Cad Saude Publica. 2008;24(8):1927-38. DOI:10.1590/ S0102-311X2008000800021
62. Scalassara MB, Souza RKT, Soares DFPP. Características da mortalidade por acidentes de trânsito em localidade da Região Sul do Brasil. Rev Saude Publica.1998;32(2):125-32. DOI:10.1590/ S0034-89101998000200004
63. Seraphim LA. Motocicletas no trânsito. Rev ABRAMET. 2002;(39):22-31.
64. Silva DW, Andrade SM, Soares DA, Soares DFPP, Mathias TAF. Perfi l do trabalho e acidentes de trânsito entre motociclistas de entregas em dois municípios de médio porte do Estado do Paraná, Brasil. Cad Saude Publica. 2008;24(11):2643-52. DOI:10.1590/S0102-311X2008001100019
65. Silva DW, Andrade SM, Soares DA, Soares DFPP, Nunes EFPA, Melchior R. Condições de trabalho e riscos no trânsito urbano na ótica de trabalhadores
motociclistas. Physis. 2008;18(2):339-60. DOI:10.1590/S0103-73312008000200008 66. Silveira R, Rodrigues RAP, Costa Junior ML. Idosos
que foram vítimas de acidentes de trânsito no município de Ribeirão Preto, em 1998. Rev Lat Am Enferm. 2002;10(6):765-71. DOI:10.1590/S0104-11692002000600003
67. Soares DFPP, Soares DA. Características das vítimas pedestres traumatizadas em acidente de trânsito em Maringá – PR. Cien Cuid Saude. 2002;1(1):55-9. 68. Soares DFPP, Barros MBA. Fatores associados ao risco
de internação por acidentes de trânsito no município de Maringá-PR. Rev Bras Epidemiol. 2006;9(2):193-205. DOI:10.1590/S1415-790X2006000200006 69. Souza ER, Minayo MCS, Franco LG. Avaliação
do processo de implantação e implementação do Programa de Redução da Morbimortalidade por acidentes de Trânsito. Epidemiol Serv Saúde. 2007;16(1):19-31. DOI:10.5123/S1679-49742007000100003
70. Souza JC, Paiva T, Reimão R. Sono, qualidade de vida e acidentes em caminhoneiros brasileiros e portugueses. Psicol Estud. 2008;13(3):429-36. DOI:10.1590/S1413-73722008000300003
71. Souza RKT, Soares DFPP, Mathias TAF, Andrade OG, Santana RG. Idosos vítimas de acidentes de trânsito: aspectos epidemiológicos e impacto na sua vida cotidiana. Acta Sci Health Sci. 2003;25(1):19-25. 72. Tomimatsu MFAI, Andrade SM, Soares DA,
Mathias TAF, Sapata MPM, Soares DFPP, et al. Qualidade da informação sobre causas externas no Sistema de Informações Hospitalares. Rev Saude Publica. 2009;43(3):413-20. DOI:10.1590/S0034-89102009005000019
73. Veronese AM, Oliveira DLLC. Os riscos dos acidentes de trânsito na perspectiva dos moto-boys: subsídios para a promoção da saúde. Cad Saude Publica. 2006;22(12):2717-21. DOI:10.1590/S0102-311X2006001200021
74. Veronese AM, Oliveira DLLC, Shimitz TSD.
Caracterização de motociclistas internados no hospital de pronto-socorro de Porto Alegre. Rev Gaucha Enferm. 2006;27(3):379-85.
75. Viegas CAA, Oliveira HW. Prevalência de fatores de risco para a síndrome da apnéia obstrutiva do sono em motoristas de ônibus interestadual. J Bras Pneumol. 2006;32(2):144-9. DOI:10.1590/S1806-37132006000200010
76. Von Bahten LC, Alcantara EM, Pimenta APP, Dallagnol JC, Yoshizumi KO, Dresch MF. O impacto econômico do trauma em um hospital universitário. Rev Col Bras Cir. 2003;30(3):224-9. DOI:10.1590/S0100-69912003000300010