Resumo
O objetivo básico do trabalho foi avaliar os custos econômicos relacionados às doenças dos aparelhos respiratório e circulatório no município de Cubatão (SP). Para tanto, foram utilizados dados de interna-ção e dias de trabalho perdidos com a internainterna-ção (na faixa dos 14 aos 70 anos de idade), na base de dados do Sistema Único de Saúde (SUS). Resultados: A partir dos dados levantados, calculou-se o valor total de R$ 22,1 milhões gastos no período de 2000 a 2009 devido às doenças dos aparelhos circulatório e respi-ratório. Parte desses gastos pode estar diretamente relacionada à emissão de poluentes atmosféricos no município. Para se estimar os custos da poluição foram levantados dados de outros dois municípios da Região da Baixada Santista (Guarujá e Peruíbe), com menor atividade industrial em comparação a Cubatão. Verificou-se que, em ambos, as médias de gastos per capita em relação às duas doenças são menores do que em Cubatão, mas que essa diferença vem diminuindo sensivelmente nos últimos anos.
Palavras-chave: Poluição atmosférica; custos de saúde; Cubatão; doenças cardiorrespiratórias. Flávio Tayra
Economista. Doutor em Ciências Sociais e Pós-doutorado em Saúde Pública pela USP. Professor da FEI e consultor econômico. Endereço: Rua Dr. Nicolau de Souza Queiroz, 167, ap. 502, CEP 04105-000, São Paulo, SP, Brasil.
E-mail: [email protected]
Helena Ribeiro
Geógrafa. Livre-docente em Saúde Pública. Professora titular do Departamento de Saúde Ambiental da Faculdade de Saúde Pública da Universidade de São Paulo.
Endereço: Av. Dr. Arnaldo, 715, CEP 01246-904, São Paulo, SP, Brasil.
E-mail: [email protected]
Adelaide de Cássia Nardocci
Física. Livre-docente em Saúde Pública. Professora associada do Departamento de Saúde Ambiental da Faculdade de Saúde Pública da Universidade de São Paulo.
Endereço: Av. Dr. Arnaldo, 715, CEP 01246-904, São Paulo, SP, Brasil.
E-mail: [email protected]
1 This research was part of the main project “Estudo da Saúde em Cubatão” (Study of Health at Cubatão), which aimed to investi-gate the effects of air pollution on the health of inhabitants of the municipality of Cubatão, State of São Paulo.
Funding: Project 1891 of FUSP - Fundação de Apoio à Universidade de São Paulo, in a partnership between the School of Public Health and CEPEMA/Poli/USP, with financial resources of Petrobras.
Economic Cost of Air Pollution in Cubatão -
SP Based on Health Expenses Related to Diseases
of the Respiratory and Circulatory Systems
Avaliação Econômica dos Custos da Poluição em Cubatão -
SP com Base nos Gastos com Saúde Relacionados às Doenças
Abstract
The aim of this research was to evaluate economic costs of respiratory and circulatory diseases in the municipality of Cubatão, in the state of São Paulo, Brazil. Data on hospital admissions and on missed working days due to hospitalization (for age group 14 to 70 years old) from the database of Sistema Único de Saúde (SUS - Brazilian National Health System) were used. Results: Based on these data, it was calculated that R$ 22.1 million were spent in the period 2000 to 2009 due to diseases of the respira-tory and circularespira-tory systems. Part of these expenses can be directly related to the emission of atmosphe-ric pollutants in the city. In order to estimate the costs related to air pollution, data on Cubatão were compared to data from two other municipalities that are also located at the coast side (Guarujá and Peruíbe), but which have little industrial activity in comparison to Cubatão. It was verified that, in both, average per capita costs were lower when compared to Cubatão, but that this difference has been decre-asing in recent years.
Keywords: Atmospheric Pollution; Health Costs; Cubatão; Cardiorespiratory Diseases.
Introduction
Despite the advances in the control of pollutant emissions related to the industrial activity, it is still an important source of air pollution. The analysis of the economic and social development that indus-try enables usually does not take into account the cost-benefit balance of the activities, and does not include the short and long term cost associated with the increase in deaths and diseases that is caused by pollution.
Diverse studies have reported a significant as-sociation between pollution levels and morbidity and mortality markers. In these studies, particle pollution has been associated with worse pulmonary function, increased respiratory symptoms (Schwartz, 1994; Ostro, 1998; Desqueyroux and Momas, 1999) and with the increment in hospital admissions due to respiratory diseases (Sunyer and col., 1997; Gouveia and Fletcher, 2000) and cardiovascular diseases (Zanobetti and col., 2000; Poloniecki and col., 1997). The increase in daily mortality has also been reported in many countries (Anderson and col., 1996; Daumas and col., 2004; Toulomi and col., 1996), and it may be associated with particle pollution, even when the average concentrations are within the international standards for air quality (Momas and col., 1993).
Calculating the economic costs associated with pollution – in this case, air pollution – is an action of great importance for decision-making as, by me-ans of specific techniques, it enables to construct indicators that subsidize the adoption of the most efficient options. In this sense, the basic purpose is to measure the utilized inputs (costs) and the obtained results (effects). Thus, the aim of such measurement is that of optimization, either through the minimization of costs to obtain the same results, or through the maximization of results at the lowest cost. Essentially, therefore, economic assessments are technical procedures that support strategic and managerial decisions.
Methodology
The majority of the analyzes that estimate the social cost of pollution use the damage-function method (DF), in which the following relationships are estimated: policy and emissions, emissions and air quality, air quality and exposure, exposure and physical damages, and physical damages and mone-tary value (Delucchi, 2000; Delucchi and col., 2002; Gangadharan and Valenzuela, 2001; Garber and col., 1996; Garber and Phelps, 1997; Krupnick and col., 1996; Pearce and Markandya, 1987). However, all these stages – and particularly the assessment stage – contain a reasonable amount of uncertainty, and as a result, the estimates of the socioeconomic cost of air pollutant emissions have proved to be highly variable, and many times, conflicting (Murphy and Delucchi, 1998; McCubbin and Delucchi, 1999; Quah and Boon, 2003).
Generally speaking, the valuation methods can be divided between those of demand function and those of production function (Seroa da Motta and Mendes, 1995). In the case of the production func-tion methods, the environmental resource has a value, because it contributes as input or substitute in the production of a private good or service. Due to this relation, it is possible to use the prices of pri-vate goods and services so that the monetary value of the environmental resource is estimated (Seroa da Motta, 1995). These methods are the most used ones in the valuation of nonmarket goods, because they employ techniques that are simpler to apply, as goods that already exist in the market are used as shadow price.
The marginal productivity method is capable of establishing relations between a given production function and possible alterations to a particular environmental good or service, observing the cor-relation between these variables and constructing a dose-response function (DR).
The health costs associated with diseases of the respiratory and circulatory systems (related, among other reasons, to air pollution) can be classified into four categories:
1) Medical expenses associated with the treatment of diseases;
2) Missed working days resulting from the disease;
3) Expenses to avoid or prevent (preventive expen-ses) and activities associated with attempts to mitigate the disease; and
4) Disutility associated with the symptoms and leisure opportunities lost due to the disease.
In view of the difficulties in estimating the por-tions referring to the two last items, we calculated the health cost associated with air pollution by adding total hospital expenses (per age group and per event) to the value of the missed working days due to the disease, based on the average salaries in the region.
Hospital expenses were calculated and the num-ber of missed working days due to hospitalizations was estimated, based on data from Datasus, of the Sistema Único de Saúde (SUS – Brazilian National Health System), surveyed in the portal of the Health Department of the State of São Paulo. Data on mor-tality by causes were provided by Fundação Seade, of the Government of the State of São Paulo.
In this stage of the research, hospitalization ex-penses due to the main causes (ICDs) were surveyed, as well as deaths, emphasizing the respiratory and cardiovascular causes. This survey fulfilled two objectives: to detect the main causes of death in the municipality, and also, the trend of such causes in the 2000 – 2009 decade. With a variation in the data, the number of missed working days due to hospital admissions was also calculated for those in the age group 14-70 years, so that it was possible to measure the costs related to absences from work, a portion that is not included in the data of Sistema Único de Saúde. With these data, it was possible to obtain the direct and indirect costs related to hospitalizations due to respiratory and cardiovascular diseases in Cubatão in the period from 2000 to 2009.
Income data were surveyed from the calcula-tion of the average effective yield of the employed population (Pastore, 1994), calculated by Pesquisa Mensal do Emprego (PME – Monthly Employment Re-search), of IBGE – Instituto Brasileiro de Geografia e Estatística (Brazilian Institute of Geography and Statistics). All the values were discounted to present value (January 2010), based on the average of IPCA (Extended National Consumer Price Index, also of IBGE) to the years under analysis.
used the mean of the 2009 average monthly labor income, for overall Brazil, as the research is carried out only in metropolitan regions and the average of the Metropolitan Region of São Paulo was higher than the national average. These data were obtained from IBGE’s PME, and the average was divided by 30 (number of days).
From 1970 to 1980, Cubatão’s economic growth reached a level of 4.43% per year, and in 1985, its industrial production represented approximately 3% of the national GDP, with industries of the petro-chemical, steel and fertilizer sectors. On the other hand, in 1984, its industries released approximately 1,000 daily tons of pollutants into the air, and the air pollution levels reached values that were abso-lutely critical. Since then, dozens of programs and actions have been developed with the aim of redu-cing the industrial emissions. In 2010, according to Companhia de Tecnologia de Saneamento Ambiental (CETESB - Environmental Sanitation Technology Company), Cubatão had 230 priority industrial sour-ces of fossil fuels emission and combustion, which released annually into the atmosphere 3.4x10³ tons of carbon monoxide CO, 1.1x10³ tons of hydrocarbons HC, 7.62x10³ tons of nitrogen oxides NOx, 15.8x10³ of sulfur oxides SOx and 3.06x10³ tons of particulate matter (CETESB, 2011).
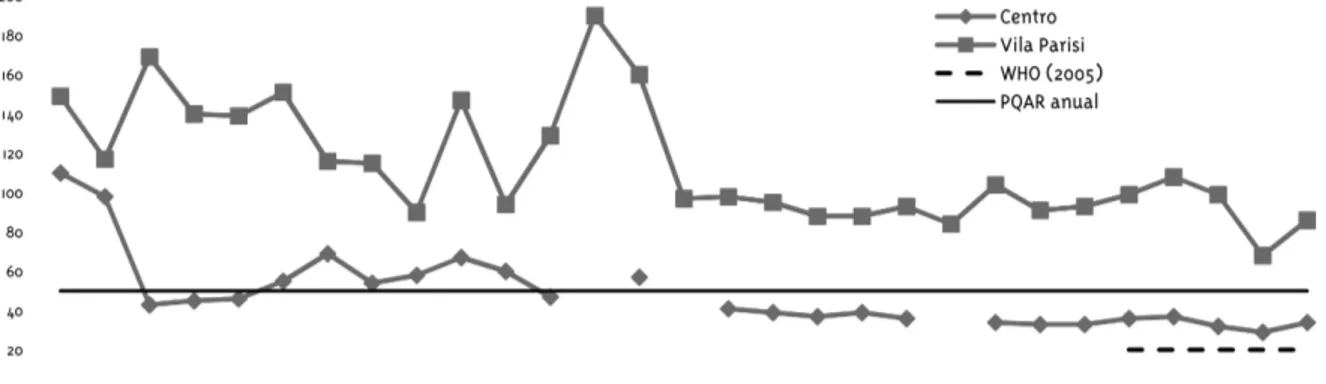
Despite the efforts that have been undertaken and the systematic reduction in the emission of
pollutants in the last decades in Cubatão, the air quality standards are frequently exceeded. Graph 1 shows the average annual concentrations of parti-culate matter, measured in the monitoring stations located in the central region and in the industrial area of Cubatão, from 1982 to 2010, as well as the values of the air quality standard defined by CETESB and the standard recommended by the World Health Organization in 2005 (WHO, 2005).
Results
Causes of death in the municipality
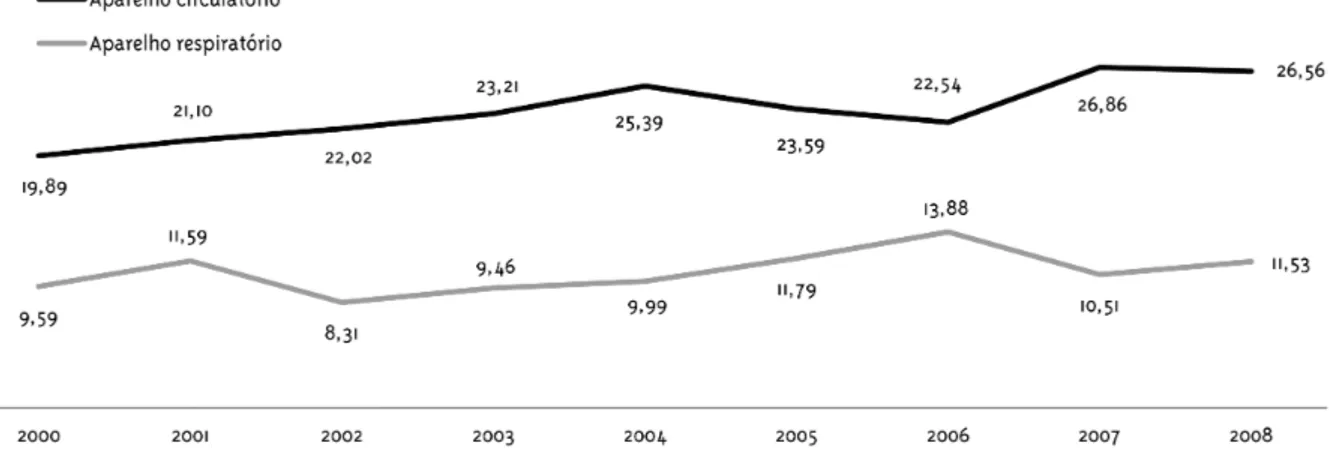
At Cubatão, the respiratory causes represent the fourth cause of death. Air pollution is related to the increase in respiratory problems. However, in the studied decade, the diseases of the circulatory system were the main cause of death in the city. Be-tween 2000 and 2009, 1,436 deaths were registered due to this cause, representing 23.4% of the cases. They were followed by external causes (17.9%) and cancer (13.3%). Respiratory system diseases were responsible for 10.7% of the deaths, as shown by Graph 2.
In the period under analysis, the causes of death in the municipality presented a relative stability. In absolute figures, the total number of deaths decrea-sed from 699 in 2000 to 659 in 2008. The circulatory system diseases represented 19.9% of the deaths in
Gráfico 1 - Concentração média anual de material particulado inalável em Cubatão: 1982 -2010
2000 and reached 26.6% in 2008. Those related to the respiratory system represented 9.6% in 2000 and reached 11.5% in 2008. In terms of percentages, both presented an increasing trend (Graph 2).
Respiratory deaths
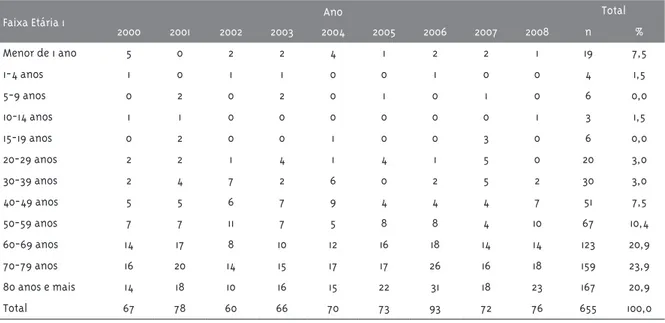
Deaths caused by respiratory diseases in children have greater impact among those younger than 1 year (7.5%). However, people older than 60 years represent 65.7% of the deaths related to this cause, which indicates an age-related situation of vulnera-bility, as shown in Table 1.
Despite the oscillations, a slight reduction in the mortality rate by respiratory causes can be perceived in the municipality of Cubatão. In 2000, the rate was 61.9 per 100 thousand inhabitants; it reached 76.9 in 2007 and, in 2008, it was 59.5 per 100 thousand inhabitants. On the other hand, in the age group of children younger than 1 year, the decline was quite significant: it was 234.7 in 2000 and decreased to 49.7 in 2008 (Graph 3).
Hospitalizations
In terms of percentages, pregnancy, delivery and puerperium are the main cause of hospitalization through Sistema Único de Saúde (SUS) in Cubatão. They rank first in the authorizations for hospitali-zations of the SUS (23.8%), followed by the causes related to diseases of the respiratory system, which
represent 11.2% and are responsible for the highest number of days of stay in hospitals. Injuries and external causes are the third most important chapter in terms of number of hospitalizations, followed by diseases related to the circulatory system, with 8% (Graph 4).
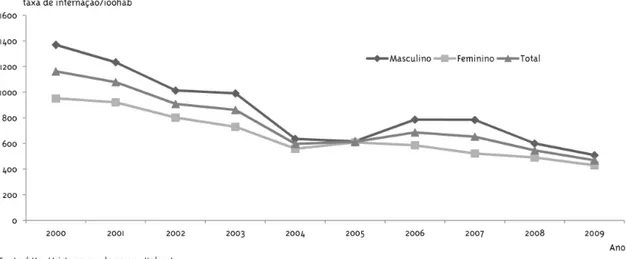
Hospitalization rates due to respiratory diseases present a sharp decline trend, both for men and for women, as presented in Graphs 5 and 6.
Costs associated with the diseases
Although they are the fourth main hospitalization cause, the diseases of the circulatory system have the main share in the values paid by the SUS (18.3% of the total), being followed by those related to preg-nancy and delivery. The diseases of the respiratory system, the second main hospitalization cause, are the third in terms of paid monetary values.
In monetary values, between 2000 and 2009 the SUS spent R$ 59.2 million in the municipality. The diseases of the circulatory system consumed R$ 10.9 million and represent 18.3% of the resources. The diseases of the respiratory system, in turn, corres-ponded to expenses of R$ 6.9 million (11.6%).
The share of the circulatory diseases in the total value paid by the SUS, in relative terms, reached its peak in 2003 (21.7%). The respiratory diseases had their largest share in 2001, when they reached 13.9%, as shown in Graph 7.
Gráfico 2 - Evolução das causas de óbito (%): 2000-2008
Tabela 1 - Número de óbitos por causas respiratórias, segundo ano e faixa etária (anos), Cubatão-SP 2000 a 2008
Faixa Etária 1 Ano Total
2000 2001 2002 2003 2004 2005 2006 2007 2008 nº %
Menor de 1 ano 5 0 2 2 4 1 2 2 1 19 7,5
1-4 anos 1 0 1 1 0 0 1 0 0 4 1,5
5-9 anos 0 2 0 2 0 1 0 1 0 6 0,0
10-14 anos 1 1 0 0 0 0 0 0 1 3 1,5
15-19 anos 0 2 0 0 1 0 0 3 0 6 0,0
20-29 anos 2 2 1 4 1 4 1 5 0 20 3,0
30-39 anos 2 4 7 2 6 0 2 5 2 30 3,0
40-49 anos 5 5 6 7 9 4 4 4 7 51 7,5
50-59 anos 7 7 11 7 5 8 8 4 10 67 10,4
60-69 anos 14 17 8 10 12 16 18 14 14 123 20,9
70-79 anos 16 20 14 15 17 17 26 16 18 159 23,9
80 anos e mais 14 18 10 16 15 22 31 18 23 167 20,9
Total 67 78 60 66 70 73 93 72 76 655 100,0
Fonte: Fundação SEADE/Secretaria de Estado da Saúde de São Paulo http://sistema.saude.sp.gov.br/tabnet/tabnet.exe?sim.def
Gráfico 3 - Evolução da taxa de mortalidade em Cubatão, por causas respiratórias (por 100 mil hab): 2000-2008
Gráfico 4 - Principais motivos de internação em Cubatão (%): 2000-2009
Gráfico 5 - Taxa de internações por doenças respiratórias (CID J01 a J98) segundo sexo e ano de competência, Cubatão: 2000 a 2009
Gráfico 6 - Tendência e Taxa de Internações por doenças respiratórias (CID J01 a J98) segundo ano de compe-tência, Cubatão: 2000 a 2009
Fonte: http://sistema.saude.sp.gov/tabnet
Fonte: http://sistema.saude.sp.gov/tabnet
Although they have a lower number of hospi-talizations and a smaller share in terms of value paid, the diseases of the respiratory system exceed those of the circulatory system in number of days at the hospital. The treatments can be simpler or less expensive, but they demand more days of hos-pitalization.
Expenses by age group
The longer hospitalization time caused by the res-piratory diseases affects mainly children younger than 1 year, who account for 24% of the total of resources spent on hospitalization. The children younger than 14 years (including those younger than 1 year) account for 51.4% of the total spent due to this cause.
In the case of the circulatory diseases, the situation is different, because their costs are con-centrated mainly on the age group 40 – 70 years, which absorb 65% of the expenses, as can be seen on Tables 2 to 5.
The days of stay at the SUS units totaled 424.5 thousand between 2000 and 2009. The respiratory system diseases generated the largest period of stay, being responsible for 56.9 thousand days in the period, although they rank third in the paid authorizations for hospital admissions.
Calculating the economic cost of the disease
As seen in the previous item, despite the longer stay due to the respiratory system diseases, the highest number of missed working days is due to the causes of the circulatory system, which affect people in an age group in which they are more involved in the labor market.
As was already mentioned in the methodology, the value per missed day was calculated based on the 2009 average monthly income for overall Bra-zil. These data were obtained from the Monthly Employment Research (PME) of IBGE; they were divided by 30 (number of days) and multiplied by the hospitalization days. It is a conservative calculation, as absences from work may have occurred before or after the hospitalizations, due to the same episode of disease.
Due to this aspect, the cost of missed working days due to diseases of the circulatory system is much higher than that of the diseases of the res-piratory system, which has represented, since the beginning of the decade, a share that is sometimes inferior to 50% (Table 6).
The health cost associated with hospitalizations due to diseases of the circulatory and respiratory systems was also calculated, adding the total hospital expenses (per age group and per event,
Gráfico 7 - Participação no total pago pelo SUS, em internações, em Cubatão (%)
Tabela 2 - Internações - Valor Total pago pelo SUS, a preços de janeiro de 2010* Munic Resid SP: 351350 Cubatão
CID10 Capítulos: IX. Doencas do aparelho circulatorio Período:2000-2009
Fx Etária 1 2000 2001 2002 2003 2004 2005 2006 2007 2008 2009 Total
Menor de 1 ano 44.515 3.810 3.897 2.867 58 476 319 9.979 5.107 29.963 100.991 1-4 anos 2.351 3.200 2.932 - 55 1.897 54 441 528 329 11.787
5-9 anos 2.177 592 4.088 1.797 9.755 3.182 3.204 5.496 19.832 2.428 52.550 10-14 anos 1.700 1.318 2.283 1.837 9.011 8.014 2.775 631 3.434 8.620 39.623 15-19 anos 75.170 5.975 3.144 21.529 4.552 197 3.973 2.472 19.087 287 136.387 20-29 anos 28.881 34.242 37.365 19.140 26.984 24.143 10.141 15.316 17.891 17.828 231.931
30-39 anos 98.526 62.599 61.175 70.002 74.429 67.618 92.554 59.896 67.868 54.572 709.239 40-49 anos 149.044 165.502 163.012 232.803 102.922 211.596 234.881 85.877 141.715 172.665 1.660.018 50-59 anos 298.001 267.659 310.448 280.355 304.982 258.013 210.765 209.411 235.649 232.316 2.607.598 60-69 anos 284.613 195.780 276.696 284.942 214.942 238.102 138.230 206.290 247.011 205.494 2.292.100
70-79 anos 151.633 147.722 158.813 194.624 134.085 197.604 144.388 152.263 197.999 212.167 1.691.298 80 anos e mais 35.607 61.658 58.273 41.450 85.774 65.501 55.554 76.431 71.733 59.852 611.833 Total 1.172.220 950.057 1.082.125 1.151.346 967.548 1.076.345 896.838 824.501 1.027.855 996.521 10.145.356
http://sistema.saude.sp.gov.br/tabnet/tabnet.exe?sim.def *Deflacionado pelo IPCA
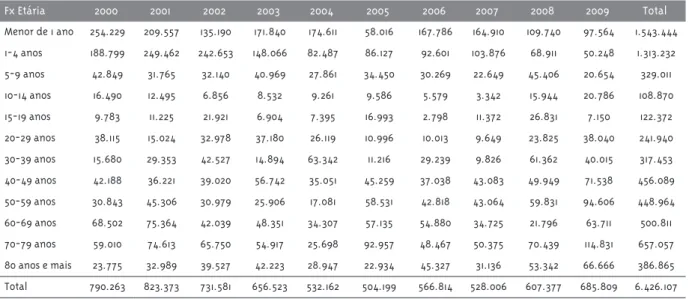
Tabela 3 - Internações - Valor Total pago pelo SUS, a preços de janeiro de 2010* CID10 Capítulos: X. Doencas do aparelho respiratorio
Período:2000-2009
Fx Etária 2000 2001 2002 2003 2004 2005 2006 2007 2008 2009 Total
Menor de 1 ano 254.229 209.557 135.190 171.840 174.611 58.016 167.786 164.910 109.740 97.564 1.543.444 1-4 anos 188.799 249.462 242.653 148.066 82.487 86.127 92.601 103.876 68.911 50.248 1.313.232 5-9 anos 42.849 31.765 32.140 40.969 27.861 34.450 30.269 22.649 45.406 20.654 329.011 10-14 anos 16.490 12.495 6.856 8.532 9.261 9.586 5.579 3.342 15.944 20.786 108.870
15-19 anos 9.783 11.225 21.921 6.904 7.395 16.993 2.798 11.372 26.831 7.150 122.372 20-29 anos 38.115 15.024 32.978 37.180 26.119 10.996 10.013 9.649 23.825 38.040 241.940 30-39 anos 15.680 29.353 42.527 14.894 63.342 11.216 29.239 9.826 61.362 40.015 317.453 40-49 anos 42.188 36.221 39.020 56.742 35.051 45.259 37.038 43.083 49.949 71.538 456.089
50-59 anos 30.843 45.306 30.979 25.906 17.081 58.531 42.818 43.064 59.831 94.606 448.964 60-69 anos 68.502 75.364 42.039 48.351 34.307 57.135 54.880 34.725 21.796 63.711 500.811 70-79 anos 59.010 74.613 65.750 54.917 25.698 92.957 48.467 50.375 70.439 114.831 657.057 80 anos e mais 23.775 32.989 39.527 42.223 28.947 22.934 45.327 31.136 53.342 66.666 386.865
Total 790.263 823.373 731.581 656.523 532.162 504.199 566.814 528.006 607.377 685.809 6.426.107
Tabela 4 - Permanência por Faixa Etária e Ano de Competência Munic Resid SP: 351350 Cubatão
CID10 Capítulos: IX. Doencas do aparelho circulatorio
Fx Etária 2000 2001 2002 2003 2004 2005 2006 2007 2008 2009 Total
Menor de 1 ano 153 20 24 31 2 6 11 17 48 64 376
1-4 anos 17 10 4 - 1 11 1 9 7 2 62
5-9 anos 16 21 6 13 18 19 49 77 54 21 294
10-14 anos 23 9 19 10 40 13 13 6 56 5 194
15-19 anos 173 65 20 64 57 1 16 29 42 59 526
20-29 anos 112 177 240 118 158 99 71 168 340 154 1.637
30-39 anos 345 346 239 236 261 191 474 148 775 630 3.645 40-49 anos 593 500 669 889 829 935 746 644 1.541 1.139 8.485
50-59 anos 1.253 1.259 1.410 1.145 1.481 893 903 1.171 9.515 60-69 anos 1.424 1.100 1.309 1.116 1.049 1.126 905 1.126 1.180 1.002 11.337 70-79 anos 914 949 1.107 1.062 1.223 1.055 1.114 1.112 1.166 1.178 10.880 80 anos e mais 240 594 401 309 546 551 500 518 456 333 4.448
Total 5.263 5.050 5.448 4.993 5.665 4.900 4.803 5.025 5.709 4.602 51.458
http://sistema.saude.sp.gov.br/tabnet/tabnet.exe?sim.def
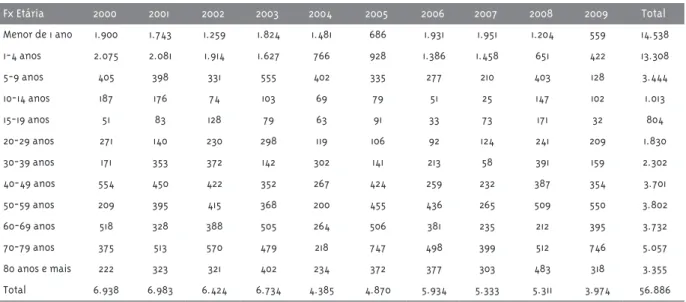
Tabela 5 - Permanência por Faixa Etária e Ano de Competência Munic Resid SP: 351350 Cubatão
CID10 Capítulos: IX. Doencas do aparelho respiratório
Fx Etária 2000 2001 2002 2003 2004 2005 2006 2007 2008 2009 Total
Menor de 1 ano 1.900 1.743 1.259 1.824 1.481 686 1.931 1.951 1.204 559 14.538 1-4 anos 2.075 2.081 1.914 1.627 766 928 1.386 1.458 651 422 13.308
5-9 anos 405 398 331 555 402 335 277 210 403 128 3.444
10-14 anos 187 176 74 103 69 79 51 25 147 102 1.013
15-19 anos 51 83 128 79 63 91 33 73 171 32 804
20-29 anos 271 140 230 298 119 106 92 124 241 209 1.830
30-39 anos 171 353 372 142 302 141 213 58 391 159 2.302 40-49 anos 554 450 422 352 267 424 259 232 387 354 3.701 50-59 anos 209 395 415 368 200 455 436 265 509 550 3.802 60-69 anos 518 328 388 505 264 506 381 235 212 395 3.732
70-79 anos 375 513 570 479 218 747 498 399 512 746 5.057 80 anos e mais 222 323 321 402 234 372 377 303 483 318 3.355 Total 6.938 6.983 6.424 6.734 4.385 4.870 5.934 5.333 5.311 3.974 56.886
Tabela 6 - Cubatão - Dias perdidos no trabalho Período:2000-2009
Doenças 2000 2001 2002 2003 2004 2005 2006 2007 2008 2009 Total
Doenças do aparelho respiratório 1.774 1.749 1.955 1.744 1.215 1.723 1.414 987 1.911 1.699 16.171 Doenças do aparelho circulatório 3.900 3.447 3.887 3.568 3.835 3.245 3.115 3.286 3.878 2.984 35.145
Total 5.674 5.196 5.842 5.312 5.050 4.968 4.529 4.273 5.789 4.683 51.316
Fonte: http://sistema.saude.sp.gov.br/tabnet/tabnet.exe?sim.def
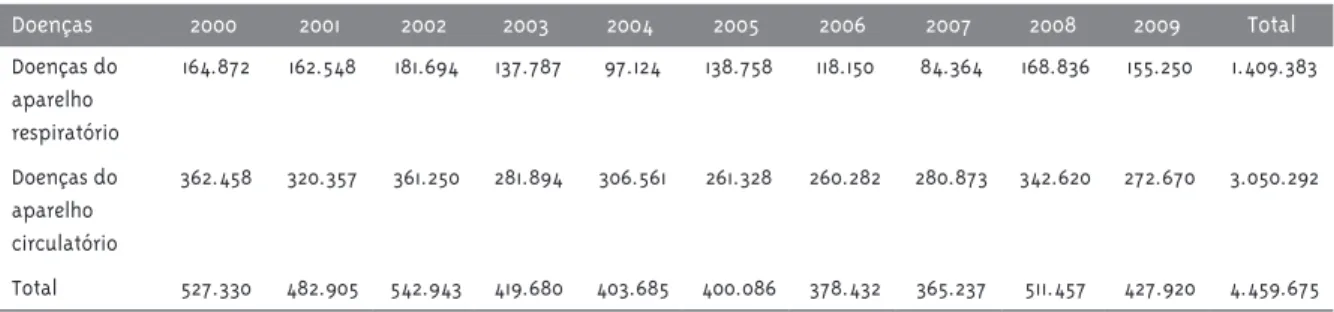
Tabela 7 - Cubatão - Custo de dias perdidos no trabalho (R$) Período:2000-2009
Doenças 2000 2001 2002 2003 2004 2005 2006 2007 2008 2009 Total
Doenças do aparelho respiratório
164.872 162.548 181.694 137.787 97.124 138.758 118.150 84.364 168.836 155.250 1.409.383
Doenças do aparelho circulatório
362.458 320.357 361.250 281.894 306.561 261.328 260.282 280.873 342.620 272.670 3.050.292
Total 527.330 482.905 542.943 419.680 403.685 400.086 378.432 365.237 511.457 427.920 4.459.675
Fonte: http://sistema.saude.sp.gov.br/tabnet/tabnet.exe?sim.def e IBGE * População entre 14 e 70 anos
** Rendimento médio efetivo mensal real, a preços de janeiro de 2010/30 dias. Tal rendimento médio foi multiplicado por 102,6%, segundo estudo de Pastore, citado por CNI (1998)
concentrated on respiratory and cardiovascular morbidity) to the value of the missed working days due to the disease, which was based on the average salaries (Table 7). Based on such premises and data, we arrived at the total cost of R$ 22.1 million.
Total cost of the circulatory and respiratory di-seases
Based on the surveyed data, we arrived at the total value of R$ 22.1 million spent in the period from 2000 to 2009 due to the diseases of the circulatory and respiratory systems (Table 8). The respiratory diseases accounted for costs of R$ 8.3 million, while the costs of the circulatory diseases were R$ 13.9 million.
It should be highlighted that when the total costs were discounted to present value, they showed a slight deceleration in relation to the beginning of the decade, a fact that was also demonstrated by the decreasing trend in the number of hospitalizations due to respiratory causes. In 2000, R$ 2.57 million
were spent per year, while this value was reduced to R$ 2.15 million in 2009.
Estimating the economic cost of pollution
The presented costs, related to circulatory and res-piratory diseases in the municipality of Cubatão, represent an expressive sum and had a decreasing trend in the last 10 years. Nevertheless, it is impor-tant to highlight that the economic costs associated with air pollution represent only a part of such costs, as even in cities with little or no industrial activity and low volume of vehicle traffic, that is, with low rate of pollutant emission, records of cases of such diseases and their inherent costs are verified.
Tabela8 - Cubatão - Custo total associado às doenças dos aparelhos respiratório e circulatório (R$) Período:2000-2009
Doenças 2000 2001 2002 2003 2004 2005 2006 2007 2008 2009 Total
Doenças do aparelho respiratório
- Gastos hospitalares totais
822.878 868.159 795.827 735.337 604.694 559.554 608.152 549.558 624.586 702.180 6.870.925
- Custo de dias perdidos
164.872 162.548 181.694 137.787 97.124 138.758 118.150 84.364 168.836 155.250 1.409.383
- Total 987.750 1.030.708 977.520 873.124 701.818 698.311 726.302 633.923 793.422 857.430 8.280.308 Doenças do aparelho circulatório
- Gastos hospitalares totais
1.220.599 1.001.733 1.177.156 1.289.564 1.099.421 1.194.512 962.244 858.156 1.056.977 1.020.310 10.880.673
- Custo de dias perdidos
362.458 320.357 361.250 281.894 306.561 261.328 260.282 280.873 342.620 272.670 3.050.292
- Total 1.583.057 1.322.090 1.538.405 1.571.457 1.405.982 1.455.841 1.222.525 1.139.029 1.399.598 1.292.979 13.930.964 Total geral 2.570.807 2.352.798 2.515.926 2.444.581 2.107.800 2.154.152 1.948.827 1.772.952 2.193.020 2.150.409 22.211.273
Fonte:http://sistema.saude.sp.gov.br/tabnet/tabnet.exe?sim.defeIBGE *Populaçãoentre14e70anos
**Rendimentomédioefetivomensalreal,apreçosdejaneirode2010/30dias.Talrendimentomédiofoimultiplicadopor102,6%,segundoestudodePastore,citadoporCNI(1998) ***Valoresdeflacionadosatéjan/2010,peloIPCA-IBGE
****Totaldegastoshospitalares+custosdediasperdidoscominternaçõesdevidoàsdoenças
predominant economic activity are the services; the other, Peruíbe, is a little farther and also has low in-dustrial activity compared to Cubatão. All three are coastal municipalities and were selected to control for the climate factor.
The per capita expenses related to hospitaliza-tions due to respiratory and circulatory problems were calculated. In 2000, the per capita expense with hospitalizations due to circulatory diseases in Cubatão was R$ 10.82 per inhabitant. In Guarujá it was R$ 8.48 and in Peruíbe, it was much lower (R$ 4.70). From 2007 onwards, however, this rela-tionship was reversed and Peruíbe started to have an average per capita expense that was higher than that of Cubatão (in 2009, it was R$ 10.58, compared to R$ 7.69 of Cubatão). Nevertheless, regarding the average of the last 10 years, the per capita expense in Cubatão was higher than that of the two other cities (Graph 8).
The same relationship can be observed in re-lation to hospitalizations due to diseases of the respiratory system. In 2000, while Cubatão had an average per capita expense of R$ 7.30, in Peruíbe
this value was of R$ 4.06 and in Guarujá, it reached R$ 6.46. Generally speaking, the expenses gradually decreased during the decade and, in 2007, Peruíbe started to present a value that was higher than that of Cubatão. Concerning the average of the last 10 years, the per capita expense in Cubatão is still higher than that of the two other municipalities, as shown in Graph 9.
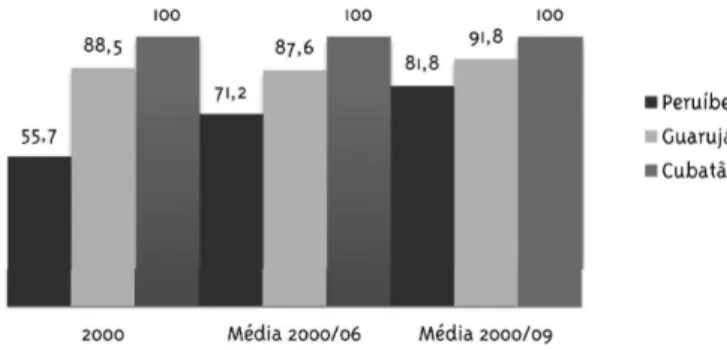
Another way of observing the evolution of the per capita expenses due to the two diseases is by verifying the proportion of each municipality in re-lation to the municipality under focus. In 2000, the per capita expense due to diseases of the circulatory system in Peruíbe represents only 43% of what was verified in Cubatão, while in Guarujá it represen-ted 78%. Between 2000 and 2006, this difference gradually decreased and Peruíbe reached 71% and Guarujá, 88%. Regarding the average of the last 10 years, there was an even higher decrease, with Peruíbe reaching a per capita expense equivalent to 86% of that of Cubatão, while the one of Guarujá was of 94% (Graph 10).
di-Gráfico 8 - Gasto per capita com internações relacionadas a doenças do aparelho circulatório (R$)
Gráfico 9 - Gasto per capita com internações relacionadas a doenças do aparelho respiratório (R$)
Gráfico 10 - Gasto per capita relacionado às doenças do aparelho circulatório (Cubatão=100) Fonte: http://sistema.saude.sp.gov/tabnet
Fonte: http://sistema.saude.sp.gov/tabnet
fference between Peruíbe and Guarujá compared to Cubatão has also been decreasing but, on the average of the period 2000 to 2009, the per capita expenses related to respiratory hospitalizations, comparatively, were of 82% and 92%, respectively. Graph 11 shows these proportions.
These differences in relation to the city of Cuba tão can be attributed to the greater emission of pollutants (deduced from its larger industrial activity). Based on estimates, the lowest indexes that were verified were applied (namely, for Peruí-be, 86% for diseases of the circulatory system and 82% for diseases of the respiratory system), as a discount factor for the costs of Cubatão. The costs associated with pollution would be: 14% for diseases of the circulatory system and 18% for diseases of the respiratory system. Based on the previous item, the costs of pollution, in Cubatão, measured by their impacts based on hospitalizations, calculated from statistics of the SUS, were of R$ 3.44 million between 2000 and 2009.
Discussion and Conclusions
We observed, in the figures surveyed from 2000 to December 2009, a clear trend of decline in the number of hospitalizations occurred in the city of Cubatão. From 2000 to 2009, 8,799 hospitalizations due to respiratory diseases were registered in the Sistema de Informação Hospitalar (SIH-SUS – Hospi-tal Information System), and the majority (56.6%) of
Gráfico 11 - Gasto per capita relacionado às doenças do aparelho respiratório (Cubatão=100)
Fonte: http://sistema.saude.sp.gov/tabnet
the patients was of the male sex. The hospitalization rate decreased from 1,162 hospitalizations per 100 thousand inhabitants to 469 in 2009, that is, it was reduced by 2.5 times. This decrease in the number of hospitalizations may be related to the greater control of air pollution in recent years and to the better resolvability of the cases of the disease before the need of hospitalization.
The rate is higher for the group of children younger than five years, followed by the group of individuals older than 60 years. From 2000 to 2009, the decrease in the number and rate of hospitaliza-tions occurred predominantly in children younger than five years. And there is a trend of decline in the coming years.
The rate of mortality by respiratory diseases has remained constant, revolving around 60 deaths/100 thousand inhabitants. However, the most affected age groups were those of individuals older than 50 years and children younger than 1 year. It is im-portant to highlight that, from 2000 to 2009, the decrease was of almost five times among children younger than 1 year.
in the methodology. The costs per outpatient clinic assistances and per treatments performed at home were also not surveyed, as these data were not avai-lable. The costs of diseases of people who do not resort to the Brazilian National Health System for treatment were also not surveyed, due to the same reasons.
Therefore, it is recommended to the health sector that efforts are undertaken so as to amplify the collection, systematization and availability of assistance data, in order to enhance the knowledge of the impacts on health and on the deriving costs, enabling to take positions and to define more con-sistent policies and programs.
References
ANDERSON, H. R. et al. Air pollution and daily mortality in London: 1987-92. British Medical Journal, London, v. 312, p. 665-9, 1996.
COMPANHIA AMBIENTAL DO ESTADO DE SÃO PAULO. Qualidade do ar no Estado de São Paulo 2010. São Paulo: CETESB, 2011. Disponível em: http://www.cetesb.sp.gov.br/ar/qualidade-do-ar/31-publicacoes-e-relatorios. Acesso em: 12 mar. 2011.
DAUMAS, R. P.; MENDONÇA, G. A. S.; PONCE-DE-LEÓN, A. P. de. Poluição do ar e mortalidade em Idosos no município do Rio de Janeiro: análise de série temporal. Cadernos de Saúde Pública, Rio de Janeiro, v. 20, n. 1, p. 311-9, fev. 2004.
DELUCCHI, M. A. Environmental externalities of motor vehicle use in the US. Journal of Transport Economics and Policy, Claverton Down, v. 34, p. 135-68, 2000.
DELUCCHI, M.; McCUBBIN, D. R.; MURPHY, J. The health and visibility cost of air pollution: a comparison of estimation methods. Journal of Environmental Management, Berkeley, v. 64, p. 139-52, 2002.
DESQUEYROUX, H.; MOMAS, I. Pollution atmosphérique et santé: une synthèse des études longitudinales de panel publiées de 1987 a 1998. Revue d’Epidemiologie et de Sante Publique, Issy les Moulineaux, v. 47, p. 361-75, 1999.
GANGADHARAN, L.; VALENZUELA, R. Interrelationship between income, health and environment: Extendy the environmental Kuznets Curve hypothesis. Ecological Economics, Hanover, v. 36, p. 513-35, 2001.
GARBER R, A. M.; PHELPS, C. E. Economics foundations of cost-effectiveness analysis. Journal of Health Economics, York, v. 16, p. 1-31, 1997.
GARBER, A. M. et al. Theoretical foundations of cost-effectiveness analysis. In: GOLD, M. R. et al. Cost-effectiveness in health and medicine. Oxford: Oxford University Press, 1996.
GOUVEIA N.; FLETCHER, T. Respiratory diseases in children and outdoor air pollution in Sao Paulo, Brazil: a time series analysis. Journal of Occupational and Environmental Medicine, Chicago, v. 57, p. 477-83, 2000.
KRUPNICK, A. et al. The value of health benefits from ambient air quality improvements in central and Eastern Europe: an exercise in benefit transfer. Environmental and Resource Economics, Washington , v. 7, n. 4, p. 307-22, 1996.
McCUBBIN, D. R.; DELUCCHI, M. A. The health costs of motor vehicle related air pollution. Journal of Transport Economics and Policy, Claverton Down, v. 33, p. 253-86, 1999.
MOMAS, I. et al. Urban atmospheric pollution and mortality: analysis of epidemiological studies published between 1980 and 1991. Revue d’Epidemiologie et de Sante Publique, Issy les Moulineaux, v. 41, p. 30-43, 1993.
MURPHY, J. J.; DELUCCHI, M. A. A review of the literature on the social cost of motor vehicle use. Journal of Transportation and Statistics, Washington, v. 1, p. 15-42, 1998.
OSTRO, B. Estimating the health effects of air pollutants: a method with an application to Jakarta. Policy Research Working Paper 1301. New York: The World Bank, 1998.
PEARCE, D.; MARKANDYA, A. An appraisal of the economic value of environmental improvement and the economic cost of environmental damage. London: University College of London. Department of Economics, 1987. (Internal paper).
POLONIECKI, J. D. et al. Daily time series for cardiovascular hospital admissions and previous day’s air pollution in London, UK. Journal of Occupational and Environmental Medicine, Chicago, v. 54, p. 535-40, 1997.
QUAH, E.; BOON, T. L. The economic cost o fair pollution on health in Singapore. Journal of Asian Economics, Bologna, v. 14, p. 73-90, 2003.
SCHWARTZ, J. Air pollution and daily mortality: a review and meta analysis. Environ Res, Maryland Heights, v. 64, p. 36-52, 1994.
SEROA DA MOTTA, R.; MENDES, A. P. Custos da saúde associados à poluição de ar no Brasil. Pesquisa e Planejamento Econômico, Rio de Janeiro, v. 25, n. 5, abr. 1995.
SEROA DA MOTTA, R. Contabilidade ambiental: teoria, metodologia e estudos de casos no Brasil, Rio de Janeiro: Instituto de Pesquisa Econômica Aplicada, 1995.
SUNYER, J. et al. Urban air pollution and emergency admissions for asthma in four European cities: the APHEA Project. Thorax, London, v. 52, p. 760-5, 1997.
TOULOMI, G.; SAMOLI, E.; KATSOUYANNI, K. Daily mortality and “winter type” air pollution in Athens, Greece a time series analysis within the APHEA project. Journal of Epidemiology & Community Health, London, v. 50, p. 47-51, 1996. Suplemento.
WORLD HEALTH ORGANIZATION. Air quality guidelines for particulate matter, ozone, nitrogen dioxide and sulfur dioxide: global update 2005. Geneva: WHO, 2005.
ZANOBETTI, A.; SCHWARTZ, J.; DOCKERY, D. W. Airborne particles are a risk factor for hospital admissions for heart and lung disease. Environ Health Perspect, North Carolina, v. 108, p. 1071-7, 2000.
Errata
Correction
v. 21, n. 3
p. 760-775 - Jul. - Set. 2012
p. 760-775 - July - September 2012
Na página 768, substituir tabela três por:
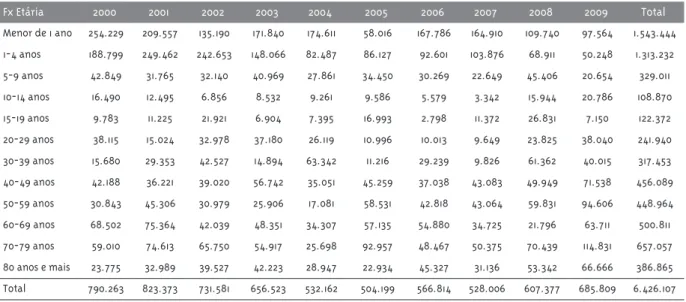
On page 768, substitute table 3 for:
Tabela 3 - Internações - Valor Total pago pelo SUS, a preços de janeiro de 2010*
CID10 Capítulos: X. Doencas do aparelho respiratorio Período:2000-2009
Fx Etária 2000 2001 2002 2003 2004 2005 2006 2007 2008 2009 Total
Menor de 1 ano 254.229 209.557 135.190 171.840 174.611 58.016 167.786 164.910 109.740 97.564 1.543.444
1-4 anos 188.799 249.462 242.653 148.066 82.487 86.127 92.601 103.876 68.911 50.248 1.313.232
5-9 anos 42.849 31.765 32.140 40.969 27.861 34.450 30.269 22.649 45.406 20.654 329.011
10-14 anos 16.490 12.495 6.856 8.532 9.261 9.586 5.579 3.342 15.944 20.786 108.870
15-19 anos 9.783 11.225 21.921 6.904 7.395 16.993 2.798 11.372 26.831 7.150 122.372
20-29 anos 38.115 15.024 32.978 37.180 26.119 10.996 10.013 9.649 23.825 38.040 241.940
30-39 anos 15.680 29.353 42.527 14.894 63.342 11.216 29.239 9.826 61.362 40.015 317.453
40-49 anos 42.188 36.221 39.020 56.742 35.051 45.259 37.038 43.083 49.949 71.538 456.089
50-59 anos 30.843 45.306 30.979 25.906 17.081 58.531 42.818 43.064 59.831 94.606 448.964
60-69 anos 68.502 75.364 42.039 48.351 34.307 57.135 54.880 34.725 21.796 63.711 500.811
70-79 anos 59.010 74.613 65.750 54.917 25.698 92.957 48.467 50.375 70.439 114.831 657.057
80 anos e mais 23.775 32.989 39.527 42.223 28.947 22.934 45.327 31.136 53.342 66.666 386.865
Total 790.263 823.373 731.581 656.523 532.162 504.199 566.814 528.006 607.377 685.809 6.426.107