439
Rev Soc Bras Med Trop 50(4):439-449, July-August, 2017 doi: 10.1590/0037-8682-0170-2016
Review Article
Corresponding author: Msc. Cláuffer Luiz Machado Silva
e-mail: [email protected]
Received 13 August 2016
Accepted 23 June 2017
Spatial distribution of leprosy in Brazil: a literature review
Cláufer Luiz Machado Silva
[1],
Sandra Costa Fonseca
[1],Helia Kawa
[1]and Dayanna de Oliveira Quintanilha Palmer
[2][1]. Programa de Pós-Graduação em Saúde Coletiva, Instituto de Saúde Coletiva, Universidade Federal Fluminense, Niterói, RJ, Brasil. [2]. Faculdade de Medicina, Universidade Federal Fluminense, Niterói, RJ, Brasil.
Abstract
Leprosy remains a public health problem in developing countries. Among communicable diseases, it is one of the leading
causes of permanent disability. Brazil had not reached the goal of reducing cases to less than 1 per 10,000 population.
This study aimed to analyze the spatial distribution of leprosy cases in Brazil, using a literature review. The search strategy
included the LILACS and MEDLINE databases with no language or period restriction. Ecological studies with spatial data
analysis were considered as a criterion for the inclusion. We found 38 studies for review after the selection criteria. Among the
epidemiological indicators of the disease, the most common was the new case detection rate. Several articles have explored
the association between spatial distribution of leprosy and socioeconomic, demographic, and environmental factors. The most
common unit of analysis was the municipality. The spatial distribution methods mostly used were: empirical Bayesian method,
autocorrelation (Moran’s I index) and Kernel estimates. The distribution of leprosy was very heterogeneous, independent of
t h e unit of analysis. There was a decrease in the rate of detection and among under-15-year-olds, but some regions maintained
high endemicity during the study period. The distribution and risk of illness were directly related to living conditions of the
population. Improved access to health services was associated with increased detection rate in some regions. Spatial
analysis seems to be a very useful tool to study leprosy and to guide interventions and surveillance.
Keywords:
Leprosy. Brazil. Spatial analysis. Review.
INTRODUCTION
Leprosy is still a public health problem in low and
middle-income countries. It is a leading cause of permanent disability
and social stigma
1, and stands out as one of the neglected
infectious diseases in those countries. Despite the magnitude
and impact on health, leprosy has little investment regarding
therapeutic research and development
2,3.
Economic, political, social, and demographic changes
that occurred during the last 40 years in Brazil impacted the
social determinants of health in the country
4. Consequently,
the incidence of infectious diseases declined, but the impact
on leprosy is not yet fully clear
5,6. Studies point out that
cash transfer policies were related to the decrease in disease
incidence, while the expansion of the Family Health Care
Strategy improved t h e detection of new cases
6,7.
In 2015, 28,761 new cases were reported, corresponding to a
case detection rate (CDR) of 14.07/100,000 inhabitants, which
is considered high. Brazil is about to reach the World Health
Organization’s target of control, but 535 municipalities are still
classiied as hyperendemic, with CDRs higher than 40/100,000
inhabitants
8. The geographical distribution of leprosy is uneven
and the disease persists in regions with higher levels of poverty
and malnutrition, showing a close relationship with precarious
conditions of living, low educational level, social inequality,
and also with migratory movements
9,10.
To best understand the differences in the distribution of
infectious diseases, ecological studies with spatial data analysis
have increased during the past 30 years in Brazil
11. Different
spatial scales were taken into account, usually with geographic
and administrative references, such as states and administrative
districts. Other potential spatial units of data aggregation are
the census sector, neighborhood, hydrographical basin, and
sanitary district
12.
In this context, we reviewed the spatial distribution of leprosy
and methods used for spatial analysis in Brazil, according to
different scales, and its relationship with demographic and
socioeconomic factors.
METHODS
We performed a literature review, according to the
recommended steps for systematic reviews, except for
quantitative analysis (meta-analysis)
13.
440
Silva CLM et al. - Spatial distribution of leprosy in Brazil
(LILACS) and Medical Literature Analysis and Retrieval
System ( MEDLINE) databases. In the LILACS database
we combined the descriptors
Spatial Analysis, Analysis
by Conglomerates, Spatial Distribution of the Population,
Ecological Study, Geographic Information System
, with
leprosy
and
Brazil
, using the Boolean operator
AND
. Each combination
was done separately, as the system did not accept merging the
syntax terms with the operator
OR
.
In t h e MEDLINE database, we used the syntax
leprosy
AND (
Spatial Analysis
OR
Cluster Analysis
OR
Residence
Characteristics
OR
Ecological Studies
OR
Geographic
Information Systems
) AND
Brazil
.
There was no restriction on language or publication period.
The lists of references in the identified articles were
s e a r c h e d to identify items not captured in the electronic
search. The search was conducted in 2015 and updated in
March 2016.
The paired review system was used in the selection of
articles; two researchers evaluated the titles to be included
in the abstracts to be read. At least one author approved the
titles to increase the sensitivity at this stage. After reading the
abstracts of the articles, those approved by both authors were
included to be read in full. When there were divergent views,
a third researcher read the summary to give an opinion before
exclusion.
Ecological studies with spatial data analysis were included
in the study; those articles not assessing the spatial distribution
of the disease were excluded.
RESULTS
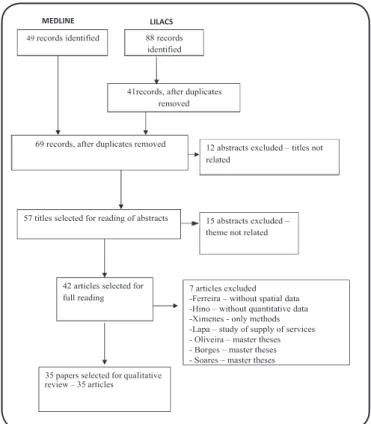
Using the established bibliographical review criteria, 35
studies were selected (
Figure 1
): 35 articles.
Table 1, Table 2
and
Table 3
show the articles’
summaries according to the scale used: two evaluated regions/
mesoregions
14,15; 13 used the scale of municipalities
10,16-27; 4
evaluated districts
28-31; 6 studied neighborhoods
32-37; 7 analyzed
the census tracts
38-44; and 3 investigated households
45-47. Within
each scale, the articles were organized by location: Brazil,
Northern, Northeast, Midwest, and Southeast regions. In all,
4 approached Brazil
10,16-18, 7 studied the Northern region or
the states of the Amazon region
14,19,20,38-40,45, 11 focused on the
Northeast region
21-23,28,32-36,40,41, 4 the Midwest region
15,29,37,46, and
12 the Southeast region
24-27,30,31,36,37,42-44,47.
As a data source for the cases of leprosy, the Notiiable
Diseases Information System (SINAN) was hegemonic, and
among the epidemiological disease indicators, the most widely
used was the new case detection rate (NCDR) in the population
without distinction by age group. Seven studies
10,19,20,23,32,33,36,38evaluated the NCDR indicator of individuals under 15 years
of age, 3 evaluated the disability-degree indicator
19,20,22and
one article explored the spatial distribution of mortality due
to leprosy
18.
Some studies showed descriptive data of spatial distribution,
while others looked into socioeconomic, demographic
and environmental conditions that could contribute to the
MEDLINE LILACS
35 papers selected for qualitative review – 35 articles
FIGURE 1 - Flow diagram of studies selected.
understanding of t h e spatial distribution of leprosy. The
socioeconomic variables mostly evaluated were income,
education, sanitation conditions, number of residents per house
– individually or as composite indicators, such as the social
deprivation index
42. For these indicators, the most used data
source was the Brazilian Institute of Geography and Statistics
(IBGE). Two of the articles used the Gini index
17,23as a measure
of inequality. Regarding demographic conditions, population
density was studied (on the scales of neighborhoods and census
sectors), as well as the level of urbanization. The distance
between households was also studied, and as an environmental
condition, deforestation was evaluated in two articles
14,15.
The most commonly used methods of spatial analysis were
the following: empirical Bayesian method, autocorrelation
(Moran index) to verify the existence of spatial conglomerates
(clusters), and Kernel estimates to show areas with greater
intensity (hot spots). Kriging methods and scan tests were
also used. The two studies
14,15that covered mesoregions and
microregions have shown a correlation between the evolution
of deforestation and an increase in NCDR, besides the effect of
migration movements on coeficients of detection and focuses
(new and old) of the disease.
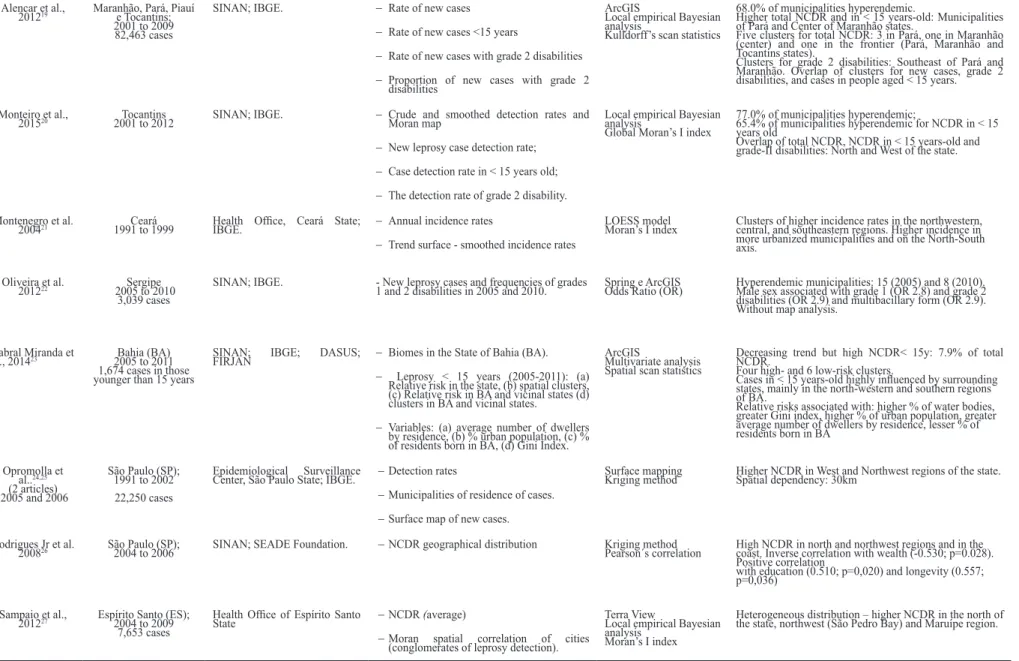
In t h e a n a l y s e s b y municipalities, three studies
examined the N CDR of the country at different moments in
time
10,16,17, and showed concentration in the North and Midwest
regions, and in the Northeastern states located in Legal
Amazon. The study by Freitas et al.
17looked at risk factors,
estimated rate ratios (RR), and identiied a high NCDR in
4
4
1
Author/year Local/year of study/ sample
size
Data source Maps Analysis Results
Unit of analysis: meso-regions and micro-regions
Silva et al.
201014 Amazon Region2006 SINAN; IBGE; INPE; PNUD. − Distribution of new leprosy cases
− Distribution of indicators
Local empirical Bayesian analysis
Kernel technique Pearson´s correlation
NCDR positively correlated with deforested area (0.50) and septic tank (0.46), inversely correlated with HDI (-0.36).
Magalhães et al.
201115 1960 to 2006Mato Grosso ATDS; SINAN; IBGE; Department of Planning of Mato
Grosso.
− Population growth rates of micro-regions in the 90’s/ detection rates 2004-2006.
− Attraction degree and effective migratory participation 1970-2000/ detection rates
Not detailed Greatest NCDR in meso-regions North, Northeast e Southwest of the state. Progression of deforestation coinciding with NCDR elevation.
Migration explaining appearance and evolution of leprosy.
Unit of analysis: municipalities
Magalhães & Rojas. 200710
Brazil; 1998 to 2000 and 2000
to 2002 47,026 cases
SINAN; IBGE; SIGEpi − NCDR;
− NCDRin people younger than 15 years;
− Mean percentage of new cases with tuberculoid presentation
ArcView Higher NCDR - capitals and metropolises (Manaus, Roraima e Belém). Focal distribution in east/west Amazon. Concentration on Atlantic coast (RJ and Recife) and metropolitan regions of Vitória, ES. Association of high social exclusion and high NCDR (Sergipe, Piauí, Maranhão and Amazonas).
Penna et al.,
200916 2005 to 2007Brazil
65.357 cases
SINAN; IBGE. − 10 leprosy clusters Spatial scan statistics
Poisson model Five clusters in Amazon region and another three contiguous regions. One cluster in Metropolitan Recife and other in the joint region of Minas Gerais northeast, extreme south of Bahia and north of Espirito Santo.
Freitas et al.
201417 2009 to 2011Brazil SINAN; IBGE − Mean smoothed NCDR per 100,000 inhabitants, 2009-2011. ArcGISLocal empirical Bayesian
analysis
Hierarchical Multivariate analysis
Factors for high NCDR (values of IRR): Center-West (4.62) and North (3.14) regions, metropolises (I1.92), urbanization rate (1.53), median/ high illiteracy rate (2.41/2.15), Gini index> 0.55 (1.26), high number of dwellers/room (1.41) and inadequate sanitation (1.63).
Martins-Melo et al. 201518
Brazil
2000 to 2011 SIM; IBGE − Average annual age-adjusted leprosy-related mortality rates
− Average annual crude mortality rates
− Average annual Bayesian-smoothed mortality rates
− LISA cluster analysis (Moran Map)
− Scan space-time clusters analysis
Local empirical Bayesian analysis
Global Moran’s I index LISA
Kulldorff’s space-time scan statistics
Most clusters for mortality: Center-West, North, and west of Northeast regions. Secondary cluster: northwest of Paraná state and frontier of Minas Gerais and Espirito Santo states.
Factors for higher mortality: male sex (RR=2.57); age (gradient); black color (RR=1.65) Center-West (RR=2.84) and North (RR=2.04) regions.
Decreasing trend of leprosy-related mortality. TABLE 1
Studies on spatial distribution of leprosy in Brazil, 1995 – 2015, by Meso-Regions, Micro-Regions, and Municipalities.
Continue...
R
e
v
S
o
c
B
ra
s
M
e
d
T
ro
p
5
0(
4
):43
9
-4
49
, J
u
ly
-A
u
gu
st
, 2
01
4
4
2
Alencar et al.,
201219 Maranhão, Pará, Piauí e Tocantins;
2001 to 2009 82,463 cases
SINAN; IBGE. − Rate of new cases
− Rate of new cases <15 years
− Rate of new cases with grade 2 disabilities
− Proportion of new cases with grade 2 disabilities
ArcGIS
Local empirical Bayesian analysis
Kulldorff’s scan statistics
68.0% of municipalities hyperendemic.
Higher total NCDR and in < 15 years-old: Municipalities of Pará and Center of Maranhão states.
Five clusters for total NCDR: 3 in Pará, one in Maranhão (center) and one in the frontier (Pará, Maranhão and Tocantins states).
Clusters for grade 2 disabilities: Southeast of Pará and Maranhão. Overlap of clusters for new cases, grade 2 disabilities, and cases in people aged < 15 years.
Monteiro et al.,
201520 2001 to 2012Tocantins SINAN; IBGE. − Crude and smoothed detection rates and Moran map
− New leprosy case detection rate;
− Case detection rate in < 15 years old;
− The detection rate of grade 2 disability.
Local empirical Bayesian analysis
Global Moran’s I index
77.0% of municipalities hyperendemic;
65.4% of municipalities hyperendemic for NCDR in < 15 years old
Overlap of total NCDR, NCDR in < 15 years-old and grade-II disabilities: North and West of the state.
Montenegro et al.
200421 1991 to 1999Ceará Health Ofice, Ceará State; IBGE. − Annual incidence rates
− Trend surface - smoothed incidence rates
LOESS model
Moran’s I index Clusters of higher incidence rates in the northwestern, central, and southeastern regions. Higher incidence in more urbanized municipalities and on the North-South axis.
Oliveira et al.
201222 2005 to 2010Sergipe
3,039 cases
SINAN; IBGE. - New leprosy cases and frequencies of grades
1 and 2 disabilities in 2005 and 2010. Spring e ArcGISOdds Ratio (OR) Hyperendemic municipalities: 15 (2005) and 8 (2010). Male sex associated with grade 1 (OR 2.8) and grade 2 disabilities (OR 2.9) and multibacillary form (OR 2.9). Without map analysis.
Cabral Miranda et
al., 201423 2005 to 2011Bahia (BA)
1,674 cases in those younger than 15 years
SINAN; IBGE; DASUS;
FIRJAN − Biomes in the State of Bahia (BA).
− Leprosy < 15 years (2005-2011): (a) Relative risk in the state, (b) spatial clusters, (c) Relative risk in BA and vicinal states (d) clusters in BA and vicinal states.
− Variables: (a) average number of dwellers by residence, (b) % urban population, (c) % of residents born in BA, (d) Gini Index.
ArcGIS
Multivariate analysis Spatial scan statistics
Decreasing trend but high NCDR< 15y: 7.9% of total NCDR.
Four high- and 6 low-risk clusters.
Cases in < 15 years-old highly inluenced by surrounding
states, mainly in the north-western and southern regions of BA.
Relative risks associated with: higher % of water bodies, greater Gini index, higher % of urban population, greater average number of dwellers by residence, lesser % of residents born in BA
Opromolla et al..24,25
(2 articles) 2005 and 2006
São Paulo (SP); 1991 to 2002 22,250 cases
Epidemiological Surveillance
Center, São Paulo State; IBGE. − Detection rates
− Municipalities of residence of cases.
− Surface map of new cases.
Surface mapping
Kriging method Higher NCDR in West and Northwest regions of the state.Spatial dependency: 30km
Rodrigues Jr et al.
200826 São Paulo (SP);2004 to 2006 SINAN; SEADE Foundation. − NCDR geographical distribution Kriging methodPearson´s correlation High NCDR in north and northwest regions and in the coast. Inverse correlation with wealth (-0.530; p=0.028).
Positive correlation
with education (0.510; p=0,020) and longevity (0.557; p=0,036)
Sampaio et al.,
201227 Espírito Santo (ES);2004 to 2009
7,653 cases
Health Ofice of Espírito Santo
State − NCDR (average)
− Moran spatial correlation of cities (conglomerates of leprosy detection).
Terra View
Local empirical Bayesian analysis
Moran’s I index
Heterogeneous distribution – higher NCDR in the north of the state, northwest (São Pedro Bay) and Maruípe region.
ATDS: Technical Area – Sanitary Dermatology; NCDR: case detection rate; CDSSES-MG: Sanitary Dermatology Coordination of State Ofice of Health, Minas Gerais; CP: Prevalence coeficient; FIDEM: Metropolitan Developing Foundation; GEIPMBH: Epidemiology and Information Ofice of Municipality of Belo Horizonte; GIS: Geographical Information Systems; HDI: Human Development Index; IBGE: Brazilian Institute of Geography and Statistics; IRR: Incidence rate ratio; LISA: Local Index of Spatial Association; LOESS: locally weighted scatterplot smoothing; PCR: polymerase chain reaction; RR: rate ratio; SEADE: State Data Analysis System Foundation; SIGEpi: Geographical Information in Epidemiology System; SIM: Mortality Information System; SMS: Municipal Ofice of Health; SINAN: Brazilian Disease Surveillance System. To homogenize results, we described NCDR for 100,000 inhabitants and CP for 10,000 inhabitants.
TABLE 1 - Continuation. Silva
C
L
M
e
t
a
l.
S
p
a
ti
a
l d
is
tr
ib
u
ti
o
n
o
f
le
p
ro
sy
in
B
ra
z
4
4
3
Author/year Local/year of study/sample
size
Data source Maps Analysis Results
Unit of analysis: districts
Lima et al., 2015 28
Fortaleza (CE) 2009 to 2010
185 cases
Dona Libânia National Reference Centre for Sanitary Dermatology
− Spatial kernel density of speciic repetitive
element – RLEP/PCR positive nasal samples
− Leprosy cases with positive bacilloscopy index and RLEP, PCR on nasal samples (positive/ negative)
ArcGIS and ArcMap Spatial Analyst extension Kernel density estimation
Cases and controls concentrated in the southwest and western (lower socioeconomic level), External group (no cases) - clusters in northeast region (wealthier area). Factor associated (OR): age (1.04), male (6.24) social class D/E (3.34), and previous contact with a leprosy case (3.86). No association with RLEP (+).
Martelli et al. 199529
Goiânia 1991-1992 711 cases (complete
information)
Local surveillance system − Spatial distribution according to risk strata Risk ratios (RR) estimation
Cases in 86% of districts. Approximately 83% of the population in intermediate and high-risk areas.
Higher NCDR: low socioeconomic level (RR=5.3) and outskirts of the city.
Sampaio et al.30, 31,
2013a and b
Vitória (ES); 2005 to 2009 379 cases
SINAN; IBGE; Geo-Foundations. − Mean and smoothed NCDR
− Moran’s spatial correlation
− Urban Quality Index
Terra View
Local and global empirical Bayesian analysis - LISA
Higher NCDR on northwest of the city, North and in the continental region. Higher NCDR in areas with low Urban Quality Index
Unit of analysis: neighborhoods
Souza et al., 200132
Recife (PE) 1993 to 1997
799 cases < 15 years
SINAN; IBGE. Maps (Arcview/SPLUS):
− NCDR in < 15 years-old
− Corrected NCDR in < 15 years-olds
− Difference between observed and expected cases; multibacillary cases.
Local empirical Bayesian analysis
Cases < 15 years-old: 17.3% of total NCDR
Crude spatial distribution: irregular pattern: high NCDR neighborhoods next to low ones. Range: 0 to 1,440 cases/100,000. Smoothed spatial distribution: Three high NCDR areas with high demographic density and low living conditions.
Dias et al. 200533
and 200734
Mossoró (RN) 1998 to 2002 281 geo-referred
(78.5%) 2005 - 30 new cases
SINAN and registration books from municipal administration; ENGESAT
− New leprosy cases
− Density map of new cases in the area of greater occurrence
− New leprosy cases in < 15 years old
− Areas of case-inding campaigns
ArcView Georeferencing.
Higher endemicity areas – low socioeconomic level, low sanitary status, high demographic density
Overlap of high NCDR, high NCDR in < 15 years-old and grade 2 disability. Campaigns guided by spatial analysis improved diagnosis of new cases.
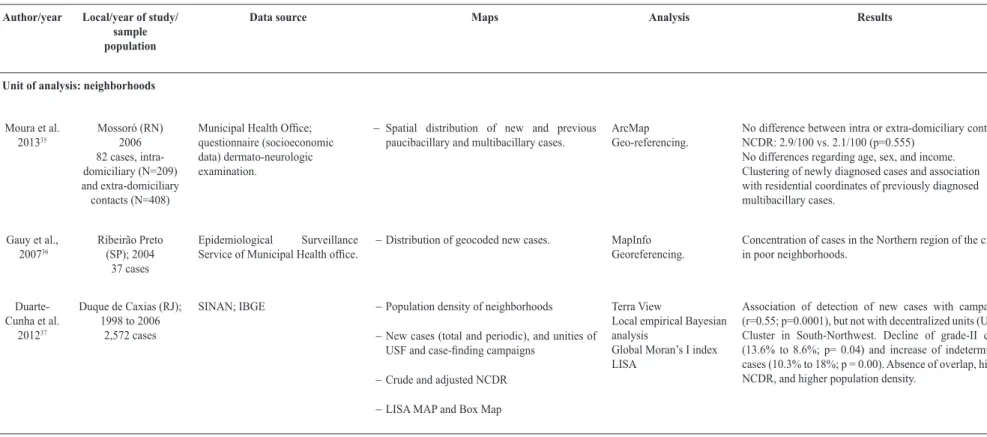
TABLE 2
Studies on spatial distribution of leprosy in Brazil, 1995 – 2015, by districts and neighborhoods.
Continue...
R
e
v
S
o
c
B
ra
s
M
e
d
T
ro
p
5
0(
4
):43
9
-4
49
, J
u
ly
-A
u
gu
st
, 2
01
4
4
4
Author/year Local/year of study/ sample population
Data source Maps Analysis Results
Unit of analysis: neighborhoods
Moura et al. 201335
Mossoró (RN) 2006 82 cases, intra-domiciliary (N=209) and extra-domiciliary contacts (N=408)
Municipal Health Ofice;
questionnaire (socioeconomic data) dermato-neurologic examination.
− Spatial distribution of new and previous paucibacillary and multibacillary cases.
ArcMap Geo-referencing.
No difference between intra or extra-domiciliary contacts: NCDR: 2.9/100 vs. 2.1/100 (p=0.555)
No differences regarding age, sex, and income. Clustering of newly diagnosed cases and association with residential coordinates of previously diagnosed multibacillary cases.
Gauy et al., 200736
Ribeirão Preto (SP); 2004
37 cases
Epidemiological Surveillance
Service of Municipal Health ofice. − Distribution of geocoded new cases. MapInfoGeoreferencing.
Concentration of cases in the Northern region of the city, in poor neighborhoods.
Duarte-Cunha et al.
201237
Duque de Caxias (RJ); 1998 to 2006
2,572 cases
SINAN; IBGE − Population density of neighborhoods
− New cases (total and periodic), and unities of
USF and case-inding campaigns
− Crude and adjusted NCDR
− LISA MAP and Box Map
Terra View
Local empirical Bayesian analysis
Global Moran’s I index LISA
Association of detection of new cases with campaigns (r=0.55; p=0.0001), but not with decentralized units (USF). Cluster in South-Northwest. Decline of grade-II cases (13.6% to 8.6%; p= 0.04) and increase of indeterminate cases (10.3% to 18%; p = 0.00). Absence of overlap, higher NCDR, and higher population density.
CP: prevalence coeficient; GIS: Geographical Information Systems; IBGE: Brazilian Institute of Geography and Statistics; LISA: Local Index of Spatial Association; PCR: polymerase chain reaction; NCDR: case
detection rate; PRODATER: Teresinense Data Processing Company; RLEP: speciic repetitive element; RR: rate ratio; SINAN: Brazilian Disease Surveillance System; USF: Health Family unities. To homogenize results, we described NCDR for 100,000 inhabitants and CP for 10,000 inhabitants.
TABLE 2 - Continuation.
Si
lv
a
C
L
M
e
t
a
l.
S
p
a
ti
a
l d
is
tr
ib
u
ti
o
n
o
f
le
p
ro
sy
in
B
ra
z
4
4
5
Author/year Local/year of study/sample
size
Data source Maps Analysis Results
Unit of analysis: census tracts
Imbiriba et al. 200938
Manaus (AM); 1998 to 2004 4,104 cases in < 15 years old
SINAN and medical records; IBGE
− Mean NCDR (neighborhoods);
− Mean NCDR (sectors)
− Bayesian estimative of mean NCDR.
MapInfo
Local empirical Bayesian analysis
Logistic Regression.
Among sectors, 34% were hyperendemic. Cases < 15 years-old: 10.8% of total NCDR
Intraurban heterogeneity related to social inequities (low living conditions, OR=4.42) and concentration of < 15 years-old cases (OR=2.43).
Barreto et al. 201439
Castanhal (PA) 2004 to 2010 90 cases and 302
contacts. 188 students from 4
public schools
SINAN; IBGE − Kernel density estimation
− Clusters of leprosy (LISA and Kulldorff)
− Surveyed household contacts and school children
− Space-time links: cases/ students
Geocoding
Local empirical Bayesian analysis
Kernel density estimator, LISA, Kulldorff, Ripley’s k-function
Cases < 15 years-old: 10% of total. Close proximity to spatial clusters. Overlap of high NCDR and high population density. Household density higher (p=0.0001) in those residences with individuals affected by leprosy. 81.3% of mapped cases near other cases in space/time
Lapa et al. 200640
Olinda (PE) 1991 to 2000
SINAN; IBGE; FIDEM.
− Disease intensity
− Domain areas of care for each health facility or unit.
Bidimensional Kernel estimation
Changes in domain areas of care.
Increase in the detection, treatment and contacts investigation by the municipalities themselves.
Mencaroni et al., 200442
Fernandópolis (SP); 1997 to 2002 160 cases in the
urban area
SINAN; IBGE; Planning Sector of the Municipality of Femandópolis
− Mean NCDR by census tract
− Social Deprivation Index by census tract
− Collective risk area (merging ICS and NCDR).
SPRING
Cases geocoded by census tract
High-risk area (low or intermediate living conditions and high NCDR): twelve census tracts, comprising 17.6 % of the population.
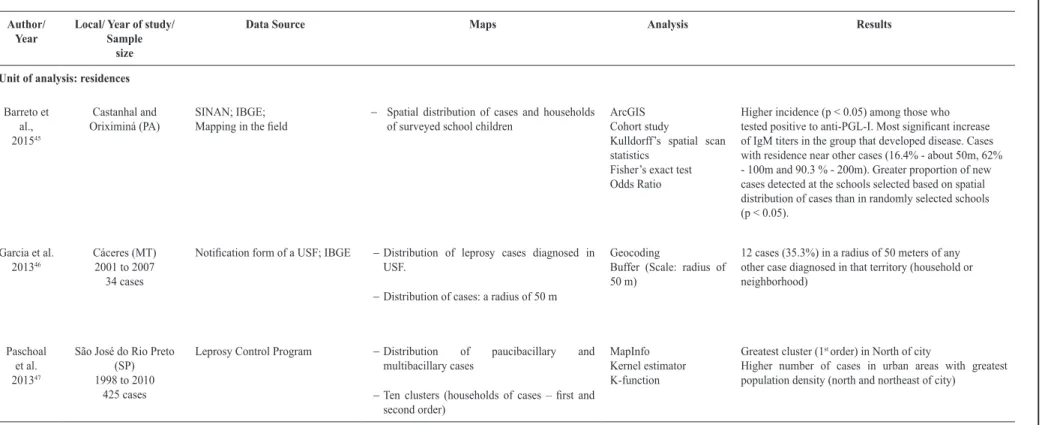
TABLE 3
Studies on spatial distribution of leprosy in Brazil, 1995 - 2015, by census tracts and residences.
Amaral & Lana 200843
Almenara (MG); 1998 to 2006 866 geocoded cases
CDSSES-MG; IBGE; GEIPMBH; SIM
− Mean census tract NCDR
− Census track distribution by NCDR cluster
MapInfo Moran’s I Index Kulldorf’s scan Statisti Poisson model
126 census tracts with at least one case: 86 urban and 40 rural.
Concentration of cases in the center and east of the micro-region.
Cury et al. 201244
São José do Rio Preto (SP) 1998 to 2007 379 geocoded cases
Leprosy Project database; IBGE; São José do Rio Preto Municipality
− Distribution of incidence rates
− Distribution of socioeconomic levels
− Distribution of population density
Choropleth maps (MapInfo, ArcGIS):
Kriging method
Big cluster in the North zone and two smaller clusters in extreme east and southeast, showing a positive association with low socioeconomic levels (p<0.0001) but not with population density.
Disparity between clusters of disease and localization of health units.
Continue...
R
e
v
S
o
c
B
ra
s
M
e
d
T
ro
p
5
0(
4
):43
9
-4
49
, J
u
ly
-A
u
gu
st
, 2
01
4
4
6
Author/ Year
Local/ Year of study/ Sample
size
Data Source Maps Analysis Results
Unit of analysis: residences
Barreto et al., 201545
Castanhal and Oriximiná (PA)
SINAN; IBGE;
Mapping in the ield − Spatial distribution of cases and households of surveyed school children
ArcGIS Cohort study
Kulldorff’s spatial scan statistics
Fisher’s exact test Odds Ratio
Higher incidence (p < 0.05) among those who
tested positive to anti-PGL-I. Most signiicant increase
of IgM titers in the group that developed disease. Cases with residence near other cases (16.4% - about 50m, 62% - 100m and 90.3 % - 200m). Greater proportion of new cases detected at the schools selected based on spatial distribution of cases than in randomly selected schools (p < 0.05).
Garcia et al. 201346
Cáceres (MT) 2001 to 2007 34 cases
Notiication form of a USF; IBGE − Distribution of leprosy cases diagnosed in
USF.
− Distribution of cases: a radius of 50 m
Geocoding
Buffer (Scale: radius of 50 m)
12 cases (35.3%) in a radius of 50 meters of any other case diagnosed in that territory (household or neighborhood)
Paschoal et al. 201347
São José do Rio Preto (SP) 1998 to 2010
425 cases
Leprosy Control Program − Distribution of paucibacillary and multibacillary cases
− Ten clusters (households of cases – irst and
second order)
MapInfo Kernel estimator K-function
Greatest cluster (1st order) in North of city
Higher number of cases in urban areas with greatest population density (north and northeast of city)
CDSSES-MG: Sanitary Dermatology Coordination of State Ofice of Health, Minas Gerais; CP: prevalence coeficient; FIDEM: Metropolitan Developing Foundation; GEIPMBH: Epidemiology and Information Ofice of Municipality of Belo Horizonte; GIS: Geographical Information Systems; HDI: Human Development Index; IBGE: Brazilian Institute of Geography and Statistics; LISA: Local Index of Spatial Association; NCDR: case detection rate; RR: rate ratio; SIM: Mortality Information System; SINAN: Brazilian Disease Surveillance System; USF: Health Family unities. To homogenize results, we described NCDR for 100,000 inhabitants and CP for 10,000 inhabitants.
Si
lv
a
C
L
M
e
t
a
l.
S
p
a
ti
a
l d
is
tr
ib
u
ti
o
n
o
f
le
p
ro
sy
in
B
ra
z
il
447
income inequality (Gini index), domiciles’ agglomeration,
worse sanitation condition, and percentage of cases with grade
2-disability.
Regarding health care indicators, there was an association
between an increased Family Health Care Program coverage and
the number of contacts investigated. The study by Martins-Melo
et al. was the only one that evaluated the spatial distribution
of mortality due to leprosy
18. Both crude and smoothed rates
showed greater mortality in the Midwest and North regions,
in black individuals, in males, and had a gradient relationship
with aging. High mortality clusters were identiied in the
Midwest, North and Northeast regions, as well as Northwest
of Paraná State.
Mortality decreased in Brazil from 2000 to 2011, but
has remained stable in North and Northeast regions. Other
studies using the scale of municipalities identiied clusters and
heterogeneity in the distribution of the disease associated with
low socioeconomic indicators
23,26and increased urbanization
21,23,
apart from indicators that overlap with high values – global
NCDR, NCDR in children under 15 years, and grade 2
disability
19,20. In the Northern region and the Amazonian States,
high percentages of hyperendemic municipalities (NCDR
>40/100,000 inhabitants) were accentuated.
Regarding districts, areas with greater detection r a t e s
for leprosy corresponded with lower socioeconomic status,
measured by social class and urban quality index
28,31. The
study by Lima et al. was the only one that assessed the carrier
status, and used a case-control approach, besides an external
group. Spatial distribution of carriers was also characterized
by clusters
28.
In the analysis by neighborhood, heterogeneity was also
partly explained by low socioeconomic pattern
32-34,, basic
sanitation deicit
33,34, and high population density
32-34.
Studies in Mossoró (Rio Grande do Norte state) have
used geographic information systems to guide case-inding
campaigns
33,34. In the scale of census tracts, it was observed
that low socioeconomic levels
42,44and high population density
areas
39,41showed a positive association with higher incidence.
The study by Imbiriba et al. reined the analysis with
data on occupation from different census tracts, showing that
migration and great poverty contributed in different parts of
Manaus
38(Amazonas State). In Castanhal (Pará State), Barreto
et al. described the distribution of houses and investigated
contacts, and the relationship with serological levels of
anti-phenolic glycolipid-I (anti-PGL-I)
39. The studies that observed
households
45-47or schools identiied that new cases emerged in
small distances of cases previously diagnosed
45,46, and clusters
of disease were located in poorer areas and those with higher
population densities
47.
DISCUSSION
We have identiied 35 studies on the spatial distribution
of leprosy in t h e l a s t 20 years. Although the most affected
areas were the North and the Midwest, the scientiic literature
was not proportional to the intensity of the disease; almost a
third of the studies were carried out in the Southeast region.
Probably the proximity of research institutions accounted for
this disproportion.
Most articles used the SINAN as a source of information;
however, it is known that there are problems of completion and
consistency in this system
48,49. Another point to be considered is the
dificulty experienced by various authors in making geographical
references of leprosy cases, because of the incompleteness of
the addresses in the SINAN, or insuficient information. Such
instances were more frequent on the outskirts of the cities, where
the NCDR was higher and it would be more relevant to obtain
this information
37,40.. Most of the authors used the local Bayesian
empirical model to smooth the leprosy detection coeficients in
an attempt to alleviate random luctuations in the indicators, a
consequence of rare events in small populations
50. Smoothing of
detection rates can improve early detection of cases, increase the
number of regions classiied as
hyperendemic and the number of
people needed to be followed to detect one new case of leprosy
39,45.
A l s o , the combination of g e o g r a p h i c i n f o r m a t i o n
s y s t e m s and spatial analysis can identify clustering of leprosy
cases, select areas for more focused interventions, and monitor
disease control
51. We must highlight that heterogeneity was
observed in the distribution of the disease in all scales used,
regardless of the analytical method used.
The epidemiological indicator most used was the NCDR.
Despite the high levels of leprosy in children a g e d less than
15 years in the country and
the importance of the degree of
disability to identify diagnosis delay, few studies have
addressed
these indicators. For all indicators, the results showed that
despite the decrease in the number of leprosy cases
reported
in temporal studies in the country
7,52, there are areas with
stagnation
or growth of these indicators. Some endemic
areas showed an overlap of indicators, adding a high risk of
transmission and clusters of late diagnosis
19,29,33.
Some studies also evaluated contacts (intra and
extra-domiciliary) and
the transmission of leprosy. The importance of
intra-domiciliary transmission was
conirmed by comparing it
with the probability that multibacillary carriers will be infected
even before the
clinical manifestation of the disease
17,35,46.
Transmission was also identiied in the
neighborhood and school
environment
39,45. It must be pointed out that the study by
Barreto et al. incorporated anti-PGL-I serology as an adjuvant
to surveillance
activities merged with spatial analysis in the
early detection of new cases
45.
This
may be a promising approach to the strategy of active
search attached to t h e administration
of immunoprophylaxis
and/or chemoprophylaxis, which are proposals to
zero out
the
transmission of leprosy
53. These authors emphasize
the effectiveness of large-scale
school surveys, mainly in
hyperendemic areas or clusters of the disease.
There is some
controversy regarding health services and indicators of leprosy.
Some authors
36,37report that despite the decentralization of
services and leprosy
control activities, as well as the increased
coverage of the Family Health Care Strategy, health
services
are centered on passive surveillance, with less impact on the
control of endemic diseases.
448
As these services serve spontaneous demand patients mostly,
hidden
prevalence remains. In Duque de Caxias, a municipality
of Rio de Janeiro
37, a positive correlation between new cases
and targeted campaigns showed no correlation between the
number of new cases and the number of decentralized units
of service for leprosy, both USF and decentralized reference
units. A study on the delay in disease diagnosis in Brazil
identiied that misdiagnosis of cutaneous lesions is one of the
predisposing factors, and recommended strengthening the
medical curricula
54.
On the other hand, some studies reafirm trend evaluations,
showing that the increase of NCDR related to coverage of
health services does not relect a true increase in the incidence
40,
but an increase in the detection of new cases that would
otherwise remain undiagnosed – the hidden prevalence.
However, the trend, for the next few years, would be a decrease
in disease incidence
55. Additionally, NCDR can vary due to
distortions caused by the different qualities of municipal
surveillance systems.
Furthermore, trend comparisons are certainly hampered
by changing municipalities, and redeinition of geographical
areas occurring in recent decades in the country, in addition
to population migratory movements. Spatial analysis has
contributed to t h e knowledge of the magnitude and dynamics
of leprosy as a disease. Although the country shows decreases in
prevalence and in the detection of new cases, priority regions
of high endemicity were identiied, where it is necessary to
intensify actions to eliminate the disease.
Although the studies presented in this review are susceptible
to ecological fallacy, the association of leprosy with low
socioeconomic status was corroborated at different levels of
spatial aggregation and with different indicators, indings
similar to tuberculosis shown in a recent review
56. Therefore,
this conirms the importance of health policies aimed at more
vulnerable populations. Another possible limitation, considering
the lack of effective surveillance in low endemic areas, is the
occurrence of
pseudo-silent areas
.
New studies with spatial analysis and geographic information
systems resources
51, highlighting recent transmission indicators
and diagnostic delays are essential to deepen the knowledge,
to guide case-inding campaigns, and to monitor
interventional
results in the elimination of leprosy in Brazil.
Conlict of interest
The authors declare that there is no conlict of interest.
REFERENCES
1. Organização Mundial de Saúde (OMS). Estratégia Global Aprimorada para Redução Adicional da Carga da Hanseníase (Período do Plano: 2011-2015). Brasília: Organização Pan-Americana da Saúde/OMS; 2010. 34 p.
2. Ministério da Saúde (MS). Secretaria de Vigilância em Saúde. Departamento de Vigilância das Doenças Transmissíveis. Plano integrado de ações estratégicas de eliminação da hanseníase, ilariose, esquistossomose e oncocercose como problema de saúde pública, tracoma como causa de cegueira e controle das
geohelmintíases: plano de ação 2011-2015. Brasília: Ministério da Saúde; 2012. 100 p.
3. World Health Organization (WHO). Department of Control of Neglected Tropical Diseases Investing to overcome the global impact of neglected tropical diseases: Third WHO report on neglected diseases. Geneva: World Health Organization; 2015. 191 p. Acesso: 22 jan 2015. Available at: http://www.who.int/neglected_ diseases/9789241564861/en/.
4. Paim J, Travassos C, Almeida C, Bahia L, Macinko J. The Brazilian health system: history, advances, and challenges. Lancet. 2011;377(9779):1778-97.
5. Barreto ML, Teixeira MG, Bastos FI, Ximenes RA, Barata RB, Rodrigues LC. Successes and failures in the control of infectious diseases in Brazil: social and environmental context, policies, interventions, and research needs. Lancet. 2011;377(9780):1877-89. 6. Nery JS, Pereira SM, Rasella D, Penna MLF, Aquino R,
Rodrigues LC, et al. Effect of the Brazilian conditional cash transfer and primary health care programs on the new case detection rate of leprosy. PLoS Negl Trop Dis. 2014;8(11):e3357
7. Andrade V, Ignotti E. Secular trends of new leprosy cases diagnosed in Brazil during 1987-2006. Indian J Lepr. 2008;80 (1):31-8.
8. Ministério da Saúde. Secretaria de Vigilância em Saúde. Portal Saúde. 2016. Hanseníase. Situação epidemiológica. Acesso: 10 jul. 2016. Disponível em: http://portalarquivos.saude.gov.br/images/ pdf/2016/julho/07/Indicadores-epidemiol--gicos-e operacionais-de-hansen--ase-2000-a-2015.pdf
9. Kerr-Pontes LR, Barreto ML, Evangelista CM, Rodrigues LC,
Heukelbach J,Fieldmeier H. Socioeconomic, environmental, and
behavioural risk factors for leprosy in North-east Brazil: results of a case-control study. Int J Epidemiol. 2006;35(4):994-1000. 10. Magalhães MCC, Rojas LI. Diferenciação territorial da hanseníase
no Brasil. Epidemiol. Serv. Saúde. 2007;16(2):75-84.
11. Carvalho MS, Souza-Santos R. Análise de dados espaciais em saúde pública: métodos, problemas e perspectivas. Cad. Saúde Pública. 2005;21(2):361-78.
12. Barcellos CC, Sabroza PC, Peiter PC, Rojas LI. Organização espacial: saúde e qualidade de vida: análise espacial e uso de indicadores na avaliação de situações de saúde. Inf. Epidemiol. SUS. 2002;11(3):129-38.
13. Moher D, Liberati A, Tetzlaff J, Altman DG; PRISMA Group. Preferred reporting items for systematic reviews and meta-analyses: the PRISMA statement BMJ. 2009;339:b2535.
14. Silva DRX, Ignotti E, Souza-Santos R, Hacon SS. Hanseníase, condições sociais e desmatamento na Amazônia brasileira. Rev Panam Salud Publica. 2010;27(4):268-75.
15. Magalhães MCC, Santos ES, Queiroz ML, Lima ML, Borges RCM, MS Souza, et al. Migração e hanseníase em Mato Grosso. Rev Bras Epidemiol. 2011;14(3):386-97.
16. Penna MLF, Wand-del-Rey de Oliveira ML, Penna G. Spatial Distribution of Leprosy in the Amazon Region of Brazil. Emerg Infect Dis. 2009;15(4):650-2.
17. Freitas LRS, Duarte EC, Garcia LP. Leprosy in Brazil and its association with characteristics of municipalities: ecological study, 2009-2011. Trop Med Int Health. 2014;19(10):1216-25.
18. Martins-Melo FR, A s s u n ç ã o - R a m o s AV, R a m o s J r A N , A l e n c a r C H , M o n t e n e g r o J r R M , Wand-del-Rey de Oliveira ML, et al. Leprosy-related mortality in Brazil: a neglected condition of a neglected disease. Trans R Soc Trop Med Hyg. 2015;109(10):643-52.
19. Alencar C H , R a m o s J r A N , d o s Santos ES, Richter J, Heukelbach J. Clusters of leprosy transmission and of late diagnosis in a highly endemic area in Brazil: focus on different spatial analysis approaches. Trop Med Int Health. 2012;17(4):518-25. 20. Montenegro ACD, Werneck GL, Kerr-Pontes LRS, Barreto ML,
Feldmeier H. Spatial analysis of the distribution of leprosy in the State of Ceará, Northeast Brazil. Mem Inst Oswaldo Cruz. 2004;99(7):683-6.
449
21. Monteiro LD, Martins-Melo FR, Brito AL, Alencar CH, Heukelbach J. Spatial patterns of leprosy in a hyperendemic state in Northern Brazil, 2001-2012. Rev Saúde Pública. 2015;49:84.
22. Oliveira DT, Bezerra MM, Almeida JAP, Duthie M, Reed S, Jesus AMR. Neurological disability in leprosy: incidence and gender association in Sergipe, Brazil. Geospatial Health. 2012;6(3):125-29. 23. Cabral-Miranda W, Chiaravalotti Neto F, Barrozo LV.
Socio-economic and environmental effects inluencing the development
of leprosy in Bahia, north-eastern Brazil. Trop Med Int Health. 2014:19(12)1504-14.
24. Opromolla PA, Dalben I, Cardim M. Análise da distribuição espacial da hanseníase no Estado de São Paulo, 1991-2002. Rev Bras Epidemiol. 2005;8(4):356-64.
25. Opromolla PA, Dalben I, Cardim M. Análise Geoestatística de casos de hanseníase no Estado de São Paulo, 1991-2002. Rev Saúde Pública. 2006;40(5):907-13.
26. Rodrigues-Junior AL, d o Ó VT, Motti VG. Estudo espacial e temporal da hanseníase no estado de São Paulo, 2004-2006. Rev Saúde Pública. 2008;42(6):1012-20.
27. Sampaio PB, Rossi TL, C e r u t t i Jr C, Zandonade E. Spatial analysis of new cases of leprosy in the State of Espírito Santo, Brazil, between 2004 and 2009. Rev Soc Bras Med Trop. 2012;45(3):380-4. 28. Lima LNGC, Frota CC, Mota RM, Almeida RL, Pontes MA,
Gonçalves HS et al. Widespread nasal carriage of Mycobacterium leprae among a healthy population in a hyperendemic region of northeastern Brazil. Mem Inst Oswaldo Cruz. 2015;110(7):898-905.
29. Martelli CM, Moraes Neto OL, Andrade AL, Silva SA, Silva IM, Zicker F. Spatial patterns of leprosy in an urban area of central Brazil. Bull World Health Organ.1995;73(3): 315-9.
30. Sampaio PB, Madeira ES, Diniz L, Noia EL, Zandonade E. Spatial distribution of leprosy in areas of risk in Vitória, State of Espírito Santo, Brazil, 2005 to 2009. Rev Soc Bras Med Trop. 2013;46(3):329-34.
31. Sampaio PB, Bertolde AI, Maciel EL, Zandonade E. Correlation between the spatial distribution of leprosy and socioeconomic indicators in the city of Vitória, State of ES, Brazil. Lepr Rev 2013;84(4):256-65.
32. Souza WV, Barcellos CC, Brito AM, Carvalho MS, Cruz OG, Albuquerque MFPM, et al. Aplicação de modelo bayesiano empírico na análise espacial da ocorrência de hanseníase. Rev Saúde Pública. 2001;35(5):474-80.
33. Dias MCFS, Dias GH, Nobre ML. Distribuição espacial da hanseníase no município de Mossoró/RN, utilizando o Sistema de Informação Geográica – SIG. An Bras Dermatol. 2005;80 (Supl 3):S289-S94.
34. D e Souza Dias MC, Dias GH, Nobre ML. The use of Geographical Information System (GIS) to improve active leprosy case inding campaigns in the Municipality of Mossoró, Rio Grande do Norte State, Brazil. Lepr Rev 2007;78(3):261-69.
35. Moura MLN, Dupnik KM, Sampaio GAA, Nóbrega PFC, Jeronimo AK, do Nascimento-Filho JM, et al. Active surveillance of Hansen’s disease (leprosy): importance for case inding among extra-domiciliary contacts. PLoS Negl Trop Dis. 2013;7(3):e2093. 36. Gauy JS, Hino P, Santos CB. Distribuição espacial dos casos
de hanseníase no município de Ribeirão Preto no ano de 2004. Rev Latino-Am Enferm. 2007;15(3):460-5.
37. Duarte-Cunha M, Souza-Santos R, Matos HJ, Oliveira MLW. Aspectos epidemiológicos da hanseníase: uma abordagem espacial. Cad Saúde Pública. 2012;28(6):1143-55.
38. Imbiriba ENB, Silva Neto AL, Souza WV, Pedrosa V, Cunha MG, Garnelo L. Desigualdade social, crescimento urbano e hanseníase em Manaus: abordagem espacial. Rev Saúde Pública. 2009;43(4):656-65.
39. Barreto JG, Bisanzio D, Guimarães LS, Spencer JS, Vazquez-Prokopec GM, Kriton U, et al. Spatial Analysis Spotlighting Early Childhood Leprosy Transmission in a Hyperendemic
Municipality of the Brazilian Amazon Region.PLoS Negl Trop Dis.2014;8(2):e-2665.
40. Lapa T, Albuquerque MFPM, Carvalho MS, Silveira Jr JC. Análise da demanda de casos de hanseníase aos serviços de saúde através do uso de técnicas de análise espacial. Cad. Saúde Pública. 2006;22(12):2575-83.
41. Queiroz JW, Dias GH, Nobre ML, D e Souza Dias MC, Araújo SF, Barbosa JD, et al. Geographic information systems and applied spatial statistics are eficient tools to study Hansen’s disease (leprosy) and to determine areas of greater risk of disease. Am J Trop Med Hyg. 2010;82(2):306-14.
42. Mencaroni DA, Pinto Neto JM, Villa TCS, Oliveira MHP. Análise espacial da endemia hansênica na área urbana do município de Fernandópolis/SP. Hansen Int. 2004;29(1):12-20.
43. Amaral EP, Lana FCF. Análise espacial da Hanseníase na microrregião de Almenara – MG, Brasil. Rev Bras Enferm. 2008;(61):701-7.
44. Cury MRCO, Paschoal VDA, Nardi SMT, Chierotti AP, Rodrigues J Jr AL, Chiaravalloti-Neto F. Spatial analysis of leprosy incidence and associated socioeconomic factors. Rev Saúde Pública. 2012;46(1):110-8.
45. Barreto JG, Bisanzio D, Frade MAC, Moraes TMP, Gobbo AR, de Souza Guimarães L, et al. Spatial epidemiology and serologic cohorts increase the early detection of leprosy. BMC Infect Dis. 2015;15:527.
46. Garcia DR, Ignotti E, Cortela DCB, Xavier DR, Barelli CSGAP. Análise espacial dos casos de hanseníase, com enfoque à área de risco, em uma unidade básica de saúde no município de Cáceres (MT). Cad Saúde Colet. 2013;21(2):168-72.
47. Paschoal JAA, Paschoal VDA, Nardi SMT, Rosa PS, Ismael
MGS, Sichieri1 EP. Identiication of urban leprosy clusters.
Scientiic World Journal. 2013;2013:219143.
48. Galvão PRS, Ferreira AT, Maciel MGG, Almeida RP, Hinders D, Schreuder PA, et al. Uma avaliação do sistema de informação SINAN usado no Programa de Controle de Hanseníase no estado do Pernambuco, Brasil. Cad. Saúde Coletiva 2009;17(1);87-102.
49. Bovendorp ACC, Oliveira MB, Saleme OS, Lyon S, Bastos M. Qualidade de registros de hanseníase em centro de referência no estado de Minas Gerais, no período de 2006 a 2010. Rev Méd Minas Gerais 2014;24 (Supl 6):S61-S65.
50. Assunção RM, Barreto SM, Guerra HL, Sakurai E. Mapas de taxas epidemiológicas: uma abordagem Bayesiana. Cad Saúde Pública. 1998;14(4):713-23.
51. Bakker MI, Scheelbeek PFD, van Beers SM. The use of GIS in leprosy control. Lepr Rev. 2009;80(3):327-31.
52. Ministério da Saúde. Situação epidemiológica da hanseníase no Brasil – análise de indicadores selecionados na última década e desaios para eliminação. Boletim Epidemiológico. Secretaria de Vigilância em Saúde. 2013;vol. 44(11):1-12.
53. Smith CS, Aerts A, Kita E, Virmond M. Time to deine leprosy
elimination as zero leprosy transmission? Lancet Infect Dis. 2016;16(4):398-9.
54. Henry M, GalAn N, Teasdale K, Prado R, Amar H, Rays MS, et al. Factors Contributing to the Delay in Diagnosis and Continued Transmission of Leprosy in Brazil – An Explorative, Quantitative, Questionnaire Based Study. PLoS Negl Trop Dis. 2016;10(3):e0004542
55. Penna MLF, Oliveira MLW, Carmo EH, Penna GO, Temporão JG. Inluência do aumento do acesso à atenção básica no comportamento da taxa de detecção de hanseníase de 1980 a 2006. Rev Soc Bras Med Trop. 2008;41(suppl II):6-10.
56. San Pedro A, Oliveira RM. Tuberculose e indicadores socioeconômicos: revisão sistemática da literatura. Rev Panam Salud Publica. 2013;33(4):294-301.