ACPD
5, 875–909, 2005Midlatitude ClO balloon profiles
B. Vogel et al.
Title Page Abstract Introduction Conclusions References
Tables Figures
◭ ◮
◭ ◮
Back Close
Full Screen / Esc
Print Version Interactive Discussion
EGU
Atmos. Chem. Phys. Discuss., 5, 875–909, 2005 www.atmos-chem-phys.org/acpd/5/875/
SRef-ID: 1680-7375/acpd/2005-5-875 European Geosciences Union
Atmospheric Chemistry and Physics Discussions
Midlatitude ClO during the maximum
atmospheric chlorine burden: in situ
balloon measurements and model
simulations
B. Vogel1, R. M ¨uller1, A. Engel2, J.-U. Grooß1, D. Toohey3, T. Woyke4, and
F. Stroh1
1
Research Center J ¨ulich, Institute for Stratospheric Research (ICG-I), J ¨ulich, Germany
2
University of Frankfurt, Institute for Meteorology, Frankfurt, Germany
3
University of Colorado, Boulder, CO, USA
4
Etas GmbH, Stuttgart, Germany
Received: 27 January 2005 – Accepted: 11 February 2005 – Published: 17 February 2005 Correspondence to: B. Vogel ([email protected])
ACPD
5, 875–909, 2005Midlatitude ClO balloon profiles
B. Vogel et al.
Title Page Abstract Introduction Conclusions References
Tables Figures
◭ ◮
◭ ◮
Back Close
Full Screen / Esc
Print Version Interactive Discussion
EGU
Abstract
Chlorine monoxide (ClO) plays a key role in stratospheric ozone loss processes at midlatitudes. We present two balloonborne in situ measurements of ClO conducted in northern hemisphere midlatitudes during the period of the maximum of total inorganic chlorine loading in the atmosphere. Both ClO measurements were conducted on board
5
the TRIPLE balloon payload, launched in November 1996 in Le ´on, Spain, and in May 1999 in Aire sur l’Adour, France. For both flights a ClO daylight and night time vertical profile could be derived over an altitude range of approximately 15–31 km. ClO mix-ing ratios are compared to model simulations performed with the photochemical box model version of the Chemical Lagrangian Model of the Stratosphere (CLaMS).
Simu-10
lations along 24-h backward trajectories were performed to study the diurnal variation of ClO in the midlatitude lower stratosphere. Model simulations for the flight launched in Aire sur l’Adour 1999 show a good agreement with the ClO measurements. For the flight launched in Le ´on 1996, a similar good agreement is found, except at around
≈650 K potential temperature (≈26 km altitude). However, a tendency is found that for
15
solar zenith angles greater than 86◦–87◦ the simulated ClO mixing ratios substantially
overestimate measured ClO by approximately a factor of 2.5 or more for both flights. Therefore we conclude that no indication can be deduced from the presented ClO mea-surements that substantial uncertainties exist in midlatitude chlorine chemistry of the
stratosphere. An exception is the situation at solar zenith angles greater than 86◦–87◦
20
where model simulations substantial overestimate ClO observations.
1. Introduction
Stratospheric ozone has globally decreased over the last ≈25 years. In
midlati-tudes, the vertical, latitudinal, and seasonal characteristics of changes in ozone are broadly consistent with the understanding that halogens are the primary cause of these
25
ACPD
5, 875–909, 2005Midlatitude ClO balloon profiles
B. Vogel et al.
Title Page Abstract Introduction Conclusions References
Tables Figures
◭ ◮
◭ ◮
Back Close
Full Screen / Esc
Print Version Interactive Discussion
EGU
for the lower stratosphere in the northern and southern hemisphere midlatitudes for
the time period between 1979 and 2000 (Wang et al., 2002; WMO, 2003).
Further-more, it was found that the large ozone depletions determined for the Arctic vortex in several previous winters will ultimately spread out and dilute ozone concentrations at midlatitudes and thus contribute to the observed ozone decrease at midlatitudes (e.g.
5
Chipperfield,1999;Knudsen and Grooß,2000;Marchand et al.,2004). The catalytic loss of ozone in the lower stratosphere is controlled by a combination of cycles
involv-ing reactions with BrO, ClO, HO2, and NO2(e.g.Wennberg et al.,1994;Stimpfle et al.,
1994). Thus a prerequisite for a reliable calculation of halogen-induced ozone loss
rates at midlatitudes is information about ClO concentrations at midlatitudes and an
10
understanding of the dependence of ClO concentrations on altitude and time of day. Nonetheless, measurements of ClO at midlatitudes in the lower stratosphere are rare. Early balloonborne in situ measurements of ClO were made in the late 1970’s
and 1980’s all launched in Palestine (32◦N), Texas, (e.g.Anderson et al.,1977,1980;
Anderson,1978). Balloonborne in situ measurements (e.g.Toohey et al.,1993a) and
15
remote measurements (e.g.Osterman et al.,1997) of ClO was obtained at somewhat
higher latitudes (launched from Fort Sumner, 34.5◦N, New Mexico) in the 1990’s. In
situ measurements of ClO conducted on board the ER-2 aircraft cover a greater range
of the midlatitudes (e.g.Toohey et al.,1991,1993b;King et al.,1991), but cover only
a rather small altitude range of ≈16–20 km. Global or near global measurements of
20
ClO exist from the Microwave Limb Sounder (MLS) aboard the Upper Atmosphere
Re-search Satellite (UARS) (e.g.Ricaud et al.,2000) and the Millimeter-wave Atmospheric
Sounder (MAS) during three space shuttle missions in 1992, 1993, and 1994 (e.g.Feist
et al.,2000). The analysis of ClO measurements from the recently launched MIPAS-E
and ODIN instruments has focussed on the polar regions so far (e.g. Glatthor et al.,
25
2004;Urban et al.,2004). In summary, at midlatitudes (≈35◦N–60◦N), in situ as well as remote measurements of ClO over the entire altitude range of the lower stratosphere
(≈15–30 km) are very sparse.
ACPD
5, 875–909, 2005Midlatitude ClO balloon profiles
B. Vogel et al.
Title Page Abstract Introduction Conclusions References
Tables Figures
◭ ◮
◭ ◮
Back Close
Full Screen / Esc
Print Version Interactive Discussion
EGU
1998 the total inorganic chlorine stopped increasing in the troposphere and has
re-mained fairly constant since that time, that is the loading of inorganic chlorine Clyin the
unperturbed stratosphere has recently stabilized (WMO, 2003). Here we present the
only two balloonborne in situ measurements of ClO performed in the lower stratosphere at midlatitudes during the period of the maximum of total inorganic chlorine loading in
5
the atmosphere. Both ClO in situ measurements were conducted on board the TRIPLE
balloon payload launched in November 1996 in Le ´on (42.3◦N), Spain, and in May 1999
in Aire sur l’Adour (43.7◦N), France. Both flights were optimized in a way that both a
vertical ClO daylight and night time profile could be measured over an altitude range of approximately 15–31 km.
10
Further, photochemical model studies were performed using the box model version
of the Chemical Lagrangian Model of the Stratosphere (CLaMS) (McKenna et al.,
2002a,b) to test if model simulations can reproduce the diurnal behavior of ClO at midlatitudes over the entire range of the lower stratosphere. In previous photochemical model studies for midlatitude conditions based on ER-2 measurements, the ClO
photo-15
chemistry was described correctly by models (e.g.Brune et al.,1990;Salawitch et al.,
1994;Stimpfle et al.,1994), however discrepancies in the understanding of the
chlo-rine budget remained unresolved at that time (e.g.Stimpfle et al.,1994). In a model
study based on balloonborne in situ measurements of ClO (Avallone et al.,1993),
ob-served ClO was greater by as much as a factor of four below 20 km altitude. Studies
20
on the broadband photolysis of ClONO2led to the speculation that a pressure
depen-dence of the ClONO2 quantum yield beyond 300 nm exists (Nickolaisen et al.,1996),
but first in situ measurements of ClONO2on board the ER-2 aircraft during the northern
high-latitude summer found no evidence in support of a pressure-dependent quantum
yield for photodissociation of ClONO2(Stimpfle et al.,1999). Further, no evidence was
25
found from these ER-2 measurements in support of missing inorganic chlorine species
that would constitute a significant fraction of Cly (Bonne et al.,2000). In our study, we
found in general a quite good agreement between measurements and simulations of
ACPD
5, 875–909, 2005Midlatitude ClO balloon profiles
B. Vogel et al.
Title Page Abstract Introduction Conclusions References
Tables Figures
◭ ◮
◭ ◮
Back Close
Full Screen / Esc
Print Version Interactive Discussion
EGU
simulated ClO mixing ratios substantially overestimate measured ClO for both flights.
2. Observations
The ClO measurements were conducted on board the balloonborne multi-instrument
payload TRIPLE launched on 14 November 1996 from Le ´on (42.3◦N, 5.4◦W), Spain,
and on 3 May 1999 from the French launching base in Aire sur l’Adour (43.7◦N, 0.3◦W),
5
France (in the following referred to as Le ´on and Aire flights). TRIPLE consists of the
J ¨ulich ClO/BrO in situ instrument (Vogel et al.,2003), the cryogenic whole air sampler
of the University of Frankfurt (Schmidt et al., 1987) for the observation of long-lived
tracers and various CFCs from which the amount of total inorganic chlorine, Cly, can
be inferred (Schmidt et al.,1994;Engel et al.,1997), and the J ¨ulich Fast In Situ
Strato-10
spheric Hygrometer (FISH) (Schiller et al.,2002).
On 14 November 1996, a prototype of the J ¨ulich ClO/BrO in situ instrument (
Pier-son et al., 1999; Woyke et al., 1999) was flown, whereas on 3 May 1999 the new
J ¨ulich ClO/BrO in situ instrument (Vogel et al.,2003) was part of the payload. Both
instruments employ the well-established chemical-conversion resonance-fluorescence
15
technique (Brune et al.,1989).
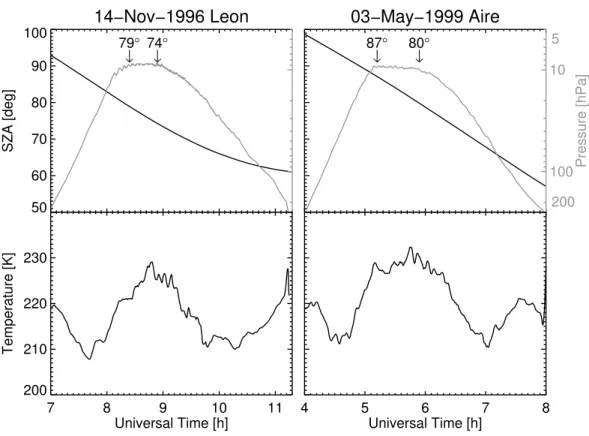
2.1. Meteorological situation
The dynamical situation of the stratosphere was very different for the two balloon flights.
The flight in November 1996 was conducted during the typical time period of the for-mation of the Arctic polar vortex in the northern hemisphere, whereas the flight in May
20
1999 took place after the dissipation of the polar vortex in spring (see Fig.1).
The meteorological analysis of FU Berlin for the flight in November 1996 shows that in October 1996, the Arctic polar vortex was stronger developed than normal. In early November the vortex was split and the center of the vortex was displaced out of the pole towards Greenland. From 7 November, the center of the vortex moved
ACPD
5, 875–909, 2005Midlatitude ClO balloon profiles
B. Vogel et al.
Title Page Abstract Introduction Conclusions References
Tables Figures
◭ ◮
◭ ◮
Back Close
Full Screen / Esc
Print Version Interactive Discussion
EGU
eastward which caused a temperature decrease and an increase in potential vorticity over Northern Spain until 11 November. Afterwards, the wind speed decreased over Northern Spain, because the center of the vortex moved further on eastward. On 14 November 1996, Le ´on was located outside the polar vortex. The air masses probed on this day were previously led around the Atlantic anticyclone and had crossed the cold
5
area over Island in the lower stratosphere.
The flight in May 1999 occurred after a weak northern winter. Through most of the Arctic winter 1998/1999, the polar vortex was abnormally warm and weak, because an atypically early major stratospheric sudden warming occurring in mid-December. A
second major warming followed in late February (Manney et al., 1999). As a
conse-10
quence the vortex was eroded at the time of the flight as obvious from Fig.1.
2.2. Flight profiles
To study in detail the sunrise evolution of the ClO mixing ratios both flights were
launched during sunrise (see Fig.2). During ascent a ClO night and sunrise profile
and during descent a ClO daylight profile could be derived.
15
On 14 November 1996, the TRIPLE payload was launched at approximately
06:30 UT. After reaching a maximum altitude of approximately 31 km (≈10 hPa), a
bal-loon float took place in the 79◦–74◦ solar zenith angle (SZA) interval. During descent
SZAs between 74◦and 63◦were encountered.
On 3 May 1999, the TRIPLE payload was launched at approximately 03:30 UT. The
20
entire balloon ascent was conducted during night (SZA>87◦). After reaching a
max-imum altitude of approximately 31 km (≈10 hPa), the balloon floated at this altitude
between 87◦ and 80◦ SZA into sunrise, so that within this air mass the increase of
the ClO mixing ratios could be measured. During descent a ClO daylight profile was
measured between 80◦and 65◦SZA.
ACPD
5, 875–909, 2005Midlatitude ClO balloon profiles
B. Vogel et al.
Title Page Abstract Introduction Conclusions References
Tables Figures
◭ ◮
◭ ◮
Back Close
Full Screen / Esc
Print Version Interactive Discussion
EGU
2.3. ClO and O3measurements
The ClO vertical profiles measured by the TRIPLE balloon payload on 14 November
1996 and on 3 May 1999 are shown in Fig.3.
On 14 November 1996, a ClO profile was measured during ascent with ClO mixing ratios of up to 150 pptv at float altitude. During descent a ClO daylight profile was
5
measured with ClO peak values of approximately 220 pptv between 750 and 800 K
potential temperature. In Fig.3(left panel), ozone mixing ratios are shown which were
measured simultaneously by an ECC (electrochemical concentration cell) ozone sonde on board TRIPLE. The signal of the ozone sonde was jammed, so that not for all
altitudes ozone measurements could be obtained. Therefore in Fig.3 (left panel) in
10
addition, an ozone profile is shown measured by an ozone sonde launched in Le ´on one day after the balloon flight on 15 November 1996. Above 650 K potential temperature, the ozone measurements on 15 November are much lower than on 14 November 1996. The balloon ascent on 3 May 1999, was during night, so that very low ClO mixing
ratios, lower than 50 pptv were measured (see Fig.3, right panel). On the float level,
15
ClO mixing ratios increase during sunrise up to approximately 130 pptv. For the ClO daylight profile measured during descent, maximum ClO mixing ratios of approximately
200 pptv were obtained at around 840 K potential temperature. Additionally in Fig.3
(right panel), an ozone profile simultaneously measured by an ECC ozone sonde on board TRIPLE is shown.
20
For both flights, the overall accuracy of the ClO measurement is ≈20–23%. For
measured ClO mixing ratios below 50 pptv we deduced an error of±10 pptv.
3. Model simulations
Model simulations were performed to investigate whether the measured diurnal vari-ation of chlorine monoxide can be reproduced at midlatitudes over the altitude range
25
poten-ACPD
5, 875–909, 2005Midlatitude ClO balloon profiles
B. Vogel et al.
Title Page Abstract Introduction Conclusions References
Tables Figures
◭ ◮
◭ ◮
Back Close
Full Screen / Esc
Print Version Interactive Discussion
EGU
tial temperature during ascent and descent yield two points within the diurnal variation
of ClO. Therefore differences in ClO mixing ratios between ascent and descent can
be used to test our understanding of the photochemical evolution of ClO for sunrise,
similar as in the model study byPierson et al.(1999). Here we use for the model
simu-lations the Chemical LAgrangian Model of the Stratosphere (CLaMS) (McKenna et al.,
5
2002a,b). This model simulates both the chemistry of multiple air parcels and their transport and is used here as a photochemical box model. The absorption cross
sec-tions and reaction rate constants are taken from standard recommendasec-tions (Sander
et al.,2002). Usually for simulations with the CLaMS model, the family concept
(IM-PACT) is employed as the integration solver (McKenna et al.,2002b). In all model
sim-10
ulations presented in this work, the explicit stiffsolver SVODE (McKenna et al.,2002b)
is used that is both more precise and numerically more expensive. As input data for the photolysis scheme an ozone profile is derived from model results of the Mainz
2-D model (Gidel et al.,1983;Grooß,1996) below 15 km altitude and from Observations
of the Halogen Occultation Experiment (HALOE) on board the UARS satellite (Russell
15
et al.,1993) above 15 km altitude.
We performed simulations along 24-h backward trajectories calculated from the
lo-cations of the measurement starting at different levels of potential temperature
be-tween 500 K and the float altitude (≈865 K–900 K) and for different SZA during float
(see Figs.6 and 7). We calculated these backward trajectories using wind data from
20
the UK Met Office (UKMO) analyses. A chemical initialization has to be determined
for the simulations at each level of potential temperature. All available stratospheric measurements, together with tracer-correlations, and model simulations were used as sources for this initialization. In the following, the initialization and the results of the model simulations are described for both balloon flights.
25
3.1. Simulations for the flight on 3 May 1999
Table1gives an overview over the measurements employed in order to derive the
ACPD
5, 875–909, 2005Midlatitude ClO balloon profiles
B. Vogel et al.
Title Page Abstract Introduction Conclusions References
Tables Figures
◭ ◮
◭ ◮
Back Close
Full Screen / Esc
Print Version Interactive Discussion
EGU
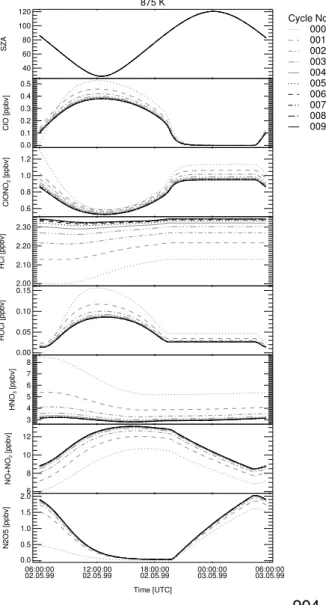
temporal development of the chemical trace species along each 24-h backward tra-jectory perpetually using the results of the previous model simulation to initialize the following 24-h simulation. This is done for all species, except for ozone. To
initial-ize ozone for each cycle the O3 mixing ratios measured by the ECC ozone sonde on
board TRIPLE (case a) (see Sect.2.3) are used. If ozone would not be reinitialized
5
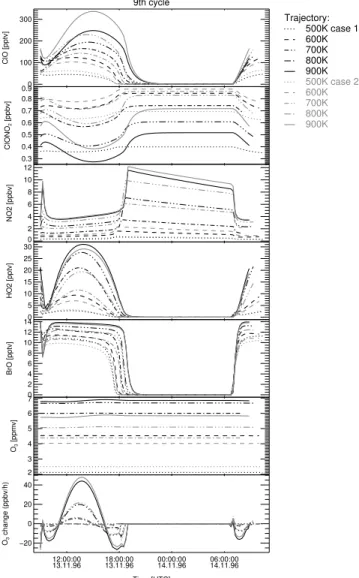
to measured values, the simulated ozone mixing ratios increase steadily (see below). After approximately 6–9 cycles depending on altitude, the most chemical species
con-verge to a constant volume mixing ratio for a given time in the simulation (see Fig.4).
Additionally, model simulations using different initializations for the partioning between
HNO3 and N2O5 (cf. Table 1) converge to the same ClO mixing ratios after
approxi-10
mately 9 cycles. The volume mixing ratios of the important species used to initialize
the model simulations for the last cycle are shown in Table2.
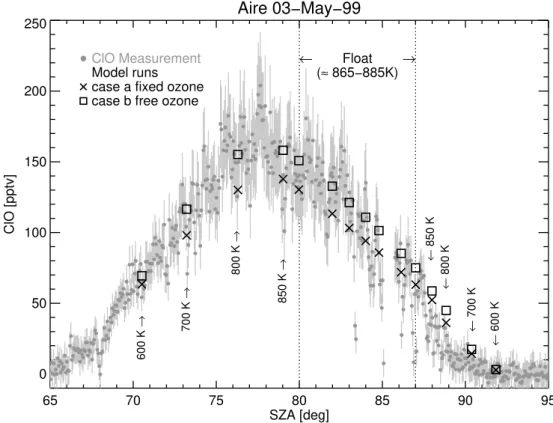
To study the sensitivity to the initial O3 mixing ratios, model simulations were
per-formed using the simulated O3 mixing ratios of the previous model simulation to
ini-tialize the following 24-h simulation (case b) as it is done for all other species in the
15
standard simulation (case a). Then, ozone is continuously increasing during the simu-lation period of 9 times 24 h. Under such conditions, the ozone production rate is larger
than the ozone loss during the simulation period of 24 h (see e.g. Fig.5lowest panel;
the last cycle of case a). For case a, the ozone production rate per day increases with
altitude of up to≈300 ppbv at float altitude during the last cycle. A comparison of case a
20
and case b with the ClO measurements shows that the model simulations are sensitive
to the initial ozone mixing ratios (see Fig.6). In contrast to expectation, case b yields
a better agreement with the ClO measurements as case a. Nevertheless, ClO simula-tions for both cases are within the uncertainties of the ClO measurements, whereby for
both cases for the night time ClO profile (SZA>87◦) the model simulations are at the
25
ACPD
5, 875–909, 2005Midlatitude ClO balloon profiles
B. Vogel et al.
Title Page Abstract Introduction Conclusions References
Tables Figures
◭ ◮
◭ ◮
Back Close
Full Screen / Esc
Print Version Interactive Discussion
EGU
3.2. Simulations for the flight on 14 November 1996
For the Le ´on flight, no measurements of long-lived tracers from the cryogenic whole air sampler on board the TRIPLE payload are available because of technical problems
with the sealing of the air samples. Thus no measurement of either CH4 or N2O and
no information about the total amount of inorganic chlorine Cly is available. Therefore
5
to initialize the model simulations we use measurements of the Halogen Occultation
Experiment (HALOE) on board the UARS satellite (Russell et al., 1993) and
tracer-tracer correlations.
For November 1996, HALOE measurements are available in northern hemisphere
midlatitudes within 35◦N–50◦N for the time period of 1–5 November and of 15–22
10
November. Thus for 14 November, the day of the TRIPLE flight, no HALOE observa-tions exist in the in northern hemisphere midlatitudes. Performing a potential vorticity (PV) analysis of the HALOE measurements yields that the HALOE measurements were conducted both within and outside of the polar vortex depending on longitude due to the distinct asymmetric form of the vortex that was shifted away from the North
15
Pole. From meteorological analysis the air masses probed during the TRIPLE flight
were led around the polar vortex before the measurement (cf. Sect.2.1). Therefore we
derived two data sets to initialize the model simulations one for midlatitude air masses (case 1) and one for polar air masses (case 2). The following PV criterion was used to separate midlatitude and polar air masses:
20
Midlatitude
Θ 600 K 700 K 900 K
PV <70 PVU <120 PVU <400 PVU
Vortex
Θ 600 K 700 K 800 K
PV >80 PVU >150 PVU >300 PVU
ACPD
5, 875–909, 2005Midlatitude ClO balloon profiles
B. Vogel et al.
Title Page Abstract Introduction Conclusions References
Tables Figures
◭ ◮
◭ ◮
Back Close
Full Screen / Esc
Print Version Interactive Discussion
EGU
correlations observed by HALOE. Table1 gives an overview over the sources of the
most important species used to initialize the model simulations.
Similar as for the Aire flight, we calculate the chemistry along each 24-h backward trajectory perpetually using the results of the previous model simulation to initialize the
following 24-h simulation, except for ozone (cf. Sect.3.1). Above 700 K, ClO mixing
5
ratios resulting from the different simulation cycles converge to a constant value for a
given time in the simulation. Below 700 K, no convergence of the ClO mixing ratios
was reached within 9 cycles, but the differences between simulated and measured
ClO mixing ratios are less than the uncertainties of the ClO measurement. The volume mixing ratios of the major important species used to initialize the model simulations for
10
the last cycle are shown in Table3(case 1) and Table4(case 2).
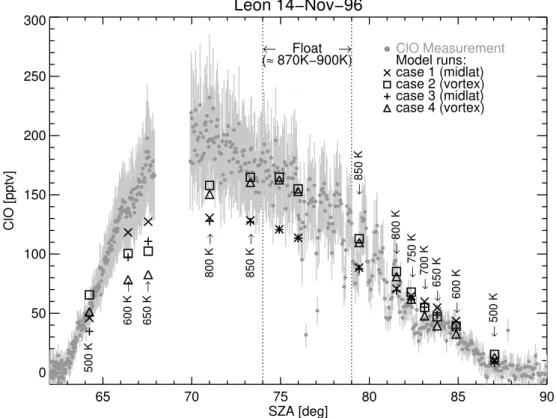
Model simulations using different initializations for the partioning between HNO3and
N2O5 (case 1 and 3 for midlatitude conditions and case 2 and 4 for vortex conditions;
cf. Table1) do not converge after 9 cycles for all altitudes to the same ClO mixing ratios
in contrast to the simulations for the Aire flight (see Fig.7). Only after approximately
15
30 cycles simulations using different initializations for the partioning between HNO3
and N2O5 would converge to the same ClO mixing ratios. Thus the simulations are
sensitive on the partioning of the NOyspecies in contrast to the simulations of the Aire
flight.
For midlatitude conditions, simulations reproduce the shape of the measured diurnal
20
variation of ClO, but simulated ClO mixing ratios are slightly below the lower limit of the uncertainties of the ClO measurement during float and daylight, except at 500 K
potential temperature (see Fig. 7). For vortex conditions, simulated and measured
ClO mixing ratios show a good agreement, except during daylight between 600 and 650 K. Here the maximum of the distribution is shifted to larger SZAs compared to the
25
measurements (see Fig.7). At 650 K, the ClO daylight profile can not be reproduced
by model simulations using either midlatitude or vortex conditions. Here the model simulations underestimate the measurements up to a factor of approximately two. The
ACPD
5, 875–909, 2005Midlatitude ClO balloon profiles
B. Vogel et al.
Title Page Abstract Introduction Conclusions References
Tables Figures
◭ ◮
◭ ◮
Back Close
Full Screen / Esc
Print Version Interactive Discussion
EGU
For the Aire flight the simulated ClO mixing ratios are sensitive to the initial ozone
mixing ratios. Therefore model simulations were performed using the simulated O3
mixing ratios of the previous model simulation to initialize the following 24-h simulation as for the other species (not shown here). The sensitivity of the ClO mixing ratios
on initial O3 mixing ratios determined in this way is negligible in comparison to the
5
sensitivity on the initialization conditions employed in case 1–4.
Ozone is continuously decreasing over the different simulation cycles of up to 9 for
both case 1 and 2 up to 700 K potential temperature and is continuously increasing for both cases above 700 K. This shows that the ozone production rate is less than the ozone loss up to 700 K and larger above 700 K during the simulation period of
10
24 h. Thus for the last cycle an ozone loss of up to approximately −10 ppbv/day
be-low 700 K and an ozone production of up to approximately 50 ppbv/day (case 1) and approximately 80 ppbv/day (case 2) at 900 K potential temperature was found.
3.2.1. Discrepancy for daylight ClO at around 650 K
Possible reasons for the discrepancy between simulations and measurements for the
15
ClO daylight profile at around 650 K will be discussed. At midlatitudes, chlorine nitrate
is formed by the reaction of ClO with NO2and dissociated in ultraviolet (e.g.Brasseur
and Solomon,1984):
ClO+NO2+M→ClONO2+M (1)
ClONO2+hν→Cl+NO3 (2)
20
Thus the concentration of daylight ClO depends on the concentration of night time
ClONO2. Therefore underestimated ClO mixing ratios would imply that ClONO2is
un-derestimated and thus HCl is overestimated by the model. But simulations initialized with HCl mixing ratios reduced by about 20% (equivalent to approximately the min-imum HCl mixing ratios measured by HALOE) still underestimate the ClO
measure-25
ACPD
5, 875–909, 2005Midlatitude ClO balloon profiles
B. Vogel et al.
Title Page Abstract Introduction Conclusions References
Tables Figures
◭ ◮
◭ ◮
Back Close
Full Screen / Esc
Print Version Interactive Discussion
EGU
NO2 (Stimpfle et al.,1994). To initialize the model simulations, the NOx mixing ratios
are reduced by about 20% (equivalent to approximately the minimum NOx mixing
ra-tios measured by HALOE), whereby also the initial NO2 is reduced. Nonetheless the
measured ClO mixing ratios are still underestimated by the simulations after 9 cycles. For the Aire flight we found that ClO is sensitive to the initial ozone mixing ratios (cf.
5
Sect. 3.1). For the Le ´on flight, we used a mean ozone profile derived from HALOE
measurements for midlatitude (case 1) and vortex (case 2) air masses, because the
signal of the ozone sonde on board TRIPLE was jammed (cf. Sect. 2.3). At 650 K
potential temperature, measurements of the ozone sonde are available and are ap-proximately 0.6 ppmv (for midlatitude conditions) and 1.8 ppmv (for vortex conditions)
10
greater than the corresponding mean ozone mixing ratios derived from HALOE mea-surements. The simulations at 650 K were repeated using the measurement of the ozone sonde for initialization. After 9 cycles the simulations yield higher ClO mixing ratio for both daylight and night conditions, but still underestimate the ClO daylight measurement and simultaneously overestimate the ClO nighttime measurement (not
15
shown here). In summary it is unlikely that uncertainties in the initialization of HCl,
NOx, and O3cause the discrepancies in the ClO daylight profile at around 650 K.
The quantum yields of the two ClONO2 photolysis channels
(ClONO2+hν→ClO+NO2 and ClONO2+hν→Cl+NO3) are taken from
stan-dard recommendations (Sander et al., 2002). Nickolaisen et al. (1996) observed
20
pressure dependence of the quantum yield for the ClONO2photolysis beyond 300 nm.
If model simulations do not consider the effect of pressure on the ClONO2photolysis,
they would expect that models would tend to over-predict HCl and under-predict
ClONO2 and thus ClO mixing ratios in the lower stratosphere. In our study, to
reproduce ClO mixing ratios measured during daylight by model simulations JClONO2
25
would have to be increased by a factor of two or more (for case 1 and 2). In this case, the measured ClO nighttime and float profiles would be overestimated substantially by
model simulations. Thus it is unlikely that uncertainties in JClONO2 are the major source
ACPD
5, 875–909, 2005Midlatitude ClO balloon profiles
B. Vogel et al.
Title Page Abstract Introduction Conclusions References
Tables Figures
◭ ◮
◭ ◮
Back Close
Full Screen / Esc
Print Version Interactive Discussion
EGU
profile. Furthermore, the quantum yield for the ClONO2 photolysis channels beyond
300 nm was modified in model simulations. Even by neglecting the Cl+NO3 channel
in favor of the ClO+NO2 channel beyond 300 nm, no evidence is found here that a
significant change in the quantum yield has any influence on ClO mixing ratios.
Avallone et al. (1993) found in a comparison of ClO in situ balloon measurements
5
and model simulations a good agreement, except below 20 km altitude, where ob-served ClO is greater by as much as a factor of four. A mechanism responsible for maintaining these high ClO mixing ratios was at that time unclear, whereas reaction
rates and absorption cross-sections are taken fromDeMore et al.(1992). In our study,
we found no discrepancies below 20 km altitude between measured and simulated ClO
10
mixing ratios using reaction rate constants and absorption cross-sections from current
standard recommendations (Sander et al.,2002). However in our study, the simulated
ClO mixing ratios underestimate the measurements by a factor of approximately two at 650 K (≈26 km altitude).
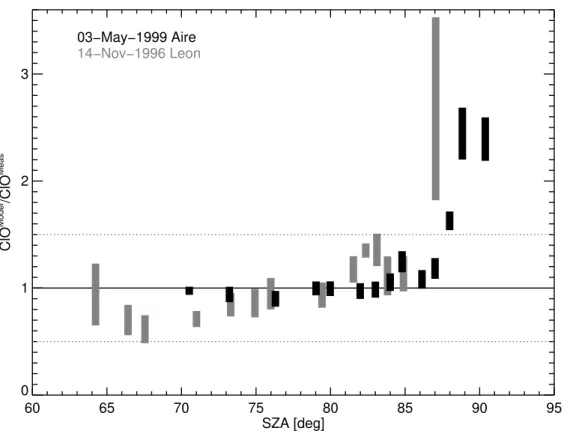
3.3. SZA dependence of simulated ClO to measured ClO
15
The deviation of simulated ClO (ClOModel) to measured ClO (ClOMeas) is analyzed as a
function of the SZA. For this purpose, the measured ClO mixing ratios were averaged
in SZA intervals of 0.5◦. The average properties of these SZA intervals are shown in
Table5. To take into account the uncertainties of the model simulations we calculate
the ratio ClOModel/ClOMeas for each model trajectory and for all sensitivity simulations
20
shown in Figs.6and7. A tendency of the ratio ClOModel/ClOMeas to increase for SZAs
larger than 87◦ is found for the Aire flight (see Fig.9). For the Le ´on flight, we have no
ratio of ClOModel/ClOMeasfor SZAs larger than 87◦. However, for measurements at 87◦,
the ratio ClOModel/ClOMeasis also increased, in contrast to the ratio ClOModel/ClOMeasat
87◦ for the Aire flight. All other ratios ClOModel
/ClOMeas are in the interval 1.0±0.5
25
including the discrepancy found in the ClO daylight profile at around 650 K for the
Le ´on flight. Clearly for SZA larger than 86◦–87◦the model substantially overestimates
ACPD
5, 875–909, 2005Midlatitude ClO balloon profiles
B. Vogel et al.
Title Page Abstract Introduction Conclusions References
Tables Figures
◭ ◮
◭ ◮
Back Close
Full Screen / Esc
Print Version Interactive Discussion
EGU
evidences exist that for high solar zenith angles the stratospheric chlorine chemistry
is not completely understand. Rivi `ere et al. (2003) reported that the comparison of
nighttime balloonborne measurements of OClO and NO2in the Arctic polar vortex with
model simulations shows that some uncertainties still exist in the interaction between nitrogen and halogen species.
5
4. Summary and conclusions
We have presented two balloonborne in situ measurements of ClO conducted in the northern hemisphere midlatitudes stratosphere during the period of the maximum in total inorganic chlorine in the atmosphere. Both ClO measurements were conducted on board the TRIPLE balloon payload launched in November 1996 in Le ´on, Spain, and
10
in May 1999 in Aire sur l’Adour, France. For both flights a vertical ClO daylight and night profile could be obtained over an altitude range of approximately 15–31 km.
Using the photochemical box model version of the CLaMS model (McKenna et al.,
2002a,b) simulations along 24-h backward trajectories were presented to study the diurnal variation of ClO in the lower midlatitude stratosphere. The simulations were
ini-15
tialized with all available stratospheric measurements, together with tracer-correlations, and informations deduced from a 2-D model. The flight launched in Le ´on is charac-terized by a more complex dynamical situation (possible contribution of a mix of vortex and non-vortex air) and fewer constraints for the model calculations being available from tracer measurements in contrast to the flight launched in Aire sur l’Adour. For the
20
flight launched in Aire sur l’Adour 1999, the model simulations show a good agreement with the ClO measurements over the entire altitude range of 20–31 km and for both the day and night profile. For the flight launched in Le ´on, simulated ClO mixing ratios
likewise reproduce the measured ClO mixing ratios, except at around ≈650 K
poten-tial temperature (≈26 km altitude), where simulated ClO mixing ratios underestimate
25
ACPD
5, 875–909, 2005Midlatitude ClO balloon profiles
B. Vogel et al.
Title Page Abstract Introduction Conclusions References
Tables Figures
◭ ◮
◭ ◮
Back Close
Full Screen / Esc
Print Version Interactive Discussion
EGU
than 86–87◦ is found consistently for both flights. In summary, we conclude that no
indication can be deduced from the present ClO measurements that substantial uncer-tainties exist in midlatitude chlorine chemistry of the stratosphere with the exception of
SZAs larger than 86–87◦.
Acknowledgements. The authors gratefully acknowledge the work performed by the CNES
5
team in carrying out the balloon flights. Thanks are due to J. M. Russell III (Hampton University) and the HALOE team at NASA Langley research center for providing the HALOE V19 data, and to the UK Met Office (UKMO) for the meteorological analysis data. We thank B. Naujokat and co-workers at FU Berlin for performing the meteorological analysis for 14 November 1996 (OFP project NOVA/DATKAM, FK 01 LO9511/8). We thank I. Levin for the gas-chromatography mea-10
surements of CH4of the air samples collected by the cryogenic whole air sampler. A. Afchine, H. Franken, E. Klein, and V. Tan are acknowledged for technical support. The experimental ac-tivities were partly funded in the frame of the HALOMAX project by the European Commission and in the frame of the CHORUS project by the German Ministry of Education and Research (BMBF).
15
References
Anderson, J. G.: The Measurement of Atomic and Diatomic Radicals in the Earth’s Strato-sphere, Atmos. Technol., 9, 55–68, 1978. 877
Anderson, J. G., Margitan, J. J., and Stedman, D. H.: Atomic Chlorine and the Chlorine Monox-ide Radical in the Stratosphere: Three in situ Observations, Science, 198, 501–503, 1977. 20
877
Anderson, J. G., Grassl, H. J., Shetter, R. E., and Margitan, J. J.: Stratospheric Free Chlorine Measured by Ballon-Borne in Situ Resonance Fluorescence, J. Geophys. Res., 85, 2869– 2887, 1980. 877
Avallone, L. M., Toohey, D. W., Brune, W. H., Salawitch, R. J., Dessler, A. E., and Anderson, 25
ACPD
5, 875–909, 2005Midlatitude ClO balloon profiles
B. Vogel et al.
Title Page Abstract Introduction Conclusions References
Tables Figures
◭ ◮
◭ ◮
Back Close
Full Screen / Esc
Print Version Interactive Discussion
EGU of the inorganic chlorine budget in the lower stratosphere, J. Geophys. Res., 105, 1957–
1971, 2000. 878
Brasseur, G. and Solomon, S.: Aeronomy of the Middle Atmosphere, Reidel Publishing Com-pany, Dordrecht, NL, 1984. 886
5
Brune, W. H., Anderson, J. G., and Chan, K. R.: In-situ observations of ClO in the Antarctic: ER-2 aircraft results from 54◦S to 72◦S latitude, J. Geophys. Res., 94, 16 649–16 663, 1989.
879
Brune, W. H., Toohey, D. W., Lloyd, S. A., and Anderson, J. G.: The sunrise and sunset variation of ClO in the lower stratosphere, Geophys. Res. Lett., 17, 509–512, 1990. 878
10
Chipperfield, M.: Multiannual simulations with a three-dimensional chemical transport model, J. Geophys. Res., 104, 1781–1805, 1999. 877
DeMore, W. B., Sander, S. P., Golden, D. M., Hampson, R. F., Kurylo, M. J., Howard, C. J., Ravishankara, A. R., Kolb, C. E., and Molina, M. J.: Chemical kinetics and photochemical data for use in stratospheric modeling, JPL Publication 92-20, 1992. 888
15
Engel, A., Schmidt, U., and Stachnik, R. A.: Partitioning between chlorine reservoir species deduced from observations in the Arctic winter stratosphere, J. Atmos. Chem., 27, 107–126, 1997. 879
Engel, A., Schmidt, U., Sturges, W. B., Penkett, S., Pfeilsticker, K., Platt, U., Stroh, F., Schiller, C., M ¨uller, R., McKenna, D., Ovarlez, J., Camy-Peyret, C., Pirre, M., and Renard, J. B.: 20
HALOMAX, Mid and high latitude stratospheric distribution of long and short lived halogen species during the maximum of the chlorine loading, Final Report, CEC Contract, ENV4-CT97-0524, 1999. 896
Feist, D. G., Aellig, C. P., K ¨ampfer, N., Solomon, P. M., Barrett, J. W., Zoonematkermani, S., Hartogh, P., Jarchow, C., and Waters, J. W.: Validation of stratospheric ClO measurements 25
from the Millimeter-wave Atmospheric Sounder (MAS), J. Geophys. Res., 105, 9053–9062, 2000. 877
Gidel, L. T., Crutzen, P. J., and Fishman, J.: A two-dimensional photochemical model of the atmosphere; 1: Chlorocarbon emissions and their effect on stratospheric ozone, J. Geophys. Res., 88, 6622–6640, 1983. 882,896
30
ACPD
5, 875–909, 2005Midlatitude ClO balloon profiles
B. Vogel et al.
Title Page Abstract Introduction Conclusions References
Tables Figures
◭ ◮
◭ ◮
Back Close
Full Screen / Esc
Print Version Interactive Discussion
EGU 2002, J. Geophys. Res., 109, D11307, 2004. 877
Grooß, J.-U.: Modelling of Stratospheric Chemistry based on HALOE/UARS Satellite Data, PhD thesis, University of Mainz, 1996. 882,896
Grooß, J.-U., G ¨unther, G., Konopka, P., M ¨uller, R., McKenna, D. S., Stroh, F., Vogel, B., Engel, 5
A., M ¨uller, M., Hoppel, K., Bevilacqua, R., Richard, E., Webster, C. R., Elkins, J. W., Hurst, D., Romashkin, P. A., and Baumgardner, D. G.: Simulation of ozone depletion in spring 2000 with the Chemical Lagrangian Model of the Stratosphere (CLaMS), J. Geophys. Res., 107, 8295, doi:10.1029/2001JD000456, 2002. 896
King, J. C., Brune, W. H., Toohey, D. W., Rodriguez, J. M., Starr, W. L., and Vedder, J. F.: 10
Measurements of ClO and O3 from 21◦ to 61◦N in the lower stratosphere during February 1988: Implications for heterogeneous chemistry, Geophys. Res. Lett., 18, 2273–2276, 1991. 877
Knudsen, B. M. and Grooß, J. U.: Northern midlatitude stratospheric ozone dilution in spring modeled with simulated mixing, J. Geophys. Res., 105, 6885–6890, 2000. 877
15
Manney, G. L., Lahoz, W. A., Swinbank, R., O’Neill, A., Connew, P. M., and Zurek, R. W.: Simulation of the December 1998 stratospheric major warming, Geophys. Res. Lett., 26, 2733–2736, 1999. 880
Marchand, M., Bekki, S., Lef `evre, F., Hauchecorne, A., Godin-Beckmann, S., and Chipper-field, M. P.: Model simulations of the northern extravortex ozone column: Influence of past 20
changes in chemical composition, J. Geophys. Res., 109, doi:10.1029/2003JD003634, 2004. 877
McKenna, D. S., Grooß, J.-U., G ¨unther, G., Konopka, P., M ¨uller, R., Carver, G., and Sasano, Y.: A new Chemical Lagrangian Model of the Stratosphere (CLaMS): Part II Formulation of Chemistry-Scheme and Initialisation, J. Geophys. Res., 107, 4256, 25
doi:10.1029/2000JD000113, 2002a. 878,882,889
McKenna, D. S., Konopka, P., Grooß, J.-U., G ¨unther, G., M ¨uller, R., Spang, R., Offermann, D., and Orsolini, Y.: A new Chemical Lagrangian Model of the Stratosphere (CLaMS): Part I For-mulation of Advection and Mixing, J. Geophys. Res., 107, 4309, doi:10.1029/2000JD000114, 2002b. 878,882,889
30
Michelsen, H. A., Manney, G. L., Gunson, M. R., and Zander, R.: Correlations of stratospheric abundances of NOy, O3, N2O, and CH4 derived from ATMOS measurements, J. Geophys. Res., 103, 28 347–28 359, 1998. 896
ACPD
5, 875–909, 2005Midlatitude ClO balloon profiles
B. Vogel et al.
Title Page Abstract Introduction Conclusions References
Tables Figures
◭ ◮
◭ ◮
Back Close
Full Screen / Esc
Print Version Interactive Discussion
EGU branching ratios in the broadband photolysis of chlorine nitrate, J. Phys. Chem., 100, 10 165–
10 178, 1996. 878,887
Osterman, G. B., Salawitch, R. J., Sen, B., Toon, G. C., Stachnik, R. A., Pickett, H. M., Margi-tan, J. J., Blavier, J.-F., and Peterson, D. B.: Balloon-borne measurements of stratospheric 5
radicals and their precursors: Implications for the production and loss of ozone, Geophys. Res. Lett., 24, 1107–1110, 1997. 877
Pierson, J. M., McKinney, K. A., Toohey, D. W., Margitan, J., Schmidt, U., Engel, A., and Newman, P. A.: An investigation of ClO photochemistry in the chemically perturbed Arctic vortex, J. Atmos. Chem., 32, 61–81, 1999. 879,882
10
Ricaud, P., Chipperfield, M. P., Waters, J. W., Russel III, J. M., and Roche, A. E.: Temporal evolution of chlorine monoxide in the middle stratosphere, J. Geophys. Res., 105, 9053– 9062, 2000. 877
Rivi `ere, E. D., Pirre, M., Berthet, G., Renard, J.-B., Taupin, F. G., Huret, N., Chartier, M., Knudsen, B., and Lef `evre, F.: On the interaction between nitrogen and halogen species in 15
the Artic polar vortex during THESEO and THESEO 2000, J. Geophys. Res., 108, 8311, doi:10.1029/2002JD002087, 2003. 889
Russell, J. M., Gordley, L. L., Park, J. H., Drayson, S. R., Tuck, A. F., Harries, J. E., Cicerone, R. J., Crutzen, P. J., and Frederick, J. E.: The Halogen Occultation Experiment, J. Geophys. Res., 98, 10 777–10 797, 1993. 882,884,896
20
Salawitch, R. J., Wofsy, S., Wennberg, P. O., Cohen, R. C., Anderson, J. G., Fahey, D. W., Gao, R. S., Keim, E. R., Woodbridge, E. L., Stimpfle, R. M., Koplow, P., Kohn, D. W., Webster, C. R., May, R. D., Pfister, L., Gottlieb, E. W., Michelsen, H. A., Yue, G. K., Prather, M. J., Wilson, J. C., Brock, C. A., Jonsson, H. H., Dye, J. E., Baumgardner, D., Proffitt, M. H., Loewenstein, M., Podolske, J. R., Elkins, J. W., Dutton, G. S., Hintsa, E. J., Dessler, A. E., 25
Weinstock, E. M., Kelly, K. K., Boering, K. A., Daube, B. C., Chan, K. R., and Bowen, S. W.: The diurnal variation of hydrogen, nitrogen, and chlorine radicals: implications for the heterogeneous production of HNO2, Geophys. Res. Lett., 21, 2551–2554, 1994. 878 Sander, S. P., Friedl, R. R., Golden, D. M., Kurylo, M. J., Huie, R. E., Orkin, V. L., Moortgat,
G. K., Ravishankara, A. R., Kolb, C. E., Molina, M. J., and Finlayson-Pitts, B. J.: Chemical 30
kinetics and photochemical data for use in stratospheric studies, JPL Publication 02-25, 2002. 882,887,888
ACPD
5, 875–909, 2005Midlatitude ClO balloon profiles
B. Vogel et al.
Title Page Abstract Introduction Conclusions References
Tables Figures
◭ ◮
◭ ◮
Back Close
Full Screen / Esc
Print Version Interactive Discussion
EGU Stroh, F., Voigt, C., and V ¨omel, H.: Dehydration in the Arctic stratosphere during the
THE-SEO2000/SOLVE campaigns, J. Geophys. Res., 107, 8293, doi:10.1029/2001JD000463, 2002. 879
Schmidt, U., Kulessa, G., Klein, E., R ¨oth, E.-P., Fabian, P., and Borchers, R.: Intercomparison 5
of balloon-borne cryogenic whole air samplers during the MAP/GLOBUS 1983 campaign, Planet. Space Sci., 35, 647–656, 1987. 879
Schmidt, U., Bauer, R., Engel, A., Borchers, R., and Lee, J.: The variation of available chlorine Cly in the Arctic polar vortex during EASOE, Geophys. Res. Lett., 21, 1215–1218, 1994. 879
10
Stimpfle, R. M., Koplow, J. P., Cohen, R. C., Kohn, D. W., Wennberg, P. O., Judah, D. M., Toohey, D. W., Avallone, L. M., Anderson, J. G., Salawitch, R. J., Woodbridge, E. L., Webster, C. R., May, R. D., Proffitt, M. H., Aiken, K., Margitan, J., Loewenstein, M., Podolske, J. R., Pfister, L., and Chan, K. R.: The response of ClO radical concentrations to variations in NO2 radical concentrations in the lower stratosphere, Geophys. Res. Lett., 21, 2543–2546, 1994. 15
877,878,887
Stimpfle, R. M., Cohen, R. C., Bonne, G. P., Voss, P. B., Perkins, K. K., Koch, L. C., Anderson, J. G., Salawitch, R. J., Lloyd, S. A., Gao, R. S., DelNegro, L. A., Keim, E. R., and Bui, T. P.: The coupling of ClONO2, ClO and NO2in the lower stratosphere from in situ observations using the NASA ER-2 aircraft, J. Geophys. Res., 104, 26 705–26 714, 1999. 878
20
Sugita, T., Kondo, Y., Nakajima, H., Schmidt, U., Engel, A., Oelhaf, H., Wetzel, G., Koike, M., and Newman, P. A.: Denitrification observed inside the Arctic vortex in February 1995, J. Geophys. Res., 103, 16 221–16 233, 1998. 896
Toohey, D. W., Brune, W. H., Chan, K. R., and Anderson, J. G.: In situ measurements of midlatitude ClO in winter, J. Geophys. Res., 18, 21–24, 1991. 877
25
Toohey, D. W., Avallone, L. M., Allen, N. T., Demusz, J. N., Hazen, J. N., Hazen, N. L., and Anderson, J. G.: The performance of a new instrument for in situ measurements of ClO in the lower stratosphere, Geophys. Res. Lett., 20, 1791–1794, 1993a. 877
Toohey, D. W., Avallone, L. M., Lait, L. R., Newman, P. A., Schoeberl, M. R., Fahey, D. W., Woodbrige, E. L., and Anderson, J. G.: The seasonal evolution of reactive chlorine in the 30
northern hemisphere stratosphere, Science, 261, 1134–1136, 1993b. 877
ACPD
5, 875–909, 2005Midlatitude ClO balloon profiles
B. Vogel et al.
Title Page Abstract Introduction Conclusions References
Tables Figures
◭ ◮
◭ ◮
Back Close
Full Screen / Esc
Print Version Interactive Discussion
EGU chlorine activation and ozone loss observed by the Odin Sub-Millimetre Radiometer,
Geo-phys. Res. Lett., 31, doi:10.1029/2003GL019089, 2004. 877
Vogel, B., M ¨uller, R., Deshler, T., Grooß, J.-U., Karhu, J., McKenna, D. S., M ¨uller, M., Toohey, D., Toon, G. C., and Stroh, F.: Vertical profiles of activated ClO and ozone loss in the Arctic 5
vortex in January and March 2000: In situ observations and model simulations, J. Geophys. Res., 108, 8334, doi:10.1029/2002JD00256, 2003. 879
Wang, H. J., Cunnold, D. M., Thomason, L. W., Zawodny, J. M., and Bodeker, G. E.: Assessment of SAGE version 6.1 ozone data quality, J. Geophys. Res., 105, 4691, doi:10.1029/2002JD002418, 2002. 877
10
Wennberg, P. O., Cohen, R. C., Stimpfle, R. M., Fahey, D. W., Webster, C. R., Salawitch, R. J., Proffitt, M. H., Chan, K. R., Anderson, J. G., and Wofsy, S. C.: The removal of lower stratospheric ozone by free radical catalysis: In situ measurements of OH, HO2, NO, NO2, ClO, and BrO, Science, 266, 398–404, 1994. 877
WMO: Scientific assessment of Ozone Depletion: 2002, Report No. 47, Geneva, Switzerland, 15
2003. 876,877,878
Woyke, T., M ¨uller, R., Stroh, F., McKenna, D. S., Engel, A., Margitan, J. J., Rex, M., and Carslaw, K. S.: A test of our understanding of the ozone chemistry in the Arctic polar vortex 555
ACPD
5, 875–909, 2005Midlatitude ClO balloon profiles
B. Vogel et al.
Title Page Abstract Introduction Conclusions References
Tables Figures
◭ ◮
◭ ◮
Back Close
Full Screen / Esc
Print Version Interactive Discussion
EGU
Table 1. Sources of the major chemical species used to initialize the model simulations for
the flight on 5 May 1999 launched in Aire sur l’Adour and for the flight on 14 November 1996 launched in Le ´on.
Species Aire sur l’Adour 1999 Le ´on 1996
CH4 cryogenic whole air samplera HALOE (1–5 Nov. and 15–22 Nov. 1996)f N2O cryogenic whole air samplera CH4–N2O correlationg
Cly cryogenic whole air samplera N2O–Clycorrelationh HCl HALOE (25–27 April 1999)b HALOEf
ClONO2 Cly–HCl Cly–HCl
ClO as zeroc as zeroc
NOy N2O–NOycorrelationd N2O–NOycorrelationd
NOx=NO+NO2 HALOEb HALOEf
HNO3+2×N2O5 =NOy-ClONO2-NOxe =NOy-ClONO2-NOxe
O3 ozone sondea HALOEf
H2O FISHa HALOEf
all other Mainz 2-D model Mainz 2-D model (Gidel et al.,1983;Grooß,1996)
aConducted on board TRIPLE (cf. Sect. 2).bObservations of the Halogen Occultation Experiment (HALOE) on board the UARS satellite (Russell et al.,
1993) in northern hemisphere midlatitudes (within 35◦N and 50◦N) are only available between 25 and 27 April 1999. A mean vertical profile is derived.c
ClO and all other chlorine species, except ClONO2and HCl were initialized as zero.dThis correlation (Sugita et al.,1998) was derived from measurements
by the ATMOS (Atmospheric Trace Molecule Spectroscopy) instrument on board the space shuttle during the ATLAS 3 mission within a period of 10 days in early November 1994. The correlation is valid for high and midlatitudes.eAs upper and lower limit for the partitioning, we assume a ratio of HNO3:2×N2O5
of 9:1 (For Le ´on: case 1, 2) and of 1:9 (For Le ´on: case 3 for midlatitude conditions and case 4 for vortex conditions), respectively. All other species of the nitrogen family were initialized as zero.fA mean profile derived from HALOE measurements between 1–5 November and 15–22 November 1996 within 35◦N
and 50◦N for midlatitude (case 1, 3) and vortex (case 2, 4) air masses (cf. Sect. 3.2).gA CH
4–N2O correlation is used derived from measurements of the
ATMOS instrument conducted during different missions in March 1992, April 1993, and November 1994 (Michelsen et al.,1998) for midlatitudes (case 1, 4). For vortex conditions (case 2, 4), we employed the CH4–N2O correlation (Grooß et al.,2002) to determine N2O derived from measurements conducted on
board the ER-2 aircraft and on board the TRIPLE payload during the Arctic winter 1999/2000 inside the vortex. Above 25 km altitude (the maximum altitude of the TRIPLE flights), a CH4–N2O correlation is used derived from ATMOS measurements for polar latitudes (Michelsen et al.,1998).hTo infer Cly, we used
for midlatitude and vortex conditions the N2O–Clycorrelation derived from measurements of the cryogenic whole air sample on board the TRIPLE payload
ACPD
5, 875–909, 2005Midlatitude ClO balloon profiles
B. Vogel et al.
Title Page Abstract Introduction Conclusions References
Tables Figures
◭ ◮
◭ ◮
Back Close
Full Screen / Esc
Print Version Interactive Discussion
EGU
Table 2.Mixing ratios of the major chemical species used to initialize the model simulations for
the flight on 5 May 1999 launched in Aire sur l’Adour for the 9th cycle (case a).
THETA 600 600 700 700 800 800 850 850 866 886 875 874 874 871 871 trajnoa 01 02 03 04 05 06 07 08 09 10 11 12 13 14 15 SZA,◦b 91.8 70.5 90.4 73.2 88.8 76.3 88.0 79.0 80.0 82.0 83.0 84.0 84.8 86.1 87.0 CH4, ppmv 1.29 1.29 1.01 1.01 0.77 0.77 0.67 0.67 0.67 0.67 0.67 0.67 0.67 0.67 0.67
Cly, ppbv 2.11 2.11 2.88 2.88 3.20 3.20 3.32 3.32 3.32 3.32 3.32 3.32 3.32 3.32 3.32
HCl, ppbv 1.37 1.39 1.84 1.85 2.14 2.14 2.26 2.26 2.31 2.38 2.34 2.34 2.34 2.33 2.33 ClO, pptv 2.93 65.50 14.63 99.66 36.35 130.52 52.35 137.90 130.39 113.31 103.25 94.14 85.85 71.96 63.18 ClONO2, ppbv 0.74 0.66 1.02 0.92 1.02 0.92 0.99 0.90 0.86 0.82 0.86 0.87 0.88 0.90 0.91
NOy, ppbv 7.09 7.09 12.34 12.35 16.01 16.01 16.72 16.73 16.73 16.73 16.73 16.73 16.73 16.73 16.73
NO, ppbv 0.24 0.83 1.44 2.22 2.98 3.76 3.55 4.21 4.34 4.45 4.27 4.19 4.15 3.97 3.88 NO2, ppbv 1.44 0.99 3.03 2.52 4.40 3.96 4.71 4.38 4.46 4.59 4.55 4.57 4.58 4.67 4.74
HNO3, ppbv 3.71 3.79 4.54 4.67 4.09 4.21 3.54 3.59 3.31 2.97 3.14 3.16 3.15 3.19 3.17
N2O5, ppbv 0.40 0.34 1.07 0.93 1.69 1.51 1.90 1.76 1.82 1.90 1.90 1.91 1.93 1.94 1.95
O3, ppmvc 4.46 4.46 5.61 5.61 6.36 6.36 6.82 6.82 6.82 6.82 6.82 6.82 6.82 6.82 6.82
a
number of trajectory
b
SZA at the end of the trajectory
c
ACPD
5, 875–909, 2005Midlatitude ClO balloon profiles
B. Vogel et al.
Title Page Abstract Introduction Conclusions References
Tables Figures
◭ ◮
◭ ◮
Back Close
Full Screen / Esc
Print Version Interactive Discussion
EGU
Table 3.Mixing ratios of the major chemical species used to initialize the model simulations for
the flight on 14 November 1996 launched in Le ´on for midlatitude air masses (case 1) and for the 9th cycle.
THETA 500 500 600 600 650 650 700 750 800 800 850 850 900 900 trajnoa 01 02 03 04 05 06 07 08 09 10 11 12 13 14 SZA,◦b
87.1 64.2 84.9 66.4 83.8 67.6 83.1 82.4 81.5 71.0 79.4 73.3 76.0 74.9 CH4, ppmv 1.29 1.29 1.14 1.14 1.13 1.13 1.13 1.11 1.08 1.08 1.02 1.02 0.96 0.96
Cly, ppbv 1.80 1.80 2.53 2.53 2.57 2.57 2.60 2.67 2.78 2.78 2.97 2.97 3.10 3.10
HCl, ppbv 1.35 1.39 1.64 1.66 1.72 1.73 1.83 1.98 2.15 2.15 2.37 2.37 2.57 2.56 ClO, pptv 9.83 46.94 43.57 118.82 54.84 127.62 59.79 64.42 70.45 130.12 88.49 128.21 113.73 120.94 ClONO2, ppbv 0.43 0.36 0.84 0.73 0.79 0.69 0.70 0.62 0.55 0.48 0.51 0.46 0.42 0.41
NOy, ppbv 6.38 6.38 10.10 10.10 10.35 10.35 10.56 11.05 11.87 11.87 13.50 13.50 14.78 14.78
NO, ppbv 0.14 0.30 0.40 0.64 0.73 0.98 1.23 1.93 2.98 3.34 4.23 4.55 5.66 5.72 NO2, ppbv 0.23 0.27 0.56 0.70 0.89 1.01 1.31 1.79 2.34 2.39 2.94 2.98 3.43 3.43
HNO3, ppbv 5.34 5.24 7.58 7.40 6.91 6.81 5.90 4.89 3.79 3.80 3.20 3.14 2.46 2.46
N2O5, ppbv 0.09 0.08 0.30 0.26 0.46 0.38 0.66 0.87 1.07 0.90 1.28 1.15 1.38 1.35
O3, ppmvc 2.12 2.12 4.54 4.54 5.44 5.44 6.00 6.41 6.66 6.66 6.79 6.79 6.78 6.78
a
number of trajectory
b
SZA at the end of the trajectory
c
ACPD
5, 875–909, 2005Midlatitude ClO balloon profiles
B. Vogel et al.
Title Page Abstract Introduction Conclusions References
Tables Figures
◭ ◮
◭ ◮
Back Close
Full Screen / Esc
Print Version Interactive Discussion
EGU
Table 4.Mixing ratios of the major chemical species used to initialize the model simulations for
the flight on 14 November 1996 launched in Le ´on for vortex air masses (case 2) and for the 9th cycle.
THETA 500 500 600 600 650 650 700 750 800 800 850 850 900 900 trajnoa 01 02 03 04 05 06 07 08 09 10 11 12 13 14 SZA,◦b
87.1 64.2 84.9 66.4 83.8 67.6 83.1 82.4 81.5 71.0 79.4 73.3 76.0 74.9 CH4, ppmv 1.19 1.19 0.95 0.95 0.84 0.84 0.73 0.64 0.58 0.58 0.55 0.55 0.52 0.52
Cly, ppbv 2.34 2.34 2.96 2.96 3.14 3.14 3.26 3.31 3.33 3.33 3.33 3.33 3.33 3.33
HCl, ppbv 1.60 1.63 2.04 2.06 2.24 2.26 2.39 2.45 2.49 2.48 2.52 2.52 2.59 2.58 ClO, pptv 15.47 66.49 39.13 100.56 46.97 102.47 54.86 67.65 85.01 157.51 112.75 164.60 155.11 164.97 ClONO2, ppbv 0.73 0.63 0.87 0.78 0.85 0.77 0.81 0.79 0.75 0.67 0.69 0.63 0.58 0.57
NOy, ppbv 8.96 8.96 13.32 13.32 15.15 15.15 16.39 16.69 16.23 16.23 15.97 15.97 15.68 15.68
NO, ppbv 0.14 0.32 0.64 0.97 1.53 1.93 2.71 3.84 4.86 5.27 5.61 5.94 6.38 6.43 NO2, ppbv 0.27 0.35 0.80 0.94 1.46 1.55 2.17 2.70 3.08 3.13 3.32 3.39 3.52 3.52
HNO3, ppbv 7.50 7.36 10.10 9.85 9.92 9.76 8.83 7.13 5.12 5.11 3.79 3.71 2.64 2.64
N2O5, ppbv 0.12 0.11 0.40 0.34 0.65 0.52 0.90 1.08 1.19 0.99 1.26 1.13 1.26 1.24
O3, ppmvc 2.50 2.50 4.03 4.03 4.21 4.21 4.39 4.67 5.07 5.07 5.43 5.43 5.74 5.74
a
number of trajectory
b
SZA at the end of the trajectory
c
ACPD
5, 875–909, 2005Midlatitude ClO balloon profiles
B. Vogel et al.
Title Page Abstract Introduction Conclusions References
Tables Figures
◭ ◮
◭ ◮
Back Close
Full Screen / Esc
Print Version Interactive Discussion
EGU
Table 5.Average properties of the SZA intervals for the ClO measurements as shown in Fig.9.
trajno SZAa Nh ClO [pptv]c S(ClO) [pptv]d rel. S(ClO) [%] Aire sur l’Adour 1999
1 91.8 18 0.3 0.9 313.3
2 70.5 17 68.7 2.1 3.1
3 90.4 18 6.6 1.4 20.9
4 73.2 16 113.8 4.0 3.5
5 88.8 18 16.5 2.3 13.7
6 76.3 16 157.7 3.8 2.4
7 88.0 18 34.0 3.3 9.8
8 79.0 17 147.9 4.5 3.1
9 80.0 17 140.9 3.5 2.5
10 82.0 17 126.1 3.8 3.0
11 83.0 17 113.4 9.1 8.1
12 84.0 17 96.7 5.1 5.3
13 84.8 14 74.8 7.3 9.7
14 86.1 16 72.4 4.4 6.1
15 87.0 18 58.1 5.2 8.9
Le ´on 1996
1 87.1 18 4.3 1.1 24.2
2 64.2 36 53.4 2.0 3.7
3 84.9 18 33.5 1.8 5.3
4 66.4 30 140.3 1.2 0.9
5 83.8 18 42.3 1.1 2.7
6 67.6 26 170.7 2.2 1.3
7 83.1 18 39.7 1.4 3.6
8 82.4 18 47.9 2.7 5.6
9 81.5 18 65.7 3.9 5.9
10 71.0 23 201.1 2.8 1.4
11 79.4 19 107.4 4.5 4.2
12 73.3 21 172.9 2.4 1.4
13 76.0 19 141.7 8.1 5.7
14 74.9 19 166.2 3.1 1.8
a
Center of the SZA bins of±0.25◦ bNumber of elements within bin cAverage ClO mixing ratio within bin dStandard deviation of the mean: S(ClO)=r 1
N(N−1)
PN
ACPD
5, 875–909, 2005Midlatitude ClO balloon profiles
B. Vogel et al.
Title Page Abstract Introduction Conclusions References Tables Figures ◭ ◮ ◭ ◮ Back Close
Full Screen / Esc
Print Version Interactive Discussion EGU PV −135 −90 −45 0 45 90 135 180 30 40 50 60 70 80 90 UKMO Global Model Analysis VALID AT 12Z ON 14/ 11/ 1996 LEVEL: 700. K
−135 −90 −45 0 45 90 135 180 30 40 50 60 70 80 90 0 50 100 150 200 250 300 350 400 10^(−6)*K*m^2/(kg*s)
represents 50 m/s
PV −135 −90 −45 0 45 90 135 180 30 40 50 60 70 80 90 UKMO Global Model Analysis VALID AT 12Z ON 3/ 5/ 1999 LEVEL: 700. K
−135 −90 −45 0 45 90 135 180 30 40 50 60 70 80 90 −25 0 25 50 75 100 150 175 200 10^(−6)*K*m^2/(kg*s)
represents 50 m/s
Fig. 1. Potential vorticity (1 PVU=10−6
K m2kg−1
s−1
ACPD
5, 875–909, 2005Midlatitude ClO balloon profiles
B. Vogel et al.
Title Page Abstract Introduction Conclusions References
Tables Figures
◭ ◮
◭ ◮
Back Close
Full Screen / Esc
Print Version Interactive Discussion
EGU 14−Nov−1996 Leon
50 60 70 80 90 100
SZA [deg]
79°
↓ 74↓°
7 8 9 10 11
Universal Time [h] 200
210 220 230
Temperature [K]
03−May−1999 Aire 87°
↓ 80↓°
100 10
Pressure [hPa]
200 5
4 5 6 7 8
Universal Time [h]
Fig. 2. Meteorological parameters for the flights of the TRIPLE payload on 14 November 1996
ACPD
5, 875–909, 2005Midlatitude ClO balloon profiles
B. Vogel et al.
Title Page Abstract Introduction Conclusions References
Tables Figures
◭ ◮
◭ ◮
Back Close
Full Screen / Esc
Print Version Interactive Discussion
EGU 0 100 200 300 400
ClO [pptv] 400
500 600 700 800 900 1000
Potential Temperature [K]
ClO Ascent ClO Descent Ozone 14−Nov−96 Ozone 15−Nov−96
0 2 Ozone [ppmv]4 6 8
Leon 14−Nov−1996
0 100 200 300 400 ClO [pptv]
400 500 600 700 800 900 1000
Potential Temperature [K]
ClO Ascent ClO Descent Ozone
0 2Ozone [ppmv]4 6 8
Aire 3−May−1999
Fig. 3. Measured ClO mixing ratios as a function of the potential temperature of the balloon
flights launched on 14 November 1996 in Le ´on (left) and launched on 3 May 1999 in Aire sur l’Adour (right). The 1σ accuracy for the ClO measurements is approximately 20–23% (gray
ACPD
5, 875–909, 2005Midlatitude ClO balloon profiles
B. Vogel et al.
Title Page Abstract Introduction Conclusions References Tables Figures ◭ ◮ ◭ ◮ Back Close
Full Screen / Esc
Print Version Interactive Discussion EGU 875 K 40 60 80 100 120 SZA Cycle No.: 000 001 002 003 004 005 006 007 008 009 0.0 0.1 0.2 0.3 0.4 0.5 ClO [ppbv] 0.6 0.8 1.0 1.2 ClONO 2 [ppbv] 2.00 2.10 2.20 2.30 HCl [ppbv] 0.00 0.05 0.10 0.15 HOCl [ppbv] 3 4 5 6 7 8 HNO 3 [ppbv] 6 8 10 12 NO+NO 2 [ppbv] 06:00:00
02.05.99 12:00:0002.05.99 18:00:0002.05.99 00:00:0003.05.99 06:00:0003.05.99
Time [UTC] 0.0 0.5 1.0 1.5 2.0 N2O5 [ppbv]
Fig. 4. The convergence of
ACPD
5, 875–909, 2005Midlatitude ClO balloon profiles
B. Vogel et al.
Title Page Abstract Introduction Conclusions References Tables Figures ◭ ◮ ◭ ◮ Back Close
Full Screen / Esc
Print Version Interactive Discussion EGU 9th cycle 0 100 200 300 ClO [pptv] Trajectory: 600K 700K 800K 850K 875K 0.6 0.7 0.8 0.9 1.0 ClONO 2 [ppbv] 2 4 6 8 10 12 NO2 [ppbv] 0 10 20 30 40 50 60 HO2 [pptv] 0 2 4 6 8 10 12 BrO [pptv] 4.5 5.0 5.5 6.0 6.5 7.0 O3 [ppmv] 12:00:00
02.05.99 18:00:0002.05.99 00:00:0003.05.99 06:00:0003.05.99 −20 0 20 40 60 O3 change (ppbv/h)
Fig. 5. For the flight launched
ACPD
5, 875–909, 2005Midlatitude ClO balloon profiles
B. Vogel et al.
Title Page Abstract Introduction Conclusions References
Tables Figures
◭ ◮
◭ ◮
Back Close
Full Screen / Esc
Print Version Interactive Discussion
EGU
Aire 03−May−99
65 70 75 80 85 90 95
SZA [deg] 0
50 100 150 200 250
ClO [pptv]
Float (≈ 865−885K)
← →
ClO Measurement
Model runs case a fixed ozone case b free ozone
600 K
→ 700 K
→
800 K
→
850 K
→ ←
850 K
←
800 K
←
700 K
←
600 K
Fig. 6. Simulated ClO mixing ratios as a function of SZA compared to measured ClO mixing
ACPD
5, 875–909, 2005Midlatitude ClO balloon profiles
B. Vogel et al.
Title Page Abstract Introduction Conclusions References
Tables Figures
◭ ◮
◭ ◮
Back Close
Full Screen / Esc
Print Version Interactive Discussion
EGU
Leon 14−Nov−96
65 70 75 80 85 90
SZA [deg] 0
50 100 150 200 250 300
ClO [pptv]
Float
(←≈ 870K−900K)→ ClO MeasurementModel runs: case 1 (midlat) case 2 (vortex) case 3 (midlat) case 4 (vortex)
500 K
600 K
→
650 K
→
800 K
→
850 K
→
←
850 K
←
800 K
←
750 K
←
700 K
←
650 K
←
600 K
←
500 K
Fig. 7. Simulated ClO mixing ratios as a function of SZA compared to measured ClO mixing
ACPD
5, 875–909, 2005Midlatitude ClO balloon profiles
B. Vogel et al.
Title Page Abstract Introduction Conclusions References Tables Figures ◭ ◮ ◭ ◮ Back Close
Full Screen / Esc
Print Version Interactive Discussion EGU 9th cycle 0 100 200 300 ClO [pptv] Trajectory: 500K case 1 600K 700K 800K 900K
500K case 2 600K 700K 800K 900K 0.3 0.4 0.5 0.6 0.7 0.8 0.9 ClONO 2 [ppbv] 0 2 4 6 8 10 12 NO2 [ppbv] 0 5 10 15 20 25 30 HO2 [pptv] 0 2 4 6 8 10 12 14 BrO [pptv] 2 3 4 5 6 7 O3 [ppmv] 12:00:00
13.11.96 18:00:0013.11.96 00:00:0014.11.96 06:00:0014.11.96
Time [UTC] −20 0 20 40 O3 change (ppbv/h)
Fig. 8.For the flight launched on
ACPD
5, 875–909, 2005Midlatitude ClO balloon profiles
B. Vogel et al.
Title Page Abstract Introduction Conclusions References
Tables Figures
◭ ◮
◭ ◮
Back Close
Full Screen / Esc
Print Version Interactive Discussion
EGU
60 65 70 75 80 85 90 95
SZA [deg] 0
1 2 3
ClO
Model
/ClO
Meas
03−May−1999 Aire
14−Nov−1996 Leon
Fig. 9. The ratio of simulated to measured ClO mixing ratios as a function of SZA. The
mea-sured ClO mixing ratios are averaged in SZA intervals of 0.5◦centered at the SZA endpoint of
each trajectory (cf. Table5). The ratio ClOModel/ClOMeasis calculated for each model trajectory and for all sensitivity simulations shown in Figs.6 and7. The relative measurement error of ClOMeas(=ClO) for 92◦ SZA for the flight launched in Le ´on is very large (cf. Table5) and is not
shown here. All the ratios ClOModel/ClOMeasare in the interval 1.0±0.5 (dotted line), except for