ACPD
4, 7089–7120, 2004Ozone loss
A. D. Robinson et al.
Title Page Abstract Introduction Conclusions References
Tables Figures
◭ ◮
◭ ◮
Back Close
Full Screen / Esc
Print Version
Interactive Discussion
©EGU 2004
Atmos. Chem. Phys. Discuss., 4, 7089–7120, 2004 www.atmos-chem-phys.org/acpd/4/7089/
SRef-ID: 1680-7375/acpd/2004-4-7089 © European Geosciences Union 2004
Atmospheric Chemistry and Physics Discussions
Ozone loss derived from balloon-borne
tracer measurements and the SLIMCAT
CTM
A. D. Robinson1, G. A. Millard1, F. Danis1, M. Guirlet1, N. R. P. Harris1, A. M. Lee1, J. D. McIntyre1, J. A. Pyle1, 2, J. Arvelius3, S. Dagnesjo3, S. Kirkwood3,
H. Nilsson3, D. W. Toohey4, T. Deshler5, F. Goutail6, J.-P. Pommereau6, J. W. Elkins7, F. Moore7, E. Ray7, U. Schmidt8, A. Engel8, and M. Mueller8
1
Centre for Atmospheric Science, Department of Chemistry, Cambridge University, Cambridge CB2 1EW, UK
2
NCAS-ACMSU, Department of Chemistry, Cambridge University, Cambridge CB2 1EW, UK 3
Swedish Institute of Space Physics (IRF), Kiruna Division, Box 812, SE-981 28 Kiruna, SWEDEN
4
Program in Atmospheric and Oceanic Sciences, 311 UCB, University of Colorado, Boulder, CO 80309-0311, USA
5
Department of Atmospheric Science, University of Wyoming, P.O. Box 3038, Laramie, WY 82071, USA
6
Service d’Aeronomie, CNRS, Verri `eres le Buisson, France 7
Climate Monitoring and Diagnostics Laboratory, NOAA, Boulder, Colorado 8
University of Frankfurt, Germany
ACPD
4, 7089–7120, 2004Ozone loss
A. D. Robinson et al.
Title Page Abstract Introduction Conclusions References
Tables Figures
◭ ◮
◭ ◮
Back Close
Full Screen / Esc
Print Version
Interactive Discussion
©EGU 2004
Abstract
Balloon-borne measurements of CFC-11 (on flights of the DIRAC in situ gas chro-matograph and the DESCARTES grab sampler), ClO and O3 were made during the 1999/2000 winter as part of the SOLVE-THESEO 2000 campaign. Here we present the CFC-11 data from nine flights and compare them first with data from other instru-5
ments which flew during the campaign and then with the vertical distributions calculated by the SLIMCAT 3-D CTM. We calculate ozone loss inside the Arctic vortex between late January and early March using the relation between CFC-11 and O3measured on the flights, the peak ozone loss (1200 ppbv) occurs in the 440–470 K region in early March in reasonable agreement with other published empirical estimates. There is 10
also a good agreement between ozone losses derived from three independent balloon tracer data sets used here. The magnitude and vertical distribution of the loss derived from the measurements is in good agreement with the loss calculated from SLIMCAT over Kiruna for the same days.
1. Introduction 15
Measurements of long-lived tracers such as N2O, CH4 and CFC-11 can be used to study a number of aspects of stratospheric transport and chemistry. In the Arctic region, these include the descent of air in the polar vortices (Schoeberl et al., 1990; Bauer et al., 1994) and mixing processes both at the vortex edge (Waugh et al., 1997; Pyle et al., 1994) and in the lowermost stratosphere (Bregman et al., 2000). Further, changes 20
in the observed tight relations between long-lived tracers and ozone have been used to estimate the magnitude of chemical ozone loss in the Arctic vortex (Proffitt et al., 1990, 1993; M ¨uller et al., 2001 and references therein). Other studies of ozone loss use different techniques (Rex et al., 1999; Goutail et al., 1999; Manney et al., 1997; Knudsen et al., 1998; Lucic et al., 1999 and references therein). Brief descriptions 25
ACPD
4, 7089–7120, 2004Ozone loss
A. D. Robinson et al.
Title Page Abstract Introduction Conclusions References
Tables Figures
◭ ◮
◭ ◮
Back Close
Full Screen / Esc
Print Version
Interactive Discussion
©EGU 2004
et al. (2002), together with a comparison of some of their results. A discussion of the results obtained in this study with other estimates of ozone loss in the 1999/2000 winter is discussed in Sect. 5 Conclusions.
In situ measurements of tracers have often involved large grab samplers which can be flown only infrequently. In response to this limitation two new lightweight instruments 5
have been developed recently by the University of Cambridge to measure CFCs: the in situ GC instrument DIRAC (Robinson et al., 2000) and the grab sampling instru-ment DESCARTES (Danis et al., 2000). These instruinstru-ments are easy to operate and can be flown frequently on small, inexpensive balloons as part of a co-ordinated pay-load. The instruments were flown on several occasions into the vortex core during the 10
SOLVE-THESEO 1999/2000 campaign (Newman et al., 2002) with other lightweight in-struments including the SAOZ experiment (Pommereau and Piquard, 1994) or as part of the HALOZ project to measure ClO and related species (V ¨omel et al., 2001). In this paper we present results from nine balloon flights of these instruments made during SOLVE-THESEO 2000: four flights of the DIRAC in situ gas chromatograph and five 15
flights of the DESCARTES grab-sampler.
In the first part of the paper, the instruments and the model are described. The next part presents the measured vertical profiles of CFC-11 and ozone (measured by electrochemical concentration cell (ECC) ozonesondes). The vertical profiles are then compared both with data from other instruments which flew during the campaign and 20
to profiles calculated by the SLIMCAT 3-D chemical transport model (CTM), used to study ozone loss in previous Arctic winters (e.g. Guirlet et al., 2000). Measurements of ClO made using a resonance fluorescence instrument (Pierson et al., 1999) on some of the flights are also compared with the ClO profiles calculated in SLIMCAT. Changes in the CFC-11 and ozone correlations during the winter are then used to 25
ACPD
4, 7089–7120, 2004Ozone loss
A. D. Robinson et al.
Title Page Abstract Introduction Conclusions References
Tables Figures
◭ ◮
◭ ◮
Back Close
Full Screen / Esc
Print Version
Interactive Discussion
©EGU 2004
model calculated ozone losses. In the final section we discuss the derivations of ozone loss in the vortex from balloon profiles of long-lived tracers and the consistency of the CFC-11, O3, and ClO profiles between the measurements and SLIMCAT.
2. Measurements
The measurements featured in this study were made by three instruments flown on 5
balloons from Kiruna during the SOLVE-THESEO 2000 campaign. The balloon flight details are given in Table 1. The instruments are now briefly described.
2.1. Halocarbons
DIRAC (Determination In situ by Rapid Analytical Chromatography) is a lightweight gas chromatograph for use on stratospheric balloons developed by the University of 10
Cambridge. The operation and performance of DIRAC are described by Robinson et al. (2000). The instrument weighed 21 or 24 kg, depending on configuration (although recent instruments with superior performance now weigh<10 kg). A range of halocar-bons is detected and can be measured quantitatively. The measurement with the high-est precision is CFC-11, measured with a time resolution of about 2 min. DIRAC uses a 15
Carboxen adsorbent to pre-concentrate samples of known volume before injection onto a separation column and electron capture detector. The accuracy for CFC-11 based on the uncertainty of the calibration gas used during the campaign is estimated to be 2.5%, this calibration gas is linked to NOAA-CMDL working standards by comparison to an Aculife treated cylinder containing Niwot Ridge air (calibrated by NOAA-CMDL in 20
July/August 2000).
ACPD
4, 7089–7120, 2004Ozone loss
A. D. Robinson et al.
Title Page Abstract Introduction Conclusions References
Tables Figures
◭ ◮
◭ ◮
Back Close
Full Screen / Esc
Print Version
Interactive Discussion
©EGU 2004
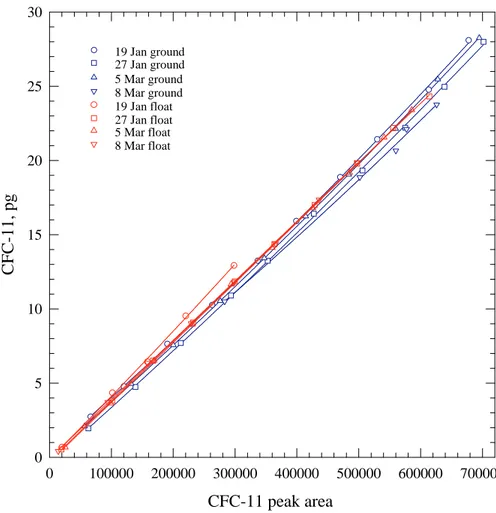
taken at low altitudes (below 400 K) where CFC-11 mixing ratios are high and sample volumes are large, the precision is typically 5–8 pptv (corresponding to a typical sample mass in the range 10 to 20 pg of CFC-11). However, at higher altitudes (above 400 K), where both the sample volumes and CFC-11 mixing ratios are lower, the typical preci-sion is in the range 10–20 pptv (corresponding to a typical sample mass in the range 5
0.2 to 7 pg of CFC-11). The calibration data collected during these balloon flights were based on a typical calibration flow of 22±7 sccm. However, sample flow rates during this campaign were in the range 1.5 to 22 sccm with the lowest flow being at the highest altitude. Laboratory response curves for CFC-11 using calibration gas over a range of flows indicate an additional uncertainty in the measurement of 0.2 pg of CFC-11. 10
The sample flow rates at high altitude were up to 3 times lower than in previous DIRAC flights as a result of a new switching valve with an unexpectedly high flow re-sistance which could not be changed during the campaign. The low flow rates had a number of consequences resulting in higher uncertainties above about 400 to 420 K. For example, corrections to account for the time delay between sample air entering 15
the inlet and arriving at the adsorbent were larger than usual, being in the range 20 to 60 s. Also, low pressure tests with DIRAC-B show that at low sample flows a small but significant fraction of air from lower altitude remains in the dead volume of the sam-ple pathway (DIRAC-A made the SOLVE-THESEO 2000 measurements but was lost on a later flight in the campaign). This impacts on the measurements above 400 K, 20
causing a small systematic bias toward higher reported CFC-11 values (on ascent). Measurements reported here are not corrected for this effect as any such correction, based on laboratory tests, would be of significant uncertainty in itself. The implemen-tation of a new pumping system has now minimised this problem on the instrument. In the plots which compare DIRAC and DESCARTES CFC-11 data (presented later) 25
ACPD
4, 7089–7120, 2004Ozone loss
A. D. Robinson et al.
Title Page Abstract Introduction Conclusions References
Tables Figures
◭ ◮
◭ ◮
Back Close
Full Screen / Esc
Print Version
Interactive Discussion
©EGU 2004
DIRAC and DESCARTES CFC-11 measurements during the campaign.
The measurements are analysed here from four flights of DIRAC during SOLVE-THESEO 2000 (Table 1). Three of these (19 January, 27 January and 8 March 2000) were made as part of the HALOZ project (V ¨omel et al., 2001) and the other was part of the OMS in situ flight (5 March 2000). All DIRAC data presented here were taken during 5
the balloon ascent. A fifth DIRAC flight was made in late March, but unfortunately the balloon and payload flew astray over Finland and were not recovered. We have no data for this flight as DIRAC was flying without telemetry.
DESCARTES (D ´etermination et S ´eparation par Chromatographie lors de l’Analyse des R ´esultats des Traceurs Echantillonn ´es dans la Stratosph `ere) is a lightweight 10
(17 kg) balloon-borne grab sampling instrument developed by the University of Cam-bridge in which known volumes of stratospheric air are trapped on sample tubes con-taining Carboxen. A range of trapped halocarbons is subsequently measured in the laboratory using a gas chromatograph and electron capture detector. For a detailed discussion see Danis et al. (2000). The precision (1 sigma) of the CFC-11 measure-15
ments made by DESCARTES during this campaign was typically<15 pptv for samples taken below 400 K and typically 5–20 pptv for samples above 400 K. The accuracy is estimated to be about 4% for CFC-11 based on the uncertainty of the calibration gas. All measurements from DESCARTES presented here were analysed by IRF, Kiruna, enabling data to be obtained soon after instrument recovery. A total of 10 DESCARTES 20
flights (including vortex edge flights) were made during the 1999/2000 winter. In this paper, measurements are analysed from five vortex core flights of the instrument, made with a range of host payloads (Table 1). As with DIRAC, all the DESCARTES CFC-11 data presented here were taken during the balloon ascent.
2.2. ClO 25
ACPD
4, 7089–7120, 2004Ozone loss
A. D. Robinson et al.
Title Page Abstract Introduction Conclusions References
Tables Figures
◭ ◮
◭ ◮
Back Close
Full Screen / Esc
Print Version
Interactive Discussion
©EGU 2004
ozone loss in the Arctic winter 1999/2000 (V ¨omel et al., 2001). A total of five balloon flights of the ClO instrument were made during the 1999/2000 winter. In this paper, measurements are presented from the HALOZ flight on 8 March 2000 (Table 1).
2.3. Ozone
The ozonesonde observations for all the flights used in this study (including those as-5
sociated with the OMS in situ and Bonbon flights) were made by ECC sondes operated by the University of Wyoming and Esrange.
3. SLIMCAT 3 dimensional chemical transport model
The SLIMCAT 3-D CTM (Chipperfield et al., 1996; Chipperfield, 1999; Guirlet et al., 2000) is an off-line model driven here with daily U.K. Met. Office winds and temper-10
atures (Swinbank and O’Neill, 1994) on 12 isentropic potential temperature surfaces from 335 K to 2700 K at a resolution of 3.75◦ latitude by 3.75◦ longitude. The model uses the MIDRAD radiation scheme (Shine, 1987) to calculate the cross-isentropic flow and a second-order moments scheme (Prather, 1986) for tracer advection. The Prather scheme has low numerical diffusion and maintains strong gradients in tracer 15
distribution well, an important consideration in polar winter time simulations. A detailed stratospheric chemistry scheme is included in the model with 49 chemical species inte-grated over a 15 min timestep. In general, photochemical data are taken from DeMore et al. (1997) and photolysis rates are calculated using a scheme based on Lary and Pyle (1991). The model also contains an equilibrium treatment of reactions on liquid 20
ACPD
4, 7089–7120, 2004Ozone loss
A. D. Robinson et al.
Title Page Abstract Introduction Conclusions References
Tables Figures
◭ ◮
◭ ◮
Back Close
Full Screen / Esc
Print Version
Interactive Discussion
©EGU 2004
20041). The winter 1999/2000 simulation was initialised on 30 November 1999 from a low resolution multiannual simulation provided by Chipperfield (1999) with a total chlo-rine loading of 3.6 ppbv and a total bromine loading of 20 pptv. The winter simulation was run until May 2000 with daily output of the chemical fields.
4. Results 5
In the first part of this section the CFC-11 vertical profiles from DIRAC and DESCARTES are compared with CFC-11 measurements from two other instruments: the Bonbon whole air cryo-sampler (Schmidt et al., 1991) which flew as part of the TRIPLE payload; and the LACE instrument (Ray et al., 1999; Moore et al., 2003) which was part of the NASA-SOLVE OMS in situ payload. The agreement between CFC-10
11 measured by DIRAC and DESCARTES is also examined for samples above the 360 K potential temperature level (approximating to the lower boundary of the vortex). A change in the relation between CFC-11 and ozone over the winter below this level is unlikely to be the result of chemical ozone loss. A good agreement between the instruments, above the 360 K potential temperature level, would justify merging the two 15
data sets in order to improve the estimate of ozone loss within the vortex core.
In the second part of this section the measurements from DIRAC and DESCARTES as well as the ClO and O3measurements are compared with the output of the SLIMCAT model to assess its performance. This is achieved by making direct comparisons of the measured vertical profiles of CFC-11, O3and ClO with those from the model.
20
In the third and last part of this section the relation between measured CFC-11 and ozone is compared with the equivalent relation from the model. We also compare the measured CFC-11 ozone relations from our instruments with those from Bonbon
1
ACPD
4, 7089–7120, 2004Ozone loss
A. D. Robinson et al.
Title Page Abstract Introduction Conclusions References
Tables Figures
◭ ◮
◭ ◮
Back Close
Full Screen / Esc
Print Version
Interactive Discussion
©EGU 2004
and LACE. Estimates of ozone loss in the vortex can be derived from the change in the measured O3/CFC-11 relation through the winter using the approach of Proffitt et al. (1990, 1993) and M ¨uller et al. (2001 and references therein). A tight correlation between two tracers, such as exists between O3and CFC-11 at the start of the winter, should be maintained if it is assumed that there is no mixing or chemistry operating on 5
the tracers. Changes in the correlation indicate that this assumption is not valid. Within the polar vortex, mixing is usually small and any change in the correlation is most likely due to chemistry. For the specific case of O3and CFC-11, the chemistry of the latter is very slow with small seasonal changes and the effect of mixing would be small since the relationship between O3 and CFC-11 was effectively linear in this winter (M ¨uller 10
et al., 2003) so that changes in the expected correlation can be directly attributed to ozone destruction. Later in this section we use the measurements to estimate ozone loss by this method. Finally, the ozone loss estimates based on the measurements are compared to the losses derived using exactly the same methodology from the change in the O3/CFC-11 correlations in the model.
15
4.1. Measurement comparison
Here we first compare our CFC-11 measurements with those from the Bonbon and LACE instruments and relate them to the vortex situation. Figure 2 shows the vertical profiles of CFC-11 and O3from the four DIRAC flights and the five DESCARTES flights together with CFC-11 and O3data from the LACE flights of 19 November and 5 March 20
and the Bonbon flights of 27 January and 1 March. Potential vorticity (PV) maps from UKMO and the T21 MIMOSA model (Hauchecorne et al., 2002) indicate that the polar vortex between 19 November (LACE flight) and 3 and 15 December (DESCARTES flights) was well formed above 450 K. Below 450 K it strengthened significantly but is still best classified as a weak vortex. This can explain much of the structure apparent 25
ACPD
4, 7089–7120, 2004Ozone loss
A. D. Robinson et al.
Title Page Abstract Introduction Conclusions References
Tables Figures
◭ ◮
◭ ◮
Back Close
Full Screen / Esc
Print Version
Interactive Discussion
©EGU 2004
Maps of PV from MIMOSA show that all other flights featured here were essentially inside the Arctic vortex over the altitude range sampled (taking the vortex edge to be the zone of maximum PV gradient) and the CFC-11 profiles show the expected rapid decrease with altitude. The change in the profiles suggests that considerable descent across potential temperature surfaces occurred throughout the winter, particularly be-5
tween early December and late January. On 19 January a notch in the DIRAC CFC-11 profile at 360 K is anticorrelated with the O3profile which suggests a dynamical feature; air at this potential temperature level is likely to be at or below the base of the vortex where such dynamical features are to be expected.
On the 27 January DIRAC flew from the same launch site about 2 hours after the 10
Bonbon whole air cryo-sampler. Assuming that the two instruments flew through es-sentially the same air mass this provided an opportunity for comparison. CFC-11 mea-surements from DIRAC and Bonbon agree well within uncertainty limits up to about 400 K. Above this level the DIRAC measurements are between 20–30 pptv higher than those of Bonbon although the uncertainty of the DIRAC measurements is much higher 15
in this region. It is likely that this difference between the two instruments is due to the lower than expected sample flow through the DIRAC inlet system, as discussed earlier. On 5 March DIRAC was deployed on the OMS in situ gondola which included the LACE instrument. Figure 2 shows that the DIRAC CFC-11 data compare well with LACE up to about 400 K. Above this level the DIRAC CFC-11 values are again up to 30 pptv higher 20
than those from LACE. The evidence from the comparison with Bonbon and LACE in-dicates that DIRAC appears to systematically over-estimate CFC-11 above the 400 K level. However, such a systematic bias in the CFC-11 data does not affect the use of the tracer O3 technique to estimate loss of ozone throughout the winter provided the bias is consistent over the campaign period (we later report good agreement in ozone 25
loss estimates from Bonbon/LACE).
ACPD
4, 7089–7120, 2004Ozone loss
A. D. Robinson et al.
Title Page Abstract Introduction Conclusions References
Tables Figures
◭ ◮
◭ ◮
Back Close
Full Screen / Esc
Print Version
Interactive Discussion
©EGU 2004
of these flights were into the vortex core. Examination of the vertical profiles of CFC-11 for these flights reveals that the DESCARTES measurements are systematically higher than those from Bonbon at any given altitude. At low altitude (300 to 350 K) the DESCARTES mixing ratios are typically 20 pptv higher than those from Bonbon and at higher altitude (>400 K) mixing ratios are typically 10–20 pptv higher than Bonbon. 5
Examination of the CFC-11 O3 relation for the comparison flights shows that for any given O3mixing ratio the corresponding DESCARTES CFC-11 value is higher than that from Bonbon. However, this difference is within uncertainty limits for high O3 mixing ratios (>2000 ppbv). As with the DIRAC CFC-11 comparison with Bonbon and LACE we argue that the systematic bias in the DESCARTES CFC-11 data does not affect the 10
use of the tracer O3technique to estimate loss of ozone throughout the winter provided the bias is consistent over the campaign period.
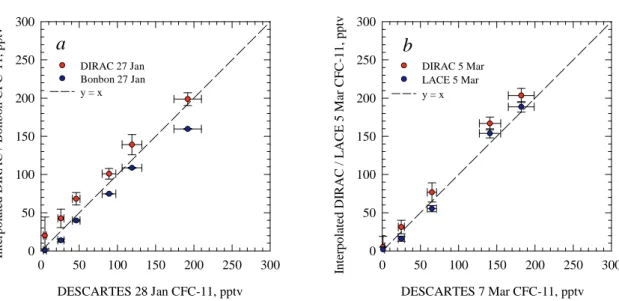
To assess the relative agreement between vortex core measurements of CFC-11 from DIRAC and DESCARTES we examine the difference in the data for the late Jan-uary and early March flights when the instruments flew within one or two days of each 15
other (Fig. 3). The differences are based on linear interpolation of the DIRAC CFC-11 data to the potential temperature levels of the DESCARTES data. Only those data collected above 360 K are used in the assessment which approximates to the lower-most extent of the vortex circulation system. For both the January and March DIRAC and DESCARTES flight pairs there were only small differences beyond measurement 20
uncertainties between the data points and the line y=x (a 1:1 agreement) and so a merged data set was produced, based on the DIRAC and DESCARTES measure-ments, to estimate ozone loss using the tracer ozone relation technique.
4.2. Measurement and model agreement
Here we compare our measurements of CFC-11, O3and ClO directly with the SLIMCAT 25
ACPD
4, 7089–7120, 2004Ozone loss
A. D. Robinson et al.
Title Page Abstract Introduction Conclusions References
Tables Figures
◭ ◮
◭ ◮
Back Close
Full Screen / Esc
Print Version
Interactive Discussion
©EGU 2004
about 450 K). There is also good agreement between O3measured by the ECC sondes and the O3 calculated in SLIMCAT although the model generally underestimates the amount of ozone during March by about 200 ppbv. On certain flights, structure in the CFC-11 measurements, whilst not picked up by the model at this resolution, is seen anticorrelated in the ozonesonde data (e.g. 3 December 1999, 27 January and 8 March 5
2000) confirming that the instruments are able to capture these dynamical features. The overall good agreement between the CFC-11 measurements and the model gives confidence in the modelled available chlorine Cly, a principal influence on the model ClO. To compare ClO observations (8 March) with model calculations, the out-put from the SLIMCAT simulation of the 1999–2000 northern hemisphere winter (stored 10
daily at 12:00 UT) was used to initialise a set of stacked photochemical box models. The stacked box models were then integrated over a diurnal cycle for comparison with the observations, following the method used by Solomon et al. (2000). The stacked box models used an identical chemistry scheme to the full 3-D model except that all 49 chemical species in the model were integrated separately with a 1 min time step; 15
no family or photochemical steady-state assumptions were made. To avoid prohibitive computational costs SLIMCAT uses certain family approximations and assumes photo-chemical steady-state partitioning for the ClOx family (Cl, ClO and Cl2O2), so it cannot itself provide ClO predictions accurate enough for comparison with the data.
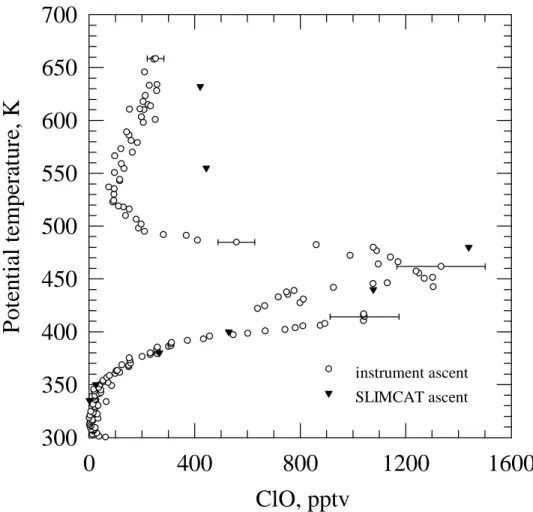
Figure 5 shows a comparison between the ClO measurements and results from 20
the ClO-Cl2O2model for 8 March 2000. The agreement between measurements and model is good in terms of both the position and magnitude of the ClO maximum, lend-ing further confidence in the ability of the full three-dimensional model to reproduce observed ozone in the vortex. The structure at 425 K in the measurements is not picked up in the model. The analysed temperature fields do, however, indicate that air 25
ACPD
4, 7089–7120, 2004Ozone loss
A. D. Robinson et al.
Title Page Abstract Introduction Conclusions References
Tables Figures
◭ ◮
◭ ◮
Back Close
Full Screen / Esc
Print Version
Interactive Discussion
©EGU 2004
al., 2001).
All the flights considered were inside the polar vortex where the model performance is good; we caution however that there may be regions, especially at the vortex edge, where detailed comparisons between model and observations are less satisfactory.
4.3. Estimated ozone loss in the vortex 5
As discussed above, chemical ozone loss can be estimated from changes in the re-lation between the mixing ratios of O3 and a long-lived tracer, assuming that mixing of air between the two measurements does not significantly change the initial rela-tionship. Preliminary examination of other tracer data sets in SOLVE-THESEO 2000 indicates that there was little mixing into the vortex between the second half of January 10
and early March 2000 (Rex et al., 2002; Richard et al., 2001). Here, we merge the measurements of CFC-11 and ozone (for measurements made above 360 K) from the DIRAC and DESCARTES flights and use this merged data set to estimate ozone loss. First, the observed O3/CFC-11 relations from the merged DIRAC and DESCARTES flights are compared with relations from the Bonbon and LACE flights and also the 15
equivalent relations from the SLIMCAT model. Secondly, these relations, for both the merged measurements and the model, are used to estimate ozone loss as a function of altitude in the vortex for two periods through the winter.
To examine the changes in the vertical distribution of ozone throughout the win-ter, flights made within a few days of each other are treated as a merged ensemble 20
(Table 2). CFC-11 data for each flight within each ensemble are interpolated to the po-tential temperature measurement levels of the later flight of the ensemble. The CFC-11 data at each potential temperature level are then averaged to obtain a single CFC-11 profile. The uncertainty for each averaged CFC-11 measurement is the average of the quadrature addition of the fractional uncertainties of each individual measurement 25
ACPD
4, 7089–7120, 2004Ozone loss
A. D. Robinson et al.
Title Page Abstract Introduction Conclusions References
Tables Figures
◭ ◮
◭ ◮
Back Close
Full Screen / Esc
Print Version
Interactive Discussion
©EGU 2004
ensemble. The ozone change is finally obtained by taking the difference in ozone on equivalent CFC-11 levels between paired ensembles.
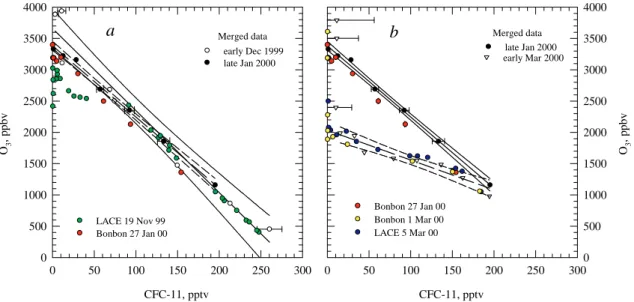
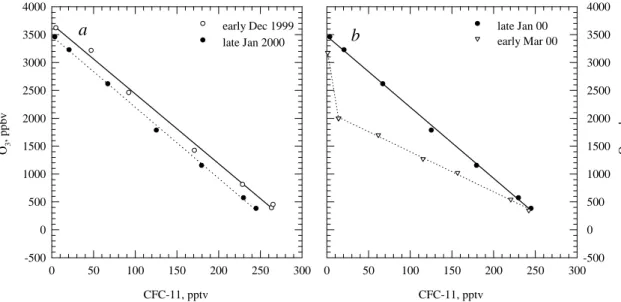
Figure 6a shows the relations between CFC-11 and O3 for the merged DIRAC and DESCARTES data between the early December and late January flight ensembles. There is little difference in the relation between the December and January data (aver-5
age dates 9 December and 25 January, respectively, 47 days separation), suggesting little loss during this period. Figure 6a also shows the O3/CFC-11 relations for the LACE flight on 19 November and the Bonbon flight on 27 January 2000. There is a good agreement between the merged early December data and the LACE November data for all values of ozone apart from the region between 2600 and 3300 ppbv where 10
the LACE data shows lower ozone for a given CFC-11 value by up to 500 ppbv. This could be attributed to a dynamical feature in the November flight data in the earlier stages of the vortex formation (Salawitch et al., 2002). The late January O3/CFC-11 relation for the merged data is typically between 10 and 20 pptv higher in CFC-11 for a given value of ozone when compared to the 27 January Bonbon flight. This is in part 15
due to the difference in the measured vertical profiles of CFC-11 and part due to the earlier average date of the merged data (25 January).
In contrast to the December to January period, a clear split is seen in the O3/CFC-11 relations between January and March (average dates 25 January and 5 March, respec-tively, 39 days separation) as shown by the solid and dashed regression lines in Fig. 6b. 20
Note that the uncertainty in the relation is large for the high altitude points at the top of the depleted ozone layer as the sample volumes and flow rates here were low and also this region was only sampled by DIRAC. From the merged data we diagnose ozone loss throughout the profile for CFC-11 mixing ratios less than about 175 pptv (correspond-ing to about 370 K). There is a 1100 ppbv change in ozone at a CFC-11 mix(correspond-ing ratio 25
ACPD
4, 7089–7120, 2004Ozone loss
A. D. Robinson et al.
Title Page Abstract Introduction Conclusions References
Tables Figures
◭ ◮
◭ ◮
Back Close
Full Screen / Esc
Print Version
Interactive Discussion
©EGU 2004
(strengthening our argument for only a systematic bias between DIRAC/DESCARTES and the other instruments).
A SLIMCAT calculation was performed for this winter (1999/2000) and the ozone evolution agreed well with data (Sinnhuber et al., 2000; Millard et al., in preparation, 20041). To investigate ozone change based on SLIMCAT, the model data for each 5
flight date are grouped into ensembles and treated in the same way as the measure-ments. Investigations into the possible impact of vortex inhomogeneity on model ozone loss calculations show that the maximum variability in ozone loss along 5◦ PV equiv-alent latitude bands reached 27% in mid January 2000. This ozone loss variability then remained below 18% from the beginning of February onward, between 440 K and 10
500 K potential temperature (Millard et al., 2002). The low variability in vortex ozone loss makes the use of balloon based measurements as indicators of vortex average ozone loss particularly relevant in this winter. SLIMCAT diagnosed ozone loss rates in 1999/2000 agree well with ‘Match’ diagnosed ozone loss until March 2000 (Millard et al., 20041). Thereafter, SLIMCAT underestimates the rate of ozone loss by∼2 ppbv per 15
sunlit hour due to insufficient model denitrification in the presence of large NAT PSCs. We note also that the model may not have reproduced the observed chlorine activation accurately because of a negative temperature bias in the forcing fields; nevertheless, modelled and observed ClO do compare well (Fig. 5). Figure 7 shows the equivalent plots to Fig. 6 for the vertical distributions of O3 and CFC-11 from SLIMCAT above 20
Kiruna for the DIRAC/DESCARTES merged flight dates. Little change in the relation is seen between the December 1999 and January 2000 dates, consistent with the ob-servations, but a large shift is again seen between the January and March dates. The SLIMCAT CFC-11/O3 relation for early March clearly shows the top of the depleted ozone layer in common with the measurements.
25
ACPD
4, 7089–7120, 2004Ozone loss
A. D. Robinson et al.
Title Page Abstract Introduction Conclusions References
Tables Figures
◭ ◮
◭ ◮
Back Close
Full Screen / Esc
Print Version
Interactive Discussion
©EGU 2004
quadrature of the standard errors for the ozone mixing ratios in the regressions defining the O3/CFC-11 relations (shown in Fig. 6). The measurements show no ozone loss in the 400–450 K region between December and January. Also shown in Fig. 8 is the altitudinal ozone change for the period from 25 January to 5 March obtained by plotting the ozone difference for fixed CFC-11 values against the potential temperatures for 5
the 5 March flight ensemble. During this period there was substantial ozone loss with a maximum of about 1200 ppbv in the 440–470 K region with ozone loss to a lesser extent down to about 370 K. Figure 8 also shows the altitude distribution of ozone change using the Bonbon and LACE data for the period 27 January to 5 March calculated using the same methodology as with the DIRAC and DESCARTES data. There is an 10
excellent agreement in both the magnitude and position of the ozone loss maximum and both data sets show ozone loss extending down to the 370–380 K region.
The vertical distribution of ozone change using the SLIMCAT results was examined for the periods of early December to late January and late January to early March (both using the same dates as the merged DIRAC/DESCARTES data). As with the 15
measurement data, the ozone differences are plotted against the potential temperature of the later flight date for each period. These model ozone change distributions are shown in Fig. 8 together with the measurements. The model shows slight ozone loss (<300 ppbv) in the 450–550 K region in the early December to late January period. The model shows a maximum ozone loss of 1300 ppbv at 480 K for the late January to early 20
March period, very similar to the loss derived from the measurements.
5. Conclusions
The ascent data from DIRAC and DESCARTES provide a set of CFC-11 profiles from a total of nine balloon flights made during the 1999/2000 Arctic winter. These vertical profiles compare well with SLIMCAT CFC-11 profiles for the same dates and location. 25
ACPD
4, 7089–7120, 2004Ozone loss
A. D. Robinson et al.
Title Page Abstract Introduction Conclusions References
Tables Figures
◭ ◮
◭ ◮
Back Close
Full Screen / Esc
Print Version
Interactive Discussion
©EGU 2004
ability of the full 3-D model to reproduce observed ozone in the vortex.
Using ECC ozonesonde data from the balloon flights inside the vortex (or from small balloons launched soon after) changes in the O3/CFC-11 relationship are observed throughout the winter. Grouping the flights into ensembles and merging the DIRAC and DESCARTES data provides a means of estimating the vertical change in ozone con-5
centration from early December to late January and from late January to early March. SLIMCAT data generated for the same dates and location as the measurements are grouped into the same ensembles and treated identically to the measurement data. The merged flight ensembles show no ozone loss between early December and late January, the model shows slight ozone loss (<300 ppbv in the 450–550 K region). Be-10
tween late January and early March the merged measurements show a maximum ozone loss of 1200 ppbv in the 440–470 K region which compares excellently with the maximum loss calculated by the model (1300 ppbv at 480 K).
A thorough comparison of ozone loss rates requires a detailed examination of the conditions (period, altitude, location) over which the ozone loss occurs (Harris et al., 15
2002) and is beyond the scope of this study. However simple comparisons with the other studies in the 1999/2000 winter (Hoppel et al., 2002; Klein et al., 2002; M ¨uller et al., 2003 and discussion therein; Rex et al., 2002; Richard et al., 2001; Salawitch et al., 2002; Schoeberl et al., 2002; summary in Table 8 of Newman et al., 2002) show good agreement. We find that the peak loss occurred in the 440–470 K region, which 20
is the same as M ¨uller et al. (2003) at the low end of the range. Our peak loss of 1200 ppbv is less than those of some other studies (e.g. 2000 ppbv of Rex et al., 2002, and 1800 ppbv of Richard et al., 2001), but this is at least partly related to the earlier end to the period we consider. The cumulative ozone loss reported by Match on about 5 March (the average date of our March flights) is about 1500 ppbv (Fig. 6 in Rex et al., 25
2002), within the estimated uncertainties of the two techniques.
ACPD
4, 7089–7120, 2004Ozone loss
A. D. Robinson et al.
Title Page Abstract Introduction Conclusions References
Tables Figures
◭ ◮
◭ ◮
Back Close
Full Screen / Esc
Print Version
Interactive Discussion
©EGU 2004
modelled ozone loss for the vortex core as a whole.
Acknowledgements. We gratefully acknowledge the following for their financial support: the Research DG of the European Commission through the THESEO O3loss (ENV4-CT97-0510), THESEO-EuroSOLVE (1999-00047) and CRUSOE (EVK2-1999-00252, EVK2-CT-2001-20012) projects; the UK Natural Environment Research Council through its UTLS Ozone 5
programme; the NERC UK Universities Global Atmospheric Modelling Programme (UGAMP) and the NERC Centre of Atmospheric Science (NCAS); the UK Department of Environment, Transport and Regions through its Global Atmospheres Division (EPG 1/1/83); and US Na-tional Science Foundation. We would also like to acknowledge CNES, Esrange and NASA for provision of the flights we had during SOLVE-THESEO 2000 and W. Brune for his assis-10
tance during the OMS in situ flight. G. Millard thanks the EPSRC for a studentship. We thank A. Hauchecorne for provision of MIMOSA PV maps.
References
Bauer, R., Engel, A., Franken, H., Klein, E., Kulessa, G., Schiller, C., Schmidt, U., Borchers, R., and Lee, J.: Monitoring the vertical structure of the arctic polar vortex over northern 15
Scandinavia during EASOE – regular N2O profile observations, Geophys. Res. Lett., 21, 1211–1214, 1994.
Bregman, A., Lelieveld, J., van den Broek, M. M. P., Siegmund, P. C., Fischer, H., and Bujok, O.: N2O and O3relationship in the lowermost stratosphere: A diagnostic for mixing processes as represented by a three-dimensional chemistry-transport model, J. Geophys. Res., 105, 20
17 279–17 290, 2000.
Chipperfield, M. P.: Multi-annual simulations with a three-dimensional chemical transport model, J. Geophys. Res., 104, 1781–1805, 1999.
Chipperfield, M. P., Lee, A. M., and Pyle, J. A.: Model calculations of ozone depletion in the Arctic polar vortex for 1991/92 to 1994/95, Geophys. Res. Lett., 23, 559–562, 1996.
25
Danis, F., Harris, N. R. P., Taylor, W. H., McIntyre, J. D., Simmonds, P. G., and Pyle, J. A.: DESCARTES: A novel lightweight balloon-borne instrument for measurement of halocar-bons, Rev. Sci. Instr., 70, 271–280, 2000.
ACPD
4, 7089–7120, 2004Ozone loss
A. D. Robinson et al.
Title Page Abstract Introduction Conclusions References
Tables Figures
◭ ◮
◭ ◮
Back Close
Full Screen / Esc
Print Version
Interactive Discussion
©EGU 2004
Ravishankara, A. R., Kolb, C. E., and Molina, M. J.: Chemical kinetics and photochemical data for use in stratospheric modelling, Evaluation 12, JPL Publ., 97-4, 1997.
Goutail, F., Pommereau, J.-P., Phillips, C., Deniel, C., Sarkissian, A., Lef `evre, F., Kyr ¨o, E., Rum-mukainen, M., Ericksen, P., Andersen, S., Kaastad-Hoiskar, B.-A., Braathen, G., Dorokhov, V., and Khattatov, V.: Depletion of column ozone in the Arctic during the winters 1993–94 5
and 1994–95, J. Atmos. Chem., 32, 1–34, 1999.
Guirlet, M., Chipperfield, M. P., Pyle, J. A., Goutail, F., Pommereau, J.-P. and Kyr ¨o, E.: Mod-elled Arctic ozone depletion in winter 1997/1998 and comparison with previous winters, J. Geophys. Res., 105, 22 185–22 200, 2000.
Harris, N. R. P., Rex, M., Goutail, F., Knudsen, B. M., Manney, G. L., M ¨uller, R., and von der 10
Gathen, P.: Comparison of empirically derived ozone losses in the Arctic vortex, J. Geophys Res., 107 (D20), 8264, doi:10.1029/2001JD000482, 2002.
Hauchecorne, A., Godin, S., Marchand, M., Heese, B., and Souprayen, C.: Quantification of the transport of chemical constituents from the polar vortex to middle latitudes in the lower stratosphere using the high-resolution advection model MIMOSA and effective diffusivity, J. 15
Geophys. Res., 107 (D20), 8289, doi:10.1029/2001JD000491, 2002.
Hoppel, K., Bevilacqua, R., Nedoluha, G., Deniel, C., Lef `evre, F., Lumpe, J., Fromm, M., Ran-dall, C., Rosenfield, J., and Rex, M.: POAM III observations of Arctic ozone loss for the 1999/2000 winter, J. Geophys. Res., 107 (D20), 8262, doi:10.1029/2001JD000476, 2002. Klein, U., Wohltmann, I., Lindner, K., and K ¨unzi, K. F.: Ozone depletion and chlorine activation 20
in the Arctic winter 1999/2000 observed in Ny- ˚Alesund, J. Geophys. Res., 107 (D20), 8288, doi:10.1029/2001JD000543, 2002.
Knudsen, B. M., Larsen, N., Mikkelsen, I. S., Morcrette, J.-J., Braathen, G. O., Kyr ¨o, E., Fast, H., Gernandt, H., Kanzawa, H., Nakane, H., Dorokhov, V., Yushkov, V., Hansen, G., Gil, M., and Shearman, R. J.: Ozone depletion in and below the Arctic vortex for 1997, Geophys. 25
Res. Lett., 25, 627–630, 1998.
Lary, D. J. and Pyle, J. A.: Diffuse radiation, twilight and photochemistry, J. Atmos. Chem., 13, 373–392, 1991.
Lucic, D., Harris, N. R. P., Pyle, J. A., and Jones, R. L.: A technique for estimating polar ozone loss: results for the northern 1991/92 winter using EASOE data, J. Atmos. Chem., 34, 365– 30
383, 1999.
ACPD
4, 7089–7120, 2004Ozone loss
A. D. Robinson et al.
Title Page Abstract Introduction Conclusions References
Tables Figures
◭ ◮
◭ ◮
Back Close
Full Screen / Esc
Print Version
Interactive Discussion
©EGU 2004
Millard, G. A.: Numerical modelling of polar and middle latitude ozone loss, PhD thesis, Uni-versity of Cambridge, UK, 2002.
Millard, G. A., Lee, A. M., and Pyle, J. A.: A model study of the connection between polar and mid-latitude ozone loss in the northern hemisphere lower stratosphere, J. Geophys Res., 108, 8323, doi:10.1029/2001JD000899, 2002.
5
Moore, F. L., Elkins, J. W., Ray, E. A., Dutton, G. S., Dunn, R. E., Fahey, D. W., McLaughlin, R. J., Thompson, T. L., Romashkin, P. A., Hurst, D. F., and Wamsley, P. R.: Balloonborne in situ gas chromatograph for measurements in the troposphere and stratosphere, J. Geophys Res., 103 (D5), 8330, doi:10.1029/2001JD000891, 2003.
M ¨uller, R., Schmidt, U., Engel, A., McKenna, D. S., and Proffitt, M. H.: The O3/N2O relation from 10
balloon-borne observations as a measure of Arctic ozone loss in 1991/92, Q. J. R. Meterol. Soc., 127, 1389–1412, 2001.
M ¨uller, R., Tilmes, S., Grooß, J.-U., McKenna, D. S., M ¨uller, M., Schmidt, U., Toon, G. C., Stach-nik, R. A., Margitan, J. J., Elkins, J. W., Arvelius, J., and Russell III, J. M.: Chlorine activation and chemical ozone loss deduced from HALOE and balloon measurements in the Arctic 15
during the winter of 1999–2000, J. Geophys. Res., 107, 8302, doi:10.1029/2001JD001423, 2002, (printed 108 (D5), 2003).
Newman, P. A., Harris, N. R. P., Adriani, A., Amanatidis, G. T., Anderson, J. G., Braathen, G. O., Brune, W. H., Carslaw, K. S., Craig, M. S., DeCola, P. L., Guirlet, M., Hipskind, R. S., Kurylo, M. J., Kullmann, H., Larsen, N., Megie, G. J., Pommereau, J.-P., Poole, L. R., Schoeberl, M. 20
R., Stroh, F., Toon, O. B., Trepte, C. R., and van Roozendael, M.: An Overview of the SOLVE-THESEO 2000 Campaign, J. Geophys Res., 107 (D20), 8259, doi:10.1029/2001JD001303, 2002.
Pierson, J. M., McKinney, K. A., Toohey, D. W., Margitan, J., Schmidt, U., Engel, A., and New-man, P. A.: An investigation of C1O photochemistry in the chemically perturbed Arctic vortex, 25
J. Atmos. Chem., 32, 61–81, 1999.
Pommereau, J.-P. and Piquard, J.: Ozone, nitrogen dioxide and aerosol vertical distributions by UV-visible solar occultation from balloons, Geophys. Res. Lett., 21, 1227–1230, 1994. Prather, M. J.: Numerical advection by conservation of second-order moments, J. Geophys.
Res., 104, 6671–6681, 1986. 30
ACPD
4, 7089–7120, 2004Ozone loss
A. D. Robinson et al.
Title Page Abstract Introduction Conclusions References
Tables Figures
◭ ◮
◭ ◮
Back Close
Full Screen / Esc
Print Version
Interactive Discussion
©EGU 2004
Proffitt, M. H., Aikin, K., Margitan, J. J., Lowenstein, M., Podolske, J. R., Weaver, A., Chan, K. R., Fast, H., and Elkins, J. W.: Ozone loss inside the northern polar vortex during the 1991–1992 winter, Science, 261, 1150–1154, 1993.
Pyle, J. A., Carver, G. D., and Schmidt, U.: Some case studies of chlorine activation during the EASOE campaigns, Geophys. Res. Lett., 21, 1431–1434, 1994.
5
Ray, E. A., Moore, F. L., Elkins, J. W., Dutton, G. S., Fahey, D. W., V ¨omel, H., Oltmans, S. J., and Rosenlof, K. H.: Transport into the NH lowermost stratosphere revealed by in situ tracer measurements, J. Geophys. Res., 104, 26 565–26 580, 1999.
Rex, M., von der Gathen, P., Braathen, G. O., Reid, S. J., Harris, N. R. P., Chipperfield, M., Reimer, E., Beck, A., Alfier, R., Kruger-Carstensen, R., De Backer, H., Balis, D., Zerefos, C., 10
O’Connor, F., Dier, H., Dorokhov, V., Fast, H., Gamma, A., Gil, M., Kyr ¨o, E., Rummukainen, M., Litynska, Z., Mikkelsen, I. S., Molyneux, M., and Murphy, G.: Chemical ozone loss in the Arctic winter 1994/95 as determined by the match technique, J. Atmos. Chem., 32, 35–39, 1999.
Rex, M., Salawitch, R. J., Harris, N. R. P., von der Gathen, P., Braathen, G. O., Schulz, A., 15
Deckelmann, H., Chipperfield, M., Sinnhuber, B.-M., Reimer, E., Alfier, R., Bevilacqua, R., Hoppel, K., Fromm, M., Lumpe, J., K ¨ullmann, H., Kleinb ¨ohl, A., Bremer, H., von K ¨onig, M., K ¨unzi, K., Toohey, D., V ¨omel, H., Richard, E., Aikin, K., Jost, H., Greenblatt, J. B., Loewenstein, M., Podolske, J. R., Webster, C. R., Flesch, G. J., Scott, D. C., Herman, R. L., Elkins, J. W., Ray, E. A., Moore, F. L., Hurst, D. F., Romashkin, P., Toon, G. C., Sen, B., 20
Margitan, J. J., Wennberg, P., Neuber, R., Allart, M., Bojkov, B. R., Claude, H., Davies, J., Davies, W., De Backer, H., Dier, H., Dorokhov, V., Fast, H., Kondo, Y., Kyr ¨o, E., Litynska, Z., Mikkelsen, I. S., Molyneux, M. J., Moran, E., Nagai, T., Nakane, H., Parrondo, C., Ravegnani, F., Skrivankova, P., Viatte, P., and Yushkov, V.: Chemical depletion of Arctic ozone in winter 1999/2000, J. Geophys Res., 107 (D20), 8276, doi:10.1029/2001JD000533, 2002.
25
Richard, E. C., Aikin, K., Andrews, A. E., Daube Jr. B. C., Gerbig, C., Wofsy, S. C., Romanshkin, P. A., Hurst, D. F., Ray, E. A., Moore, F. L., Elkins, J. W., Deshler, T., and Toon, G. C.: Severe chemical ozone loss inside the Arctic polar vortex during winter 1999–2000 inferred from in situ airborne measurements, Geophys. Res. Lett., 28, 2197–2200, 2001.
Robinson, A. D., McIntyre, J., Harris, N. R. P., Pyle, J. A., Simmonds, P. G., and Danis, F.: 30
A lightweight balloon-borne gas chromatograph for in situ measurements of atmospheric halocarbons, Rev. Sci. Instr., 71, 4553–4560, 2000.
ACPD
4, 7089–7120, 2004Ozone loss
A. D. Robinson et al.
Title Page Abstract Introduction Conclusions References
Tables Figures
◭ ◮
◭ ◮
Back Close
Full Screen / Esc
Print Version
Interactive Discussion
©EGU 2004
Ray, E. A., Moore, F. L., Hurst, D. F., Romashkin, P. A., Bevilacqua, R. M., Hoppel, K. W., Richard, E. C., and Bui, T. P.: Chemical Loss of Ozone during the Arctic Winter of 1999– 2000: An Analysis Based on Balloon-Borne Observations, J. Geophys Res., 107 (D20), 8269, doi:10.1029/2001JD000620, 2002.
Schoeberl, M. R., Proffitt, M. H., Kelly, K. K., Lait, L. R., Newman, P. A., Rosenfield, J. E., 5
Lowenstein, M., Podolske, J. R., Strahan, S. E., and Chan, K. R.: Stratospheric constituent trends from ER-2 profile data, Geophys. Res. Lett., 17, 469–427, 1990.
Schoeberl, M. R., Newman, P. A., Lait, L. R., McGee, T., Burris, J., Browell, E. V., Grant, W., Richard, E., von der Gathen, P., Bevilacqua, R., and Mikkelsen, I. S.: An assessment of the ozone loss during the 1999–2000 SOLVE Arctic campaign, J. Geophys. Res., 107 (D20), 10
8261, doi:10.1029/2001JD000412, 2002.
Schmidt, U., Bauer, R., Khedim, A., Klein, E., Kulessa, G., and Schiller, C.: Profile observations of long lived trace gases in the Arctic vortex, Geophys. Res. Lett., 18, 767–770, 1991. Shine, K. P.: The middle atmosphere in the absence of dynamical heat fluxes, Q. J. R. Meteorol.
Soc., 113, 603–633, 1987. 15
Sinnhuber, B. M., Chipperfield, M. P., Davies, S., Burrows, J. P., Eichmann, K. U., Weber, M., von der Gathen, P., Guirlet, M., Cahill, G. A., Lee, A. M., and Pyle, J. A.: Large loss of total ozone during the Arctic winter of 1999/2000, Geophys. Res. Lett., 27, 3473–3476, 2000. Solomon, P., Barrett, J., Conner, B., Zoonematkermani, S., Parrish, A., Lee, A., Pyle, J. A.,
and Chipperfield, M.: Seasonal observations of chlorine monoxide in the stratosphere over 20
Antarctica during the 1996–1998 ozone holes and comparison with the SLIMCAT 3-D model, J. Geophys. Res., 105, 28 979–29 001, 2000.
Swinbank, R. and O’Neill, A.: A stratosphere-troposphere data assimilation system, Mon. Weather Rev., 122, 686–702, 1994.
V ¨omel, H., Toohey, D., Deshler, T., and Kr ¨oger, C.: Sunset observations of ClO in the arctic 25
polar vortex and implications for ozone loss, Geophys. Res. Lett., 28, 4183–4186, 2001. Waugh, D. W., Plumb, R. A., Elkins, J. W., Fahey, D. W., Boering, K. A., Dutton, G. S., Volk,
C. M., Keim, E., Gao, R. S., Daube, B. C., Wofsy, S. C., Loewenstein, M., Podolske, J. R., Chan, K. R., Proffitt, M. H., Kelly, K., Newman, P. A., and Lait, L. R.: Mixing of polar vortex air into middle latitudes as revealed by tracer-tracer scatterplots, J. Geophys. Res., 102, 30
ACPD
4, 7089–7120, 2004Ozone loss
A. D. Robinson et al.
Title Page Abstract Introduction Conclusions References
Tables Figures
◭ ◮
◭ ◮
Back Close
Full Screen / Esc
Print Version
Interactive Discussion
©EGU 2004
Table 1. Balloon flights in the 1999/2000 winter from Esrange, Kiruna (67.9 N, 21.1 E) which carried the DIRAC/DESCARTES instruments featured in this work. ∗ ECC ozonesonde flown as part of the main payload.† ECC ozonesonde flown soon after the main balloon.
Date Launch Guest instrument Host payload
hour (UTC)
3 Dec. 1999 10 DESCARTES OMS in situ∗
15 Dec. 1999 11 DESCARTES SKERRIES†
19 Jan. 2000 11 DIRAC HALOZ (ClO)∗
27 Jan. 2000 12 DIRAC HALOZ (ClO)∗
28 Jan. 2000 11 DESCARTES SAOZ†
1 March 2000 10 DESCARTES HALOZ (ClO)∗
5 March 2000 15 DIRAC, DESCARTES OMS in situ∗
7 March 2000 14 DESCARTES SAOZ†
ACPD
4, 7089–7120, 2004Ozone loss
A. D. Robinson et al.
Title Page Abstract Introduction Conclusions References
Tables Figures
◭ ◮
◭ ◮
Back Close
Full Screen / Esc
Print Version
Interactive Discussion
©EGU 2004
Table 2. Grouped DIRAC and DESCARTES flight ensembles used to examine ozone change
from December to January (a) and from January to March (b) in the 1999/2000 Arctic winter. (a): Ozone change: early December to late January
December flight ensemble January flight ensemble Date 1 DESCARTES 3 Dec. 1999 DIRAC 19 Jan. 2000 Date 2 DESCARTES 15 Dec. 1999 DIRAC 27 Jan. 2000
Date 3 DESCARTES 28 Jan. 2000
Average date 9 Dec. 1999 25 Jan. 2000
(b): Ozone change: late January to early March
January flight ensemble March flight ensemble Date 1 DIRAC 19 Jan. 2000 DESCARTES 1 March 2000 Date 2 DIRAC 27 Jan. 2000 DIRAC 5 March 2000 Date 3 DESCARTES 28 Jan. 2000 DESCARTES 7 March 2000
Date 4 DIRAC 8 March 2000
ACPD
4, 7089–7120, 2004Ozone loss
A. D. Robinson et al.
Title Page Abstract Introduction Conclusions References
Tables Figures
◭ ◮
◭ ◮
Back Close
Full Screen / Esc
Print Version
Interactive Discussion
©EGU 2004
CFC-11 peak area
0 100000 200000 300000 400000 500000 600000 700000
C
F
C
-11, pg
0 5 10 15 20 25 30
19 Jan ground
5 Mar ground 27 Jan ground
8 Mar ground 19 Jan float 27 Jan float 5 Mar float 8 Mar float
ACPD
4, 7089–7120, 2004Ozone loss
A. D. Robinson et al.
Title Page Abstract Introduction Conclusions References Tables Figures ◭ ◮ ◭ ◮ Back Close
Full Screen / Esc
Print Version
Interactive Discussion
©EGU 2004
CFC-11, pptv
0 50 100 150 200 250 300
P ot ent ia l te m p er at ur e, K 250 300 350 400 450 500 550 600 CFC-11, pptv
0 50 100 150 200 250 300
P ot ent ia l te m p er at ur e, K 250 300 350 400 450 500 550 600
O3, ppbv
0 500 1000 1500 2000 2500 3000 3500 4000
P ot en ti al t em pe ra tu re , K 250 300 350 400 450 500 550 600
O3, ppbv
0 500 1000 1500 2000 2500 3000 3500 4000
P ot en ti al t em pe ra tu re , K 250 300 350 400 450 500 550 600
Bonbon 27 Jan 00 LACE 5 Mar 00 LACE 19 Nov 99
Bonbon 1 Mar 00 DIRAC
19 Jan 00 27 Jan 00 5 Mar 00 8 Mar 00
d
(symbols as panel b)c
(symbols as panel a)b
a
DESCARTES3 Dec 99 15 Dec 99 28 Jan 00 1 Mar 00 7 Mar 00
Bonbon 27 Jan 00 LACE 5 Mar 00 LACE 19 Nov 99
Bonbon 1 Mar 00
ACPD
4, 7089–7120, 2004Ozone loss
A. D. Robinson et al.
Title Page Abstract Introduction Conclusions References Tables Figures ◭ ◮ ◭ ◮ Back Close
Full Screen / Esc
Print Version
Interactive Discussion
©EGU 2004
y = 4.25 + 1.116x, r2 = 0.9985 y = 19.02 + 0.955x, r2 = 0.9951
DESCARTES 28 Jan CFC-11, pptv 0 50 100 150 200 250 300
In te rpol at ed D IR A C / B onbo n C F C -11, ppt v 0 50 100 150 200 250 300
DESCARTES 7 Mar CFC-11, pptv 0 50 100 150 200 250 300
Int er pol at ed D IR A C / L A C E 5 M ar C F C -1 1, p pt v 0 50 100 150 200 250 300
a
b
DIRAC 27 Jan Bonbon 27 Jan
y = x y = x
DIRAC 5 Mar LACE 5 Mar
Fig. 3. Plots comparing DIRAC and DESCARTES measurements from late January (panel
ACPD
4, 7089–7120, 2004Ozone loss
A. D. Robinson et al.
Title Page Abstract Introduction Conclusions References Tables Figures ◭ ◮ ◭ ◮ Back Close
Full Screen / Esc
Print Version
Interactive Discussion
©EGU 2004
8.3.00
O3, ppbv
0 1000 2000 3000 4000
P o te n ti al t em p e ra tu re , K 250 300 350 400 450 500 550 600 CFC-11, pptv 0 50 100 150 200 250 300
5.3.00
O3, ppbv
0 1000 2000 3000 4000
CFC-11, pptv 0 50 100 150 200 250 300
27.1.00
O3, ppbv
0 1000 2000 3000 4000
CFC-11, pptv 0 50 100 150 200 250 300
19.1.00
O3, ppbv 0 1000 2000 3000 4000
P o te n ti a l te m p er at u re , K 250 300 350 400 450 500 550 600 CFC-11, pptv 0 50 100 150 200 250 300
3.12.99
O3, ppbv
0 1000 2000 3000 4000
P o te n ti al t em p er at u re , K 250 300 350 400 450 500 550 600 CFC-11, pptv 0 50 100 150 200 250 300
15.12.99
O3, ppbv
0 1000 2000 3000 4000
CFC-11, pptv 0 50 100 150 200 250 300
28.1.00
O3, ppbv
0 1000 2000 3000 4000
CFC-11, pptv 0 50 100 150 200 250 300
1.3.00
O3, ppbv
0 1000 2000 3000 4000
CFC-11, pptv 0 50 100 150 200 250 300
7.3.00
O3, ppbv
0 1000 2000 3000 4000
P o te n ti al t em p er at u re , K 250 300 350 400 450 500 550 600 CFC-11, pptv 0 50 100 150 200 250 300
a b c d
e f g h i
O3 measurement
O3 SLIMCAT
CFC-11 measurement CFC-11 SLIMCAT
Fig. 4. Comparisons between the measurements and SLIMCAT data for CFC-11 and ozone
ACPD
4, 7089–7120, 2004Ozone loss
A. D. Robinson et al.
Title Page Abstract Introduction Conclusions References
Tables Figures
◭ ◮
◭ ◮
Back Close
Full Screen / Esc
Print Version
Interactive Discussion
©EGU 2004
instrument ascent instrument descent SLIMCAT ascent SLIMCAT descent
ClO, pptv
0
400
800
1200
1600
P
ot
en
ti
al
t
em
pe
ra
tu
re
,
K
300
350
400
450
500
550
600
650
700
instrument ascent
SLIMCAT ascent
ACPD
4, 7089–7120, 2004Ozone loss
A. D. Robinson et al.
Title Page Abstract Introduction Conclusions References
Tables Figures
◭ ◮
◭ ◮
Back Close
Full Screen / Esc
Print Version
Interactive Discussion
©EGU 2004
CFC-11, pptv
0 50 100 150 200 250 300 O3
,
p
pbv
0 500 1000 1500 2000 2500 3000 3500 4000
CFC-11, pptv
0 50 100 150 200 250 300 O3
,
p
pbv
0 500 1000 1500 2000 2500 3000 3500 4000
early Dec 1999 late Jan 2000
Merged data Merged data
late Jan 2000 early Mar 2000
LACE 19 Nov 99 Bonbon 27 Jan 00
Bonbon 27 Jan 00 Bonbon 1 Mar 00 LACE 5 Mar 00
a b
ACPD
4, 7089–7120, 2004Ozone loss
A. D. Robinson et al.
Title Page Abstract Introduction Conclusions References
Tables Figures
◭ ◮
◭ ◮
Back Close
Full Screen / Esc
Print Version
Interactive Discussion
©EGU 2004
CFC-11, pptv
0 50 100 150 200 250 300 O3
,
p
pbv
-500 0 500 1000 1500 2000 2500 3000 3500 4000
CFC-11, pptv
0 50 100 150 200 250 300 O3
,
p
pbv
-500 0 500 1000 1500 2000 2500 3000 3500 4000
a early Dec 1999 b
late Jan 2000 early Mar 00
late Jan 00
Fig. 7. The relationship between SLIMCAT CFC-11 and ozone for the DIRAC/DESCARTES
ACPD
4, 7089–7120, 2004Ozone loss
A. D. Robinson et al.
Title Page Abstract Introduction Conclusions References
Tables Figures
◭ ◮
◭ ◮
Back Close
Full Screen / Esc
Print Version
Interactive Discussion
©EGU 2004
O
3, ppbv
-1600
-1200
-800
-400
0
P
o
te
nt
ia
l t
em
pe
ra
tur
e, K
250
300
350
400
450
500
550
600
mid Dec to late Jan late Jan to early Mar DIRAC/DESCARTES
27 Jan to 5 Mar (Bonbon/LACE) SLIMCAT Dec to Jan
SLIMCAT Jan to Mar