STABILITY OF THE BETA PHASE IN Ti-Mo-Cr ALLOY FABRICATED BY
POWDER METALLURGY
J. Syarifa,*, T.N. Rohmannudina, M.Z. Omara, Z. Sajuria,S. Harjantob
aUniversiti Kebangsaan Malaysia, Faculty of Engineering and Built Environment, Bangi, Malaysia bUniversitas Indonesia, Faculty of Engineering, Depok, Indonesia
(Received 24 October 2012; accepted 21 June 2013)
Abstract
A new βTi alloy was designed and fabricated by powder metallurgy process using pure metallic powders. The addition of Mo and Cr increased the stability of the βphase. By contrast, O promoted αphase formation upon cooling. The addition of 18%Mo and 10%Cr stabilized the βphase into ambient temperature. O increased the critical cooling rate of formation of αphase due to the prediction of the continuous cooling transformation diagram calculated by the Java-based Material Properties software. Sintering and solution treatment also enhanced the alloying behavior of pure powders to their designated chemical compositions. Hardness of the alloy decreased with increasing Mo and Cr content, which led to the decrease of αphase. The Ti-18%Mo-10%Cr alloy exhibited better corrosion resistance than a commercial Ti-6%Al-4%V alloy, which is used as current biomaterial.
Keywords: Alloying behavior; Oxygen; Critical cooling rate; Hardness; Corrosion resistance; Biomaterials.
* Corresponding author: [email protected]
S e c t i o n B : M e t a l l u r g y
DOI:10.2298/JMMB121024030S 1. Introduction
The demand for metallic materials for biomedical devices has grown rapidly in recent years [1]. For example, hip replacements made metallic materials such as titanium and stainless steels are projected to reach 272,000 units by 2030 [1]. Ti alloys have excellent specific strength and corrosion resistance compared with other metallic materials [2]. For this reason, the application of commercial pure (CP) Ti and Ti-6%Al-4%V alloy as implant materials has increased significantly. However, the CP Ti and the Ti-6%Al-4%V alloy suffer from biomechanical incompatibility because of their high elastic modulus (about 120 GPa) compared with human bone (around 30GPa). Therefore, studies on designing β-type Ti alloy, which has low elastic modulus, have focused on the use of Nb, Ta, Zr, and Hf [3-5] owing to their biocompatibility with the human body. Other elements, such as Mo and Cr, have been found to be effective alloying elements for a new βTi alloy [6]. These elements are βstabilizers and can also increase Mo equivalent [6]. They have been used as implant materials, such as in 304- and 316-stainless steel and in Co-Cr-Mo alloys [7]. Therefore, these elements are potential components for the new βTi alloy.
The powder metallurgy (PM) process is used to fabricate a new βTi alloy because it is effective and versatile in producing complex and near net shape
components [8]. Products fabricated using this process exhibit properties that are similar to those fabricated using other processes. However, O is picked up as an impurity in the product during the PM process. Thus, O might have a significant effect on the microstructure and mechanical properties of Ti alloys [9].
In this study, a new β-type Ti alloy constituted by Mo and Cr was designed and fabricated through the PM process using pure metallic powders. The effects of Mo, Cr, and O on the phase stability and microstructural change of the alloy were investigated to clarify alloying behavior on sintering. Then, hardness and corrosion resistance were also investigated for the obtained β-Ti alloy.
2. Alloy Design and Experimental Procedures
molecular orbital method, which calculates a bond order Boand a metal d-orbital energy level Md [11]. The average values of the Boand the Mdare generally defined by taking the compositional averages of the parameters; such values are denoted as Boave and
Mdave, respectively, as shown in the following
equations:
Boave= fTi.BoTi+ fMo.BoMo+ fCr.BoCr, ...(1)
Mdave= fTi.MdTi+ fMo.MdMo+ fCr.MdCr, ...(2) where fTi, fMo, and fCrare the atomic fractions of Ti, Mo and Cr, respectively. The values of Bo in the order of Ti, Mo, and Cr were 2.790, 3.063 and 2.779, while those of Md were 2.447, 1.961 and 1.478, respectively.
Calculation of the Boave and Mdave values was performed for six types of Ti alloys (†1). The stable phase of the Ti alloy was predicted by plotting Boave
and Mdavevalues on a Bo-Md map [11]. Although the
Mo equivalent showed that the addition of 9.8% Mo can stabilize the βphase at ambient temperature, the Bo-Md method suggests that the Ti-9.8% Mo alloy would lay on an α+βstructure, while other Ti alloys would lay on a single βregion.
In this study, commercial pure Ti, Mo, and Cr powders were used as raw materials. All powders were supplied by Alfa Aesar Co (USA). Table 1 shows the purity and particle size of the powders used. The powders were mechanically blended for 3.6 ks. The blended powders were placed in a die cavity with a diameter of 10 mm. These were then consolidated under a pressure of 1000 MPa for 3.6 ks, using a 9-tonne capacity cold press machine at ambient temperature. All samples were subjected to sintering at 1300 οC for 14.4 ks and furnace-cooling. Solution
treatment at 1100 οC for 3.6 ks, followed by
water-quenching, was carried out for all the samples. Sintering and solution treatment were conducted in an Ar gas atmosphere after achieving vacuumed condition. Microstructures were observed by optical microscopy and scanning electron microscopy (SEM). Samples were etched using a Kroll’s reagent. The distribution of elements in the sample was analyzed using SEM-energy-dispersive X-ray spectroscopy (EDS). Phase characterization was evaluated by X-ray diffractratometry (XRD) with Cu-Kα radiation. The concentrations of O and N were measured by NOH gas determinator. Hardness was represented by the average of five measurements in Vickers hardness testing (load 19.6N). Potentiodynamic polarization studies were carried out after 60 s of immersion in Hank’s solution for Ti-18%Mo-10%Cr alloy and Ti-6%V-4%Al alloy. Potentiodynamic polarization scans were carried out at a scan rate of 2 mV/ s in the range from –1.0 to 1.0 V vs. SCE. A software package, called Java-based Material Properties (JMatPro), was used to simulate
the decomposition of the β phase upon cooling. JMatPro was developed to predict needful material properties using thermodynamic calculation, which integrated various theoretical material models and properties database [12]. The software has been used by many researchers to perform thermodynamic calculations for alloys in equilibrium conditions, such as precipitation [13] and equilibrium phase transformation [14], and also for nonequilibrium conditions, such as time-temperature transformation (TTT) and CCT [15, 16].
Table 1.Particle size and purity of powders used.
3. Results and Discussion
3.1 Stability of βphase and alloying behavior
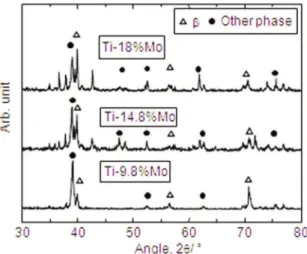
Figure 1 shows the XRD diffractograms of the Ti-Mo alloy. Peaks for the β and other phases were observed in the Ti-Mo alloy although 18%Mo was added to the alloy. Figures 2 show the optical micrographs of the Ti-Mo alloys. Dual-phase structures (i.e., needlelike structures within the matrix) were observed in the samples. Besides the dual-phase structures, pores, which are indicated by arrow signs, are also observed eventhough the samples have been subjected to sintering and solution treatment. Although the Mo equivalent and the Bo-Md method suggested that the single β phase would exist in Ti-18% Mo alloy, βphase was not yet fully stabilized in the Ti-Mo alloys. Pham et al. reported
†1 The six types of alloys were Ti-5at.%Mo, Ti-8at.%Mo, Ti-10at.%Mo, Ti-10at.%Mo-1at%Cr, Ti-10at.%Mo-5at.%Cr, and 10at.%Mo-10at.%Cr. Hereafter, these alloys were expressed in wt.%: 9.8%Mo, 14.8%Mo, 18%Mo, Ti-18%Mo-1%Cr, Ti-18%M0-5%Cr, and Ti-18%Mo-10%Cr.
Element Particle size/ mesh Purity /%
Ti -325 99
Mo -170 99.5
Cr -325 99
that a microstructure, such as the dual-phase structure, can influence the mechanical properties and corrosion resistance of biomedical Ti alloys [17]. Thus, addition of Cr would be effective for stabilizing single β phase into ambient temperature, because the Mo equivalent showed that Cr stabilized the βphase 1.6 fold higher than Mo [6].
Figure 3 shows XRD diffractograms of the ternary Ti-18%Mo-Cr alloy. The single βphase could still not be obtained after the addition of 1%Cr to the Ti-18%Mo alloy. The stability of the βphase increased by adding 5% Cr, but a single β phase was observed in the Ti-18%Mo-10% Cr alloy. Figures 4 shows the optical micrographs of the Ti-18%Mo-Cr alloys. In all samples, pores, which are indicated by the arrow signs, were still observed in all samples. It is found that Ti-18%Mo-1%Cr alloy and Ti-18%Mo-5% alloy still exhibited the dual-phase structures. Finally, an equiaxed structure (i.e., a typical β structure) was obtained in the Ti-18%Mo-10%Cr alloy as shown in Figure 4c. These micrographs correspond well with the XRD difractograms shown in Figure 3. Thus, the addition of 18%Mo and 10%Cr stabilized the single β phase into ambient temperature, and a new single β-phase Ti alloy was successfully obtained.
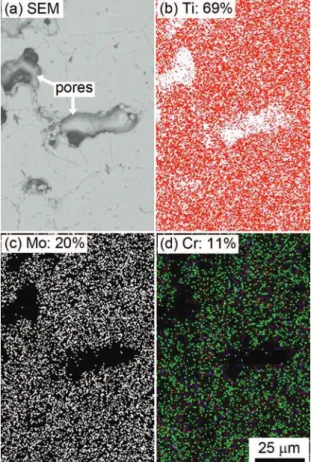
Meanwhile, Figure 5 shows a backscattered electron image and an elemental mapping measured by EDS for the Ti-18%Mo-10%Cr alloy. As can be seen, all elements were well distributed within the sample. The concentration of each element, measured Figure 2. Optical micrographs of Ti-Mo alloys.
Figure 3. XRD diffractograms of the Ti-18%Mo-Cr alloys.
by area-mapping mode EDS, is shown in the images close to the designated chemical composition (i.e., 72%Ti-18%Mo-10%Cr). The diffusivity of Cr in the β
Ti matrix was four times as high as the self-diffusivity of Ti [18]. Hence, pure Cr powder dissolved easily, and Cr atoms were distributed homogenously in the
β matrix of Ti. Mo also reached its designated chemical composition by sintering although the diffusivity of Mo was just one-half that of Ti [18]. Sintering was carried out to enhance interparticle binding among particles. The porosity of Ti-18%Mo-10%Cr alloy was measured by Image-J software, and was found to be around 6 vol.%. From these results, both alloying and interparticle binding of the pure metallic powders were enhanced due to the diffusion of elements. The designated chemical compositions were thus obtained by sintering and solution treatment. The decrease in stability of the β phase was not caused by undissolved metallic powders or alloying elements. Instead, such decrease, as represented by the XRD peak of other phases in Figure 1 and Figure 3, could be due to the formation of martensite (such as α’ and α”) or the ω phase upon cooling.
Dobromyslov et al. reported that the addition of 5at.%Mo can decrease martensite start (Ms)
temperature to 273 K [19]. Min et al. have reported that the formation of the ω phase is suppressed by the addition of 15 mass% Mo [20]. Thus, the decrease in β-phase stability of alloys containing 9.8% Mo (5at.% Mo) Mo or more could not be explained by the formation of martensite and the ω phase. It is indicated that the dual-phase structures as shown in Figure 2 and Figure 4 were not composed by the α’, α” or ωphases besides the βphase.
Table 2 represents concentrations of O and N in the Ti-18%Mo-Cr alloy after sintering and solution treatment. The impurity content, especially O, was high in this alloy compared with the O content of the other Ti alloys fabricated by the PM process (up to 0.3wt.%) [21]. Therefore, the concentration of O in the Ti-18%Mo-10%Cr alloy decreased the β phase stability because the impurity is a strong α stabilizer.
Table 2. Oxygen and nitrogen contaminations in samples.
To clarify the effect of O on phase transformation from the β-phase region upon cooling, a continuous cooling transformation was estimated by JMatPro. The calculation for the CCT diagram of the Ti-18%Mo-Cr alloys was carried out by considering the following parameters: soaking temperature was 1000
οC, size of prior β grain was 100 µm, and the
formation of 0.5 vol.% of αwas defined as a start of
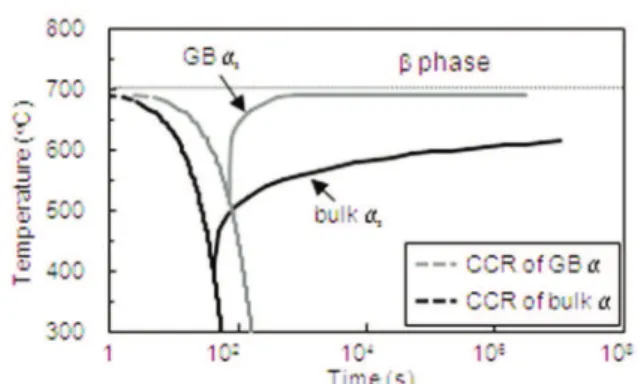
β → α transformation (αs). Figure 6 shows a result of a calculation of the CCT diagram for Ti-18%Mo alloy with 0 wt.% O. As can be seen from the CCT diagrams of both alloys, two types of α phases precipitated from the β phase upon cooling, namely, the αphase along the prior βgrain boundaries (GB α) and the αphase in the prior βgrain interior (bulk α). The βphase was decomposed into the αphases by a diffusional transformation. No curve for a finish of the
β → α transformation (αf) was estimated by the JMatPro. The critical cooling rates of the formation of the bulk αphase (CCR of bulk α) and the formation of the GB α phase (CCR of GB α) are also superimposed in Figure 6. The CCR of GB α was slower than the CCR of bulk α. Moreover, GB α, bulk
α, and β phases were predicted to coexist when the cooling rate was slower than the CCR of the GB α. The combination of the bulk α and β phases was obtained upon moderate cooling, which was lower than the CCR of the bulk α. When the cooling rate was faster than the CCR of the bulk α, then only the
β phase existed because the Ms temperature in the alloy was also predicted to be much lower than the ambient temperature.
Figure 7 shows the relationship between O Figure 5. BSE image and elemental mapping of the
Ti-18%Mo-10%Cr alloy.
Alloy Oxygen / wt.% Nitrogen / wt.%
Ti-18%Mo-1%Cr 0.76 0.06
Ti-18%Mo-5%Cr 0.92 0.09
concentration and the CCRs of GB αand bulk α of the Ti-18%Mo alloy and the Ti-18%Mo-5%Cr alloy.
As can be seen, all CCRs increased with rising O concentration. The CCR of GB α demonstrated a slight dependence on Cr concentration. The CCR of bulk α exhibited a gradual increase of up to 0.5% O, and then an abrupt increase was observed; this also decreased significantly when 5%Cr was added. This calculation indicated that O significantly influenced the formation of α phase upon cooling, and an increase in Cr concentration retarded the formation of the αphase. For instance, the CCR of bulk αof the Ti-18%Mo-5%Cr alloy with 0.7% O was almost the same as that of the Ti-18%Mo alloy. The CCR of bulk
α of the Ti-18%Mo alloy increased threefold due to the addition of 0.7% O. Moreover, the addition of 5%Cr decreased the CCR of bulk α to about one-seventh of the amount for the Ti-18%Mo-0.7%O alloy. Hence, Cr had an inverse proportional relationship with O, although the influence of O was more effective than that of Cr. Therefore, the aforementioned estimation was consistent with the
result, thus revealing an improvement in the βphase of the Ti-18%Mo alloy caused by the addition of Cr (Figures 1 and 3). Furthermore, the aforementioned results also indicated that the dual-phase microstructures, which are observed in Figure 2 and Figure 4, were composed by the the diffusional α
phase (i.e., the GB αand the bulk α) and the βphase. The effects of O and Cr on the change in the β
transus can be observed in following equation [22]:
∆βtr ≈ -9.5[Mo] - 12.1[Cr] + 123.0[O]. ...(3) Equation (3) shows that O has a significant effect on the increment of the βtransus compared with Cr. For instance, the increment of the β transus was around 86 οC, because of the addition of 0.7% O.
Around 7% Cr should be added to set off the effect of 0.7% O. The increase in O content expanded the α+β
region and induced the β → α transformation at a relatively elevated temperature within the α+βregion. This result indicated that O promoted the formation of
αwithin the α+βregion upon cooling. This could be attributed to an increase in the nucleation rate and a promotion of the growth rate of nuclei caused by the increase in the βtransus. The nucleation rate is known to be dependent on nucleation energy or the driving force of β → α transformation, which can be estimated by the following relation: 4.0 J/mol x ∆T [23]. The driving force was estimated to be around 20 J/mol by applying supercooling (∆T) for γ → α
transformation of Fe (i.e., 50 oC) [24]. The calculation of the change in Gibb’s free energy using the JMatPro for Ti-18%Mo alloy suggested that the change in free energy was around 22.49 J/mol when the alloy was supercooled at 50 οC from the βtransus
(737 οC). The β transus was shifted to elevated
temperatures by O contamination. As a result, supercooling increased along with the applied cooling rate, and β → α transformation was remarkably enhanced.
For O segregation into the β grain boundary, McLean [25], and Seah & Hondros [26] have proposed equations for estimating amount of segregation of impurity. Moreover, Takaki et al. have explained that Seah and Hondros’ equation is more accurate for estimating carbon segregation in engineering metals such as C steel [27]. The amount of segregation of impurity proposed by Seah and Hondros is shown in the following equation:
(XBo/XB){XM/(XMo - XM)} =
(1/K) + {(K-1)/K}(XM/XMo), ...(4)
where XBOis a saturation concentration at the grain boundary, XBis a concentration at the grain boundary,
XMois a solubility in the matrix, XMis a concentration in the matrix, and Kis a thermal factor. The value of
K is equal to exp (Q/RT) where Q is the thermal energy that shows the difference between the matrix and the grain boundary. The value of Qis 7.32 kJ/mol, Figure 6. CCT diagram of Ti-18%Mo alloy with 0%O.
and it is independent from the alloy system. The atomic solubility (XMO) of O in the Ti-18%Mo alloy
was predicted to be 0.072 at 1273 K by JMatPro. Although XBois unknown, TiO2 has been reported to be the most stable Ti oxide in the Ti alloy [28]. Thus,
XBowas assumed to be 0.67. XB was calculated to be
around 0.45 (equal to 18.6wt% O) by substituting the values to Equation (4). Therefore, a huge amount of O was suggested to segregate into the βgrain boundary. Wu et al. [29] and Wei et al. [30] have also reported that O atoms segregate into the grain boundary of the
β phase. The segregation of atom facilitates the formation of nucleation on the grain boundary [31], and O is an α stabilizer; thus, the formation of the α
phase can be promoted along the β grain boundary upon cooling. Wu et al. have also reported that the α
phase precipitates preferentially along the β grain boundary because of the O segregation in that region [29]. The aforementioned explanations are in good agreement with the finding of the current study. The α
phase formation was promoted upon cooling because of the increase in O concentration. In addition, the increase in O was also effective in retarding the formation of the ωphase upon cooling [32].
In contrast to the finding of the present study, Abdel Hady et al. showed that high O levels promote the stability of the βphase into ambient temperature [33]. Ti-29%Nb-13%Ta-4.6%Zr and Ti-34.6%Nb-7.3%Zr-5.6%Ta alloys, which contain 0.7% O, still exhibited the β phase characteristics at ambient temperature [30, 34-36]. To explain the effect of O on the stability of β in the aforementioned alloys, the CCRs of bulk α of the Ti-Nb-Ta-Zr alloys were calculated by JMatPro and plotted in Figure 7. The Ti-Nb-Ta-Zr alloys were found to have very small CCRs of bulk α although the concentration of O was very high in these alloys. The alloys contained high levels of heavy elements such as Nb, Ta, and Zr aside from the high amount of O. Hence, these elements may have induced a solute-drag effect because of their larger atomic radii, possibly retarding the growth of α
nuclei during β à α transformation. Tang et al. reported that Nb can reduce the CCR of β → α
transformation of Ti alloy upon cooling [37]. The stability of the βphase in the Ti-Nb-Ta-Zr alloy was not promoted by O, but caused by the high concentration of Nb, Ta, and Zr. Mo and Cr in the alloy were relatively low in concentration, and thus could not remarkably lower the CCR. Furthermore, the N in the sample was also believed to influence the promotion of the formation of the α phase upon cooling, although the concentration of N was lower than that of O [38]. The reason is that N is also an α
stabilizer and has almost the same Al equivalent with O. Based on the aforementioned result, the single β
phase was obtained by adding 18%Mo and 10%Cr and by applying the PM method. The addition of Mo
and Cr increased the stability of the β phase. By contrast, O promoted the formation of the α phase upon cooling. The rise in O content increased CCR for the formation of the α phase. Furthermore, sintering and solution treatment enhanced the alloying behavior of pure metallic powders to their designated chemical compositions.
3.2 Hardness and corrosion resistance of the Ti-18%Mo-10%Cr alloy
Figure 8 represents hardness of the Ti-Mo alloys and 18%Mo-Cr alloys. It is found that the Ti-18%Mo-10%Cr alloy, which consisted of single β
phase, exhibited the lowest hardness among other samples. Since the β-grain size of the Ti-18%Mo-10%Cr alloy was quite large, i.e. 100 µm, the hardness of the alloy was dominated by the solid solution hardening of Mo, Cr and O. On the other hand, the hardness of other samples were thought to be controlled by combination of the solid solution hardening of Mo, Cr and O and the precipitation hardening of the α phase. It is because the α phase and the βphase coexisted in the other samples.
It is shown that the hardness of all samples decreased with increasing the concentration of Mo and Cr. The decrease of the hardness might be affected by the decrease of the α phase owing to the addition of Mo and Cr, which could increase the stability of the βphase. Although the contribution of each strengthening mechanism has not been clarified yet, it is suggested that the precipitation strengthening of α phase was predominant than the other strengthening. For instance, the hardness of the Ti-9.8% Mo alloy, which contained the lowest concentration of alloying elements, was 1.5 fold higher than that of the Ti-18%Mo-10%Cr alloy, which had the highest concentration of alloying elements. The aforementioned result suggested that the β
18%Mo-10%Cr alloy had suitable hardness for implant materials because its hardness is almost similar to the hardness of other βTi alloys such as Ti-8Fe-8Ta alloy, Ti-Ti-8Fe-8Ta-4Zr alloy and Ti-10Fe-10Ta-4Zr alloy, which have been developed by other researchers [39].
Figure 9 shows polarization curves of the β -Ti-18%Mo-10%Cr alloy and Ti-6%Al-4%V alloy as a reference material. Both cathodic and anodic branches on the polarization curve of the Ti-18%Mo-10%Cr alloy was lower current density than that of the 6%V-4%Al alloy. The corrosion currents of the Ti-18%Mo-10%Cr alloy and the Ti-6%Al-4%V alloy were 0.61µA/cm2 and 1.03µA/cm2, respectively. Furthermore, it is clear that the Ti-18%Mo-10%Cr alloy shows nobler corrosion potential as compared with the Ti-6%Al-4%V alloy. Hence, the polarization investigation indicated that the newly designed Ti-18%Mo-10%Cr alloy has better corrosion resistance than commercial Ti-6%Al-4%V alloy.
4. Conclusion
A new β-type Ti alloy constituted by Mo and Cr was designed and fabricated through the PM process using pure metallic powders were performed and the following findings were obtained.
1. The single βphase of Ti at ambient temperature was obtained by addition of 18%Mo and 10%Cr and by applying the PM method. The alloying behavior of pure metallic powders to their designated chemical compositions has been enhanced through sintering and solution treatment.
2. Addition of Mo and Cr increased the stability of the βphase while O promoted the formation of the α
phase upon cooling. The rise in O content increased CCR for the formation of the αphase. These can be attributed to the increase in the driving force of β→
α transformation and the promotion of formation of
the αphase caused by the grain-boundary segregation of O.
3. The Ti-18%Mo-10%Cr alloy exhibited almost the same hardness with other β-Ti alloys and better corrosion resistance than the commercial Ti-6%Al-4%V alloy.
Acknowledgements
Financial support from UKM (UKM-AP-NBT-14-2010) and from Malaysian MOHE (ERGS/1/ 2012/TK04/UKM/02/5) is greatly acknowledged.
References
[1] H.J. Rack, J.I. Qazi, Materials Sci. Eng., C26 (2006) 1269-1277.
[2] M. Niinomi, Met Mater Trans., 33A (2002) 477-486 [3] E.B. Taddei, V.A.R. Henriques, C.R.M. Silva, C.A.A
Cairo, Mater. Sci. Eng., C24 (2004) 683-687 [4] M. Niinomi, Mater. Scie.Eng., A243 (1998) 231-236. [5] P.J. Bania, in Beta Titanium Alloys in the 1990’s (D.
Eylon, R. Boyer, D. Koss), TMS, Warrendale, 1993, p. 3-24.
[6] G. Lutjering, J.C. Williams, Titanium, second ed., Springer-Verlag, Berlin, 2007, p. 30.
[7] R.M. Pilliar, in Biomedical Materials (R. Narayan), Springer Science+Business Media, New York, 2009, pp. 41-81.
[8] M. J. Donachie, Titanium Technical guide: A Technical Guide, second ed., ASM International, Ohio, 2004, p. 47.
[9] Y.G. Li, P.A. Blenkinsop, M.H. Loretto, D. Rugg, W. Voice, Acta Mater., 47 (1999) 2889-2905.
[10] E. W. Colling, in Materials properties Handbook: Titanium Alloys (R. Boyer, G. Welsch, E. W. Colling), ASM Materials Park, Ohio, 1994, p. 3-114.
[11] M. Morinaga, M. Kato, T. Kamimura, M. Fukumoto, I. Harada, K. Kubo, Proceedings of a Symposium of Titanium, June 29-July 2, San Diego, USA, 1993, p. 217-224.
[12] N. Saunders, Z. Guo, X. Li, A.P. Miodownik, J.-P. Schille´, JOM, 12 (2003) 60-65.
[13] Z. Guo, W. Sha, Mater. Sci. Eng., A 392 (2005) 449-452.
[14] M. Gomez, C.I. Garcia, D.M. Haezerbrouck and A.J. Deardo, ISIJ Intl., 49 (2009) 302-311.
[15] N. Saunders, S. Kucherenko, X. Li, A.P. Miodownik, J.-P. Schille´, J. Phas. Equi., 22 (2001) 463-469. [16] D.A. Akinlade, W.F. Caley, N.L. Richards, M.C.
Chaturvedi, Mater. Sci. Eng., A486 (2008) 626-633. [17] M.T. Pham, I. Zyganow, W. Matz, H. Reuther, S.
Oswald, E. Richter, E. Wieser, Thin Solid Films, 310 (1997) 251-259.
[18] H. Nakajima, M. Koiwa, ISIJ Intl., 31(1991) 757-766. [19] A.V. Dobromyslov, V.A. Elkin, Scripta Mater.,
44(2001) 905-910.
[20] X.H. Min, K. Tsuzaki, S. Emura, K. Tsuchiya, Mater. Sci Eng., A528 (2011) 4569-4578.
[21] Annual Book of ASTM Standard B817-08, ASM Intl.,
West Conshohocken, 1988.
[22] Z. Guo, S. Malinov, W. Sha, Comp. Mater. Sci., 32 (2005) 1-12.
[23] M.S. Oh, J.Y. Lee, J.K. Park, Metal. Mater. Trans., 35A (2004) 3071-3077.
[24] S. Takaki, K. Tsuzaki, Microstructure of Material, Asakura Shoten, Tokyo,2000, p. 100 (in Japanese). [25] D. McLean, Grain Boundaries in Metals, Oxford
University Press, 1957.
[26] M.P. Seah, E.D. Hondros, Scripta Met., 7 (1973) 735-737.
[27] S. Takaki, N. Nakada, T. Tsuchiyama in Advanced Steels: The Recent Scenario in Steel Science and Technology,(Y. Weng, H. Dong, Y. Gan) Springer, Berlin, 2011, p. 81-86.
[28] M.P. Neupane, I.S. Park, S.J. Lee, K.A. Kim, M.H. Lee, T. Sung, Int. J. Electrochem. Sci., 4 (2009) 197-207. [29] X. Wu, J. del Prado, Q. Li, A. Huang, D. Hu, M.H.
Lorretto, Acta Mater., 54 (2006) 5433-5448.
[30] Q. Wei, L. Wang, Y Fu, J. Qin, W. Lu, D. Zhang, Mater & Design, 32 (2011) 2934-2939.
[31] J.W. Martin, R.D. Doherty, B. Cantor, Stability of Microstructure in Metallic Systems, second ed., Cambridge University Press, Cambridge, 1997, p. 57. [32] N. Wain, X.J. Hao, G.A Ravi, X. Wu, Mater. Sci. Eng.,
A 527 (2010) 7673-7683.
[33] M. Abdel-Hady, K. Hinoshita, M. Morinaga, Scripta Mater., 55 (2006) 477-480.
[34] F. Geng, M. Niinomi, M. Nakai, Mater. Sci. Eng, A528 (2011) 5435-5445.
[35] J.I. Qazi, B. Marquardt, H.J. Rack, JOM 11 (2004) 49. [36] T. Saito, T. Furuta, J.H. Hwang, S. Kuramoto, K. Nishino, N. Suzuki, R. Chen, A. Yamada, K. Ito, Y. Seno, T. Nonaka, H. Ikehata, N. Nagasako, C. Iwamoto, Y. Ikuhara, T. Sakuma, Science, 300 (2003) 464-467.
[37] X. Tang, T. Ahmed and H.J. Rack, J. Mater. Sci. 35 (2000) 1805-1811.
[38] P.-J. Arrazola, A. Garay, L.-M. Iriarte, M. Armendia, S. Marya, F. Le Maître, J. Mater. Proc. Tech., 209 (2009) 2223-2230.