Article
Printed in Brazil - ©2018 Sociedade Brasileira de Química*e-mail: [email protected]
Optimization and Validation of an Extraction Method for Evaluating the Availability
of Cu, Zn, Mn, Ni, Cr and Cd in Soil with the Use of the Mehlich-1 Extractor
Gesiara F. Silva,a Marília B. Galuch,b Alessandro F. Martins,a Danielle G. O. Prado,a
Jesuí V. Visentainer*,b,c and Elton G. Bonaféa,c
aUniversidade Tecnológica Federal do Paraná, Rua Marcílio Dias 635,
86812-460 Apucarana-PR, Brazil
bDepartamento de Química, Universidade Estadual de Maringá,
Avenida Colombo 5790, 87020-900 Maringá-PR, Brazil
cPrograma de Pós-Graduação em Ciência de Alimentos, Universidade Estadual de Maringá,
Avenida Colombo 5790, 87020-900 Maringá-PR, Brazil
The Mehlich-1 extractor is routinely used to evaluate the bioavailability of metals in soil since it has a high closeness between the amount of these elements absorbed by the plants and those available in soil, as well as being simple and practical to use. Thus, the aim of this work was to improve (optimize) a Mehlich-1 extraction method for evaluating the availability of Cu, Zn, Mn, Ni, Cr and Cd in soil using Box-Behnken type response surface method (RSM). After optimizing the soil amount, Mehlich-1 extractor volume and stirring time, the validation of the newly developed method was performed by evaluating the following parameters: matrix adjustment, linearity, linear range, limits of detection (LOD) and of quantification (LOQ), precision and accuracy. The analytical method proposed by this study can be routinely employed for the evaluation of soil toxicity since it presented advantages such as simplicity, speed and efficacy, as well as being precise and accurate.
Keywords: metals, response surface methodology, Box-Behnken, analytical method, soil
Introduction
Contamination of soil by heavy metals has grown worldwide1 and, because they are persistent pollutants, such
elements can be accumulated in soils for long periods,2-4
being harmful to the microbiota, fauna and flora.3,5,6 Ingestion
of plants grown in contaminated soils is considered one of the main routes contributing to human exposure to metals,7
and due to their toxicity, bioaccumulation, persistence3 and
ubiquity,1,6 the United States Environmental Protection
Agency (USEPA)8 considers some heavy metals, including
Cu, Zn, Cr, Ni and Cd, as pollutants with priority for control. Determination of the total amount of heavy metals present in soils contributes to the evaluation of environmental contamination.5 However, it is not a good index to estimate
the bioavailability and toxicity of these elements, since only a fraction of the total amount metals present in the soil are available for absorption by the plants that grow there.9,10
Thus, evaluation of the total quantities of heavy metals in soil can lead to an overestimate exposure, and thus risk.11,12
In order to estimate the amount of bioavailable heavy metals in soil, several types of extractors have been used, seeking to simulate extraction by plant roots. In this sense, the Mehlich-1 extractor (HCl 0.05 mol L-1 +
H2SO4 0.0125 mol L-1) can provide a diagnosis of the
potential availability of metals for plants.13 It is used as a
routine method in several laboratories,14 and is preferred
due to its practicality, presenting a close relationship between the amount absorbed by the plants and the amount available in soil.15 This solution was initially proposed by
Mehlich16 for the availability evaluation of P, Ca, Mg, K, Na
and NH4 in soils. However, in other works, the Mehlich-1
solution is also used to evaluate the availability of other elements, such as Cd, Pb, Cr, Ni, Cu, Zn, Mn and/or Fe.17-20
Optimization of an analysis process aims to increase its efficiency, so that it can be utilized at maximum performance. Optimization can be performed univariably by monitoring the influence of one variable at a time. However, this process underestimates possible interactions between the studied variables.21 Multivariate optimization techniques allow a
multivariate techniques, response surface methodology (RSM) refers to a union of statistical and mathematical techniques that are based on the adjustment of a polynomial type equation to the experimental data, which must describe the behavior of a data set with the purpose of inferring statistical forecasts. In the RSM method, the main focus is to use a sequence of experiments designed to obtain an optimal response,23 allowing the evaluation of the influence
of each variable on the system, as well as the interactions between the variables.24,25
In order to make the performance of the Mehlich-1 extractor more efficient, an extraction method using the Mehlich-1 extractor was optimized for the evaluation of the bioavailability of Cu, Zn, Cr, Ni, Cd and Mn in soil samples. For this purpose, the Box-Behnken type response surface method (RSM) was used, analyzing the following variables: sample amount, Mehlich-1 extractor volume and stirring time. In addition, the efficacy of the methodology proposed in this study was verified using analytical validation parameters such as matrix effects, linearity, linear range, limits of detection (LOD) and of quantification (LOQ), precision and accuracy.
Experimental
Chemicals
Hydrochloric acid and sulfuric acid of analytical grade (Neon, Vila Prudente, SP, Brazil) were used for the preparation of the Mehlich-1 extractor (0.05 mol L-1 HCl +
0.0125 mol L-1 H
2SO4). Reference solutions, used during the
construction of the calibration curves, were prepared with appropriate dilutions of stock solutions of Cu, Zn, Cr, Ni, Cd and Mn standards (1000 mg L-1, Neon, Vila Prudente, SP,
Brazil). Ultrapure water obtained from a water purification system (Milli-Q®, Millipore, Billerica, MA, USA) was used
to prepare all of the solutions used in this work.
Sampling
The soil samples were obtained in partnership with the Laborfort Análises Químicas laboratory (Cambira, Paraná, Brazil), and prepared according to Embrapa.26 The
samples were kept in an oven for 48 h at 60 °C to remove moisture, ground in soil mill (hammer type, model TE-330, Tecnal, Piracicaba, Brazil). Afterwards, the soil sample was submitted to the extraction process, utilizing an orbital stirrer at 180 rpm (model TE-I45, Tecnal, Piracicaba, Brazil).
The soil used during the methodology optimization procedure presented the following characterization
parameters: potential acidity estimated by pH SMP (Shoemaker, McLean and Pratt) method (pH SMP, 6.62), pH in calcium chloride (pH CaCl2, 4.46), pH in water (pH H2O,
5.39), Ca + Mg (6.92 cmolc dm-3), Ca (4.62 cmolc dm-3),
Mg (2.3 cmolc dm-3), K (0.84 cmolc dm-3), Al (0.2 cmolc dm-3),
H (0 cmolc dm-3), sum of bases (SB, 7.76 cmolc dm-3),
cation exchange capacity (CEC, 7.78 cmolc dm-3) and base
saturation (V, 100%).
Instruments
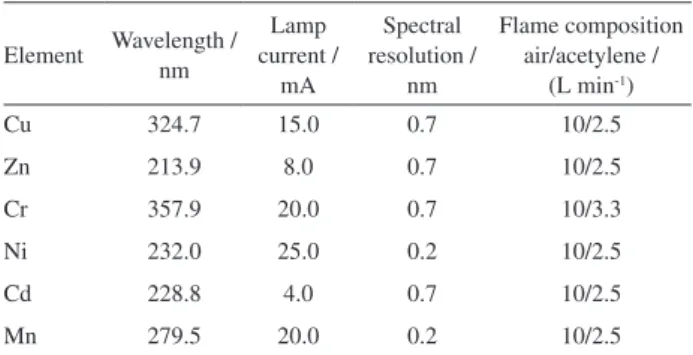
The determination of Cu, Zn, Cr, Ni, Cd and Mn was performed directly on the extract in a PerkinElmer flame atomic absorption spectrometer (PinAAcle 900F, Massachusetts, USA) equipped with a deuterium lamp and a conventional 10 cm acetylene burner. Monoelementary hollow cathode lamps were used for determinations. The instrumental conditions used for the determinations are shown in Table 1.
Optimization of the extraction procedure
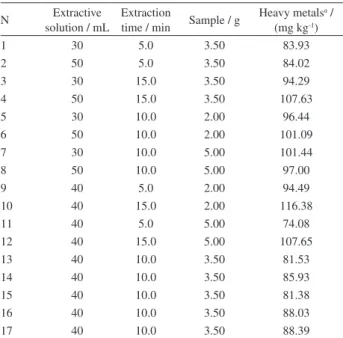
Box-Behnken type response surface methodology (RSM) was used to optimize the experimental conditions for extraction of Cu, Zn, Cr, Ni, Cd and Mn from soil. Throughout the process of optimization of the metal extractions, the soil endogenous amounts were monitored. Three variables were evaluated at three levels: sample amount (g), volume of Mehlich-1 extractor solution (mL), and agitation time (min). For the model construction, the plan consisted of 12 experiments, in addition to five repetitions at the central point, totaling 17 trials, by monitoring the sum of Cu, Zn, Cr, Ni, Cd and Mn concentrations that were extracted from the soil sample. Table 2 illustrates the experiments performed with results of sum of extracted heavy metal concentrations being expressed in mg kg-1.
Table 1. FAASa operating conditions for determination of Cu, Zn, Cr, Ni,
Cd and Mn in soil samples
Element Wavelength / nm
Lamp current /
mA
Spectral resolution /
nm
Flame composition air/acetylene /
(L min-1)
Cu 324.7 15.0 0.7 10/2.5
Zn 213.9 8.0 0.7 10/2.5
Cr 357.9 20.0 0.7 10/3.3
Ni 232.0 25.0 0.2 10/2.5
Cd 228.8 4.0 0.7 10/2.5
Mn 279.5 20.0 0.2 10/2.5
Validation
Matrix adjustment, linearity and linear range
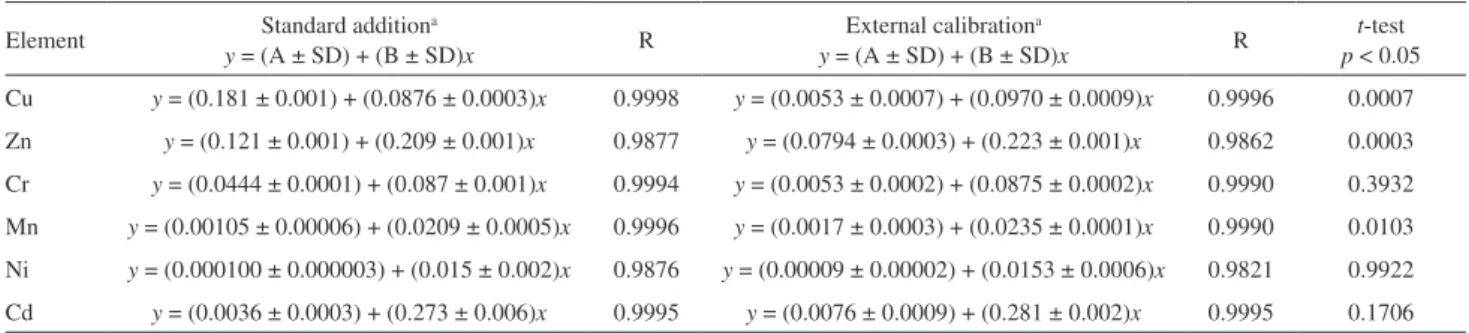
For the evaluation of the presence of matrix interference, external calibration and standard addition curves were obtained for each element (Cu, Zn, Cr, Ni, Cd and Mn), in order to statistically compare the slopes (sensitivity) of the curves obtained through the different methods, using t-test with 95% confidence.27 The linearity and linear range of the
analytical curves were evaluated by the Pearson correlation coefficient according to Srigley and Haile.28 In addition,
the linear model generated in the investigated range was evaluated through analysis of variance (ANOVA).
Limits of detection (LOD) and quantification (LOQ)
The LOD and LOQ were obtained through the equations 1 and 2, respectively.
LOD = 3.3(Sa/b) (1)
LOQ = 10(Sa/b) (2)
where Sa is the absolute standard deviation of the calibration curve intercept and b is the slope of calibration curve, according to Gong et al.29
Precision and accuracy
The intra-day and inter-dayprecision of the proposed analytical method was evaluated at three concentrations for
each element; the metal standards were added before the stirring time; measurements were performed at different times on the same day and on different days, respectively, and the results obtained were expressed using the coefficient of variation (CV in percentage). The accuracy of the method was evaluated by means of recovery tests, at three metal concentrations. Intra-day and inter-day measurements were performed, as for the precision evaluation, and the results were expressed by percent recovery of the concentration added.30
Statistics
Regression and t-test analyses were performed using Statistica software,31 and the experimental design was built
with the help of Design Expert software.32
Results and Discussion
Optimization of the extraction procedure
Based on the results obtained through experimental planning used to maximize the extraction of Cu, Zn, Cr, Ni, Cd and Mn from soil using the Mehlich-1 extractor (Table 2), mathematical model was created to explain the behavior of sum of extracted heavy metal concentrations for which a higher extraction efficiency was desired.
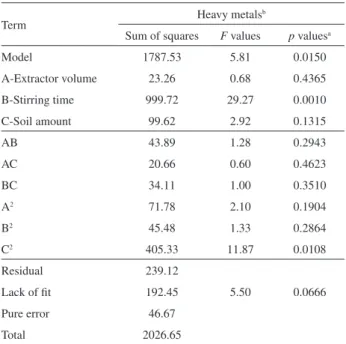
Table 3 shows the analysis of variance (ANOVA) for the model generated for the sum of heavy metal concentrations (Cu, Zn, Cr, Ni, Cd and Mn) that were extracted from soil samples. Based on this information, it can be observed that quadratic model was necessary to best explain the obtained results. The generated model was evaluated based on p value, to test if it could adequately explain the experimentally obtained data at a 95% confidence level. The residuals left by the model were divided into two groups, pure error and lack of fit; the first group was linked to experimental errors and the second group was related to the modeling, respectively. The experimental errors were lower than 3% and the model errors were less than 10%. These results showed that the generated model can explain 88.20% of the total of the selected data, with a determination coefficient (R2) of 0.8820. Furthermore,
the model presents small coefficient of variation (CV) close to the 6%.
From equation 3, response surfaces can be created in order to graphically illustrate (Figure 1) the behavior of the experimentally obtained results and to justify the application of the mathematical model. Synergistic or antagonistic characteristics are shown as a function of the desired response, as well as the importance of each factor
Table 2. Design experimental for extraction of Cu, Zn, Cr, Mn, Ni and Cd from soil samples
N Extractive solution / mL
Extraction
time / min Sample / g
Heavy metalsa /
(mg kg-1)
1 30 5.0 3.50 83.93
2 50 5.0 3.50 84.02
3 30 15.0 3.50 94.29
4 50 15.0 3.50 107.63
5 30 10.0 2.00 96.44
6 50 10.0 2.00 101.09
7 30 10.0 5.00 101.44
8 50 10.0 5.00 97.00
9 40 5.0 2.00 94.49
10 40 15.0 2.00 116.38
11 40 5.0 5.00 74.08
12 40 15.0 5.00 107.65
13 40 10.0 3.50 81.53
14 40 10.0 3.50 85.93
15 40 10.0 3.50 81.38
16 40 10.0 3.50 88.03
17 40 10.0 3.50 88.39
aSum of Cu, Zn, Cr, Ni, Cd and Mn concentrations that were extracted
Table 3. Analysis of variance (ANOVA) generated for the model of the sum of Cu, Zn, Cr, Ni, Cd and Mn concentrations extracted from the soil sample
Term Heavy metals
b
Sum of squares F values p valuesa
Model 1787.53 5.81 0.0150
A-Extractor volume 23.26 0.68 0.4365
B-Stirring time 999.72 29.27 0.0010
C-Soil amount 99.62 2.92 0.1315
AB 43.89 1.28 0.2943
AC 20.66 0.60 0.4623
BC 34.11 1.00 0.3510
A2 71.78 2.10 0.1904
B2 45.48 1.33 0.2864
C2 405.33 11.87 0.0108
Residual 239.12
Lack of fit 192.45 5.50 0.0666
Pure error 46.67
Total 2026.65
aValues of p less than 0.0500 indicate model terms are significant; bCu,
Zn, Cr, Mn, Ni and Cd.
Figure 1. Response surfaces for the adjusted mathematical model for the sum of the extracted heavy metals.
in the response predicted by the model and this information can be observed in each coefficient of the equation 3, showing positive and negative values, contributions of different forms to obtain the response.
Sum of the extracted heavy metal concentrations (mg kg-1) = 215.65 – (3.26 × extractor volume) –
(4.41 × stirring time) – (30.71 × soil amount) + (0.066 × extractor volume × stirring time) – (0.15 × extractor volume × soil amount) + (0.39 × stirring time × soil amount) +
(0.041 × extractor volume2) + (0.13 × stirring time2) +
(4.36 × soil amount2) (3)
Moreover, with data presented in Table 3, it was also possible to identify the determining and most important factors in the construction of the respective model. The individual term B as well as the quadratic term C2 were
significantly different at the 95% confidence level obtained by t-test. Therefore, it is necessary to use standard addition to determine Cu, Zn and Mn by the proposed method.
The linear ranges obtained for the proposed method were: 0.25-5.00 mg L-1 for Mn, Cr, Zn and Cu; 0.10-2.00 mg L-1
for Cd; and 0.05-0.90 mg L-1 for Ni. These linear ranges
were verified through their correlation coefficients (R), presented in Table 4, in which all values were greater than 0.9, as recommended by INMETRO.33 In addition, after
obtaining the linear regression equations for the calibration curves, all p values indicated the significance of the linear models, at a 95% confidence level.
The LOD obtained for Cu, Zn, Cr, Mn, Ni and Cd were 0.010, 0.017, 0.009, 0.009, 0.004 and 0.010 mg kg-1,
respectively, and the LOQ obtained for these elements were 0.098, 0.168, 0.088, 0.085, 0.035 and 0.100 mg kg-1,
respectively.
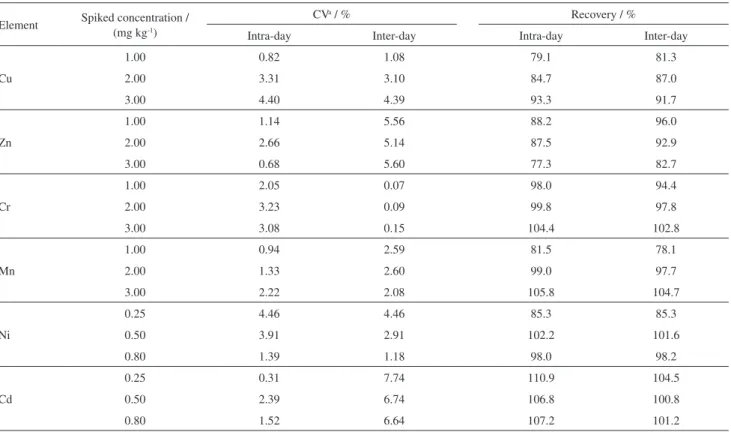
Precision, accuracy and applicability
From the results presented in Table 5, it can be observed that for all elements CV values ranged from 0.31 to 4.46% for intra-day precision and ranged from 0.07 to 7.74% for inter-day precision. The recommended precision as a function of analyte concentration in accordance with the Association of Official Analytical Chemists (AOAC)34 are 15, 11, 7.3 and
5.3% when the analyte concentrations are 0.1, 1, 10 and 100 mg kg-1, respectively. Therefore, all CV values found
were lower than those of guide recommendation, in both levels, intra and inter-day precision.
Recovery levels ranged from 77.3 to 110.9% in the intra-day evaluation and 78.1 to 104.7% in the inter-day evaluation. The acceptable range of recoveries when an analyte is present in concentrations of 0.1 to 10.0 is between 80 and 110%, as defined by the Association of Official Analytical Chemists (AOAC).34 Thus, the
recovery tests indicated good accuracy of the proposed analytical method.
Table 4. Equationsa for external calibration and standard addition curves obtained for Cu, Zn, Cr, Mn, Ni and Cd and t-test for matrix effect
Element Standard additiona
y = (A ± SD) + (B ± SD)x R
External calibrationa
y = (A ± SD) + (B ± SD)x R
t-test p < 0.05 Cu y = (0.181 ± 0.001) + (0.0876 ± 0.0003)x 0.9998 y = (0.0053 ± 0.0007) + (0.0970 ± 0.0009)x 0.9996 0.0007 Zn y = (0.121 ± 0.001) + (0.209 ± 0.001)x 0.9877 y = (0.0794 ± 0.0003) + (0.223 ± 0.001)x 0.9862 0.0003
Cr y = (0.0444 ± 0.0001) + (0.087 ± 0.001)x 0.9994 y = (0.0053 ± 0.0002) + (0.0875 ± 0.0002)x 0.9990 0.3932 Mn y = (0.00105 ± 0.00006) + (0.0209 ± 0.0005)x 0.9996 y = (0.0017 ± 0.0003) + (0.0235 ± 0.0001)x 0.9990 0.0103 Ni y = (0.000100 ± 0.000003) + (0.015 ± 0.002)x 0.9876 y = (0.00009 ± 0.00002) + (0.0153 ± 0.0006)x 0.9821 0.9922
Cd y = (0.0036 ± 0.0003) + (0.273 ± 0.006)x 0.9995 y = (0.0076 ± 0.0009) + (0.281 ± 0.002)x 0.9995 0.1706
ay: absorbance signal; B and A: slope and intercept of the calibration curve, respectively; x: metal concentration (mg L-1); SD: standard deviation of three
replicates; R: correlation coefficient.
After the model was generated and evaluated, the desirability conditions were selected to test the new model created. These conditions were: 43.0 mL of extractor solution, 14 min of stirring time and 2.0 g of the soil sample. The desirability condition suggests a predicted value of 109.46 mg kg-1 (sum of heavy metal concentrations). This
test was performed and the result was 108.44 mg kg-1.
The small variation was found when the experiment and predicted values were compared, showing that the newly developed method was efficient to extract Cu, Zn, Cr, Ni, Cd and Mn from soil samples.
Validation and application of the method
After obtaining the optimal conditions, the proposed method was evaluated in order to ensure that it efficiently performs the originally defined task. Thus, the validation of the method proposed by this (extraction of Cu, Zn, Cr, Ni, Cd and Mn of soil using the Mehlich-1 extractor) was performed by evaluating the following parameters: matrix adjustment, linearity, linear range, LOD and LOQ, precision and accuracy.
Matrix adjustment, linearity, linear range, LOD and LOQ
The proposed method was used to assess the availability of Cu, Zn, Cr, Mn, Ni and Cd in one soil sample where there is sediment deposition of industrial effluents, and the obtained results are shown in the Table 6.
In CONAMA35 (National Environmental Council,
Resolution No. 420 of 2009) Brazilian Agricultural Soil guidelines, the total concentration of Cu, Zn, Mn, Cr, Ni and Cd established for clean soil are 60, 300, –, 75, 30 and 1.3 mg kg-1, respectively. As shown in Table 6, the available
concentrations of Zn, Mn, Cr, Ni and Cd in the soil sample
obtained were lower than the than those proposed by that contamination guiding values. However, the concentration of Cu founded in the soil sample was high (59.26 mg kg-1),
since it was only the available amount and close to the total amount proposed by the CONAMA (60 mg kg-1).
Conclusions
The extraction method for evaluating the availability of Cu, Zn, Mn, Ni, Cr and Cd in soil with the use of the Mehlich-1 extractor proposed by this work was simple, fast and effective, as well as precise and accurate. Besides, it can be routinely employed for the evaluation of the availability amount of the micronutrients Cu, Zn, Cr, Ni, Cd and Mn from soil (characteristic of soil toxicity) and not only the macronutrients (P, Ca, Mg, K, Na and NH4), for which the
solution was originally proposed.
Acknowledgments
The authors are grateful to Laborfort Análises Químicas (Cambira, Paraná, Brazil) for the financial support and for the use of FAAS equipment; and to two anonymous referees for revising the manuscript.
Table 5. Intra-day and inter-day precision and recoveries for spiked soil
Element Spiked concentration / (mg kg-1)
CVa / % Recovery / %
Intra-day Inter-day Intra-day Inter-day
Cu
1.00 0.82 1.08 79.1 81.3
2.00 3.31 3.10 84.7 87.0
3.00 4.40 4.39 93.3 91.7
Zn
1.00 1.14 5.56 88.2 96.0
2.00 2.66 5.14 87.5 92.9
3.00 0.68 5.60 77.3 82.7
Cr
1.00 2.05 0.07 98.0 94.4
2.00 3.23 0.09 99.8 97.8
3.00 3.08 0.15 104.4 102.8
Mn
1.00 0.94 2.59 81.5 78.1
2.00 1.33 2.60 99.0 97.7
3.00 2.22 2.08 105.8 104.7
Ni
0.25 4.46 4.46 85.3 85.3
0.50 3.91 2.91 102.2 101.6
0.80 1.39 1.18 98.0 98.2
Cd
0.25 0.31 7.74 110.9 104.5
0.50 2.39 6.74 106.8 100.8
0.80 1.52 6.64 107.2 101.2
aCoefficient of variation.
Table 6. Available concentration of Cu, Zn, Mn, Cr, Ni and Cd in soil
Element Available concentration in soila / (mg kg-1)
Guiding valuesb for agricultural
soils for Brazil established by CONAMA35 / (mg kg-1)
Cu 59.26 ± 0.14 60
Zn 8.49 ± 0.18 300
Mn 13.98 ± 0.31 –
Cr 24.30 ± 0.68 75
Ni 2.47 ± 0.16 30
Cd 0.10 ± 0.00 1.3
References
1. Jiang, Y.; Chao, S.; Liu, J.; Yang, Y.; Chen, Y.; Zhang, A.; Cao, H.; Chemosphere 2017, 168, 1658.
2. Wuana, R. A.; Okieimen, F. E.; ISRN Ecol. 2011, 2011, 1. 3. Chen, H.; Teng, Y.; Lu, S.; Wang, Y.; Wu, J.; Wang, J.;
Chemosphere 2016, 144, 1002.
4. Mohamed, B. A.; Ellis, N.; Kim, C. S.; Bi, X.; Environ. Pollut.
2017, 230, 329.
5. Zhong, X. L.; Zhou, S. L.; Zhu, Q.; Zhao, Q. G.; J. Hazard. Mater. 2011, 198, 13.
6. Liu, X.; Song, Q.; Tang, Y.; Li, W.; Xu, J.; Wu, J.; Wang, F.; Brookes, P. C.; Sci. Total Environ. 2013, 463-464, 530. 7. Zhuang, P.; Mcbride, M. B.; Xia, H.; Li, N.; Li, Z.; Sci. Total
Environ. 2009, 407, 1551.
8. USEPA, Code of Federal Regulations: Priority Pollutants List, available at https://www.gpo.gov/fdsys/pkg/CFR-2014-title40-vol29/xml/CFR-2014-title40-vol29-part423-appA.xml, accessed on August 7, 2017.
9. Shrivastava, S. K.; Banerjee, D. K.; Water, Air, Soil Pollut. 2004,
152, 219.
10. Rafiq, M. T.; Aziz, R.; Yang, X.; Xiao, W.; Stoffella, P. J.; Saghir, A.; Azam, M.; Li, T.; PLoS One 2014, 9, 1.
11. Monterroso, C.; Rodríguez, F.; Chaves, R.; Diez, J.; Becerra-Castro, C.; Kidd, P. S.; Macías, F.; Appl. Geochem. 2014, 44, 3. 12. Alexander, M.; Environ. Sci. Technol. 2000, 34, 4259. 13. dos Santos, J. S.; dos Santos, M. L. P.; Conti, M. M.; dos Santos,
S. N.; de Oliveira, E.; Food Chem. 2009, 115, 1405.
14. Nascimento, S. S.; Silva, E. B.; Alleoni, L. R. F.; Grazziotti, P. H.; Fonseca, F. G.; Nardis, B. O.; J. Soil Sci. Plant Nutr. 2014,
14, 783.
15. Silva, E. B.; Fonseca, F. G.; Alleoni, L. R.; Nascimento, S. S.; Grazziotti, P. H.; Nardis, B. O.; Int. J. Phytorem. 2016, 18, 847. 16. Mehlich, A.; Determination of P, Ca, Mg, K, Na, NH4; available
athttp://www.ncagr.gov/AGRONOMI/pdffiles/mehlich53.pdf, accessed in January 2018.
17. Teixeira, S. T.; de Melo, W. J.; Silva, É. T.; Sci. Agric. 2005,
62, 498.
18. Silva, M. L. S.; Levy, C. C. B.; Vitti, G. C.; Ceres (Viçosa) 2012,
59, 406.
19. Alcantara, S.; Pérez, D. V.; Almeida, M. R. A.; Silva, G. M.; Polidoro, J. C.; Bettiol, W.; Water, Air, Soil Pollut. 2009, 203, 3. 20. dos Santos, J. S.; dos Santos, M. L. P.; Conti, M. M.; J. Braz.
Chem. Soc. 2010, 21, 1468.
21. Bezerra, M. A.; Santelli, R. E.; Oliveira, E. P.; Villar, L. S.; Escaleira, L. A.; Talanta 2008, 76, 965.
22. Kolachi, N. F.; Kazi, T. G.; Khan, S.; Wadhwa, S. K.; Baig, J. A.; Afridi, H. I.; Shah, A. Q.; Shah, F.; Food Chem. Toxicol.
2011, 49, 2548.
23. Chen, C.; Shao, Y.; Tao, Y.; Wen, H.; LWT - Food Sci. Technol.
2015, 64, 1263.
24. Trindade, A. S. N.; Dantas, A. F.; Lima, D. C.; Ferreira, S. L. C.; Teixeira, L. S. G.; Food Chem. 2015, 185, 145.
25. Ferreira, S. L. C.; Bruns, R. E.; Ferreira, H. S.; Matos, G. D.; David, J. M.; Brandão, G. C.; da Silva, E. G. P.; Portugal, L. A.; dos Reis, P. S.; Souza, A. S.; dos Santos, W. N. L.; Anal. Chim. Acta 2007, 597, 179.
26. Empresa Brasileira de Pesquisa Agropecuária (Embrapa);
Manual de Métodos de Análises Químicas para Avaliação da Fertilidade do Solo; da Silva, F. C.; da Eira, P. A.; Barreto, W. O.; Pérez, D. V.; Silva, C. A., eds.; EMBRAPA-CNPS: Rio de Janeiro, 1998.
27. Careri, M.; Elviri, L.; Mangia, A.; J. Chromatogr. A 2001, 935, 249.
28. Srigley, C. T.; Haile, E. A.; J. Food Compos. Anal. 2015, 40, 163.
29. Gong, Y.; Huang, J. A.; Shao, Y.; Liu, Z.; Pen, J.; Li, J.; Food Chem. 2012, 131, 309.
30. Feng, S.; Liu, S.; Luo, Z.; Tang, K.; Food Chem. 2015, 181, 9. 31. Statistica 5.0 Software, STATSOFT, Tulsa, OK, USA, 1995. 32. Design Expert Statistical Software, version 6.0, Stat-Ease, Inc.,
Minneapolis, MN, USA, 2008.
33. Instituto Nacional de Metrologia, Qualidade e Tecnologia (INMETRO); Orientação Sobre Validação de Métodos Analíticos; Doq-Cgcre-008, available at http://www.inmetro. gov.br/Sidoq/Arquivos/Cgcre/DOQ/DOQ-Cgcre-8_04.pdf, accessed on November 19, 2017.
34. Association of Official Analytical Chemists (AOAC); Agricultural Chemists Official Methods of Analysis; Guidelines for Standard Method Performance Requirements. Available at http://www.eoma.aoac.org/app_f.pdf, accessed on October 30, 2017.
35. CONAMA; Resolução No. 420, de 28 de dezembro de 2009;
Dispõe sobre Critérios e Valores Orientadores de Qualidade do Solo Quanto à Presença de Substâncias Químicas e Estabelece Diretrizes para o Gerenciamento Ambiental de Áreas Contaminadas por essas Substâncias em Decorrência de Atividades Antrópicas; Diário Oficial da União (DOU): Brasília, No. 249, de 30/12/2009, p. 81-84, available at http://www.mma. gov.br/port/conama/legiabre.cfm?codlegi=620, accessed on January 26, 2018.
Submitted: November 26, 2017 Published online: April 10, 2018