AR
TICLE
1 Departamento de Vigilância de Doenças e Agravos Não Transmissíveis e Promoção da Saúde, Secretaria de Vigilância em Saúde, Ministério da Saúde. Setor SAFS Quadra (Setor de Administração Federal Sul) Edifício Premium/Torre 1/Bloco F/Sala 16, Zona Cívico-Administrativa. 70070-600 Brasília DF Brasil. deborah.malta@ saude.gov.br 2 Unidade Técnica de Determinantes Sociais e Riscos para a Saúde, Doenças Crônicas Não Transmissíveis e Saúde Mental, Organização Pan-Americana da Saúde. 3 Núcleo de Pesquisas Epidemiológicas em Nutrição e Saúde, Faculdade de Saúde Pública, Universidade de São Paulo.
Differentials in risk factors for chronic non-communicable
diseases from the race/color standpoint
Abstract This article aims to analyze the dif-ferences between the prevalence of risk factors of non-communicable chronic disease by race/color. It is a cross-sectional study using data from a tele-phone survey of 45,448 adults. Prevalence ratios for chronic disease risk factors by race/color were calculated. After adjustments were made for edu-cation and income, race/color differences persist-ed. Among afro-descendant and mulatto women and mulatto men a higher prevalence ratio was identified of physical activity at work and physi-cal activity at home. Afro-descendant women and mulatto men indulged in less physical inactivity. Mulatto men and women showed a lower prev-alence of smoking and consumption of 20 ciga-rettes daily and lower consumption of fruit and vegetables. A higher consumption of full-fat milk with and beans was observed among afro-descen-dant and mulatto men. Afro-descenafro-descen-dant women had a lower prevalence of drinking and driving. Afro-descendant women and men ate more meat with fat and afro-descendant men suffered more from hypertension. Differences in risk factors by race/color can be explained by cultural aspects, by not fully adjustable socioeconomic differences that determine less access to goods and less opportuni-ties for the afro-descendant population.
Key words Afro-descendant, Mulatto, Race, Risk
factors, Inequalities
M
alta D
Introduction
Ethnic-racial inequalities are becoming a more relevant topic in national and international
sci-entific production1. Different health conditions
depending on skin color or race have been de-scribed as a public health problem and as an indicator of major social disparities in several countries. The variable “race” can be considered an important predictor of the health status of the population and also a marker for social
inequali-ties and social determinants of health2.
Despite advances in the income distribution, major social inequalities are still observed
inBra-zil3. Brazil has a very large black population,
com-prising approximately 82 million brown (mixed) and 15 million black individuals in a population of approximately 191 million people according to
the 2010 census4. Only recently have some authors
begun to investigate the social exclusion of the black population and their health conditions, em-phasizing the differences between groups
accord-ing to race/skin color/ethnicity5. The black
pop-ulation in Brazil has worse working conditions, lower wages, increased likelihood of poverty and more restrictions on the access to healthcare
ser-vices3,6,7. Low educational levels and illiteracy
af-fect the black population more than others. In ad-dition, access to higher education is lower among
blacks (8.3%) compared to whites (21.3%)3.
Although the studies on health and skin color
inequalities have increased1,8-12, the lack of equity
between races is still rarely explored in the liter-ature, whereas studies addressing differences
be-tween classes and regions are more common13-16.
The studies on racial inequalities and their con-sequences forhealth have been addressed through
the analysis of health information systems17,
mu-nicipalsurveys6,7,and national surveys10, among
others. The majority of these studies have indi-cated worse health indicators in the brown and
black populations9-11.
Some studies indicate high morbidity and mortality rates in the black population, espe-cially due to violence and homicides, and
high-er mortality among blacks18-21.In addition, more
cases of violence in public emergency services in
Brazil are observed among blacks22. Often, these
cases occur due to the poor socioeconomic status
and low educational level of the victims17,23,24. In
another line of research, the ethnic differences observed in the studies are often not explained by genetic inheritance. Therefore, socioeconom-ic, cultural and other factors must explain these
differences2,25.
A higher prevalence of self-reported chron-ic diseases is also observed in blacks compared
to whites26. Studies addressing the risk factors
for chronic non-communicable diseases are still rare. Since 2006, Brazil has had a national system that monitors the prevalence of risk or protective factors for chronic diseases through telephone in-terviews (Telephone-Based National Surveillance System of Risk and Protective Factors for Chronic
Diseases- Sistema Nacional de Vigilância de
Fa-tores de Risco ou Proteção para Doenças Crônicas por Inquérito Telefônico – Vigitel). This system monitors the prevalence of several other risk fac-tors for chronic diseases of the adult population in all 26 Brazilian state capitals and the Federal District. One question addressing the self-report-ed race/skin color of the interviewee was intro-duced in 2011, similar to the questionnaire used by the Brazilian Institute of Geography and
Sta-tistics (Instituto Brasileiro de Geografia e
Estatísti-ca - IBGE)4, enabling analyses of this issue.
This study aims to analyze the differences be-tween the prevalence of risk factors for chronic non-communicable diseases according to the race (white, black and brown) collected by the Vigitel system.
Methods
This cross-sectional study used data collected by Vigitel in 27 cities in 2012. This study presents estimates of the population that self-report-ed their race/skin color as white and the popu-lation that self-reported their race/skin color as black and brown. The sampling design used to select the sample is presented in detail in another
article27. Starting in 2012, the availability of the
micro data from the 2010 Population Census al-lowed for updating the estimates of the survey based on the intercensal projections, which con-sidered changes in the population composition, with a higher proportion of elderly and of the population with higher education levels.
aúd
e C
ole
tiv
a,
20(3):713-725,
2015
in the weight of the Vigitel sample: gender (male and female), age group (18-24, 25-34, 35-44, 45-54, 55-64 and 65 and older), educational level (no education or incomplete primary education, complete primary education or incomplete sec-ondary education, complete secsec-ondary educa-tion or incomplete higher educaeduca-tion and com-plete higher education), and skin color (white, black and brown). The details of the weighting adopted by the Vigitel are available in the Vigitel
Report 201228. The post-stratification weight of
each individual of the Vigitel sample was calcu-lated by this method using a specific routine of
the SAS software29.
The Vigitel questionnaire comprises approx-imately 94 questions divided into modules: (i) demographic and socioeconomic characteristics; (ii) eating and physical activity patterns; (iii) self-reported weight and height; (iv) tobacco and alcohol use; and (v) self-assessment of health sta-tus and self-reported morbidity. The following risk factors were analyzed in the present study:
tobacco use, overweight (body mass index ≥ 25
kg/m2) and obesity (body mass index ≥ 30 kg/
m2); consumption of high-fat meats (red meat
with visible fat or skin-on chicken); regular con-sumption of soft drinks or artificial juice (five or more days per week); physical inactivity (indi-viduals who did not practice any physical activ-ity during leisure time in the past three months, individuals who do not perform intense occupa-tional physical efforts, individuals who do not go to work or school by foot or by bike, and indi-viduals who are not responsible for heavy clean-ing intheir homes); watchclean-ing TV three or more hours per day (individuals who usually watch three or more hours of television daily); alcohol abuse (four or more doses of alcoholic beverages for women and five or more doses for men on a single occasion in the past 30 days, considering a dose of distilled spirit, a can of beer or a glass of wine as a dose of alcoholic beverage); driving a motor vehicle after consuming any amount of alcohol; health self-assessed as poor; and self-re-ported morbidity (previous medical diagnosis of hypertension and diabetes).
The protective factors were adherence to the recommended consumption of fruits and vegeta-bles (five or more servings per day, five or more days a week); regular consumption of beans (five or more days a week); recommended physical activity during leisure time [at least 150 minutes per week of mild- or moderate-intensity physical activity (walking, treadmill walking, weight train-ing, water aerobics, fitness, swimmtrain-ing, martial
arts and fighting, cycling, volleyball or others) or at least 75 minutes a week of vigorous-intensity physical activity (running, treadmill running, aer-obics, football, basketball or tennis) regardless of the number of days of physical activity per week]; occupational physical activity or household phys-ical activity; and performance of screening tests to detect cancer in women (mammography for women aged50-69 years and Pap smear for wom-en aged 25 to 59 years). These indicators were calculated using the total number of adults inter-viewed as the denominator, except those indica-tors specifically related to age and gender.
The prevalence and frequency of the indica-tors were estimated by gender and self-reported race/skin color (white, black or brown). Preva-lence ratios (PRs) of the indicators according to race/skin color (crude) and according to the race/ skin color adjusted by educational level were cal-culated using a Poisson Regression model. This study was approved by the National Commission
of Ethics in Human Research (Comissão Nacional
de Ética em Pesquisa em Seres Humanos - Conep).
Results
The 2012 Vigitel performed 45,448 complete interviews consisting of 17,389 men and 28,059 women. Regarding race/skin color, whites rep-resented 40.9% of the total sample, followed by browns with 38.0% and blacks with 8.5%. A total of 8.0% did not know or did not want to report their race/skin color, while 2.7% and 1.7% were yellow and indigenous, respectively.
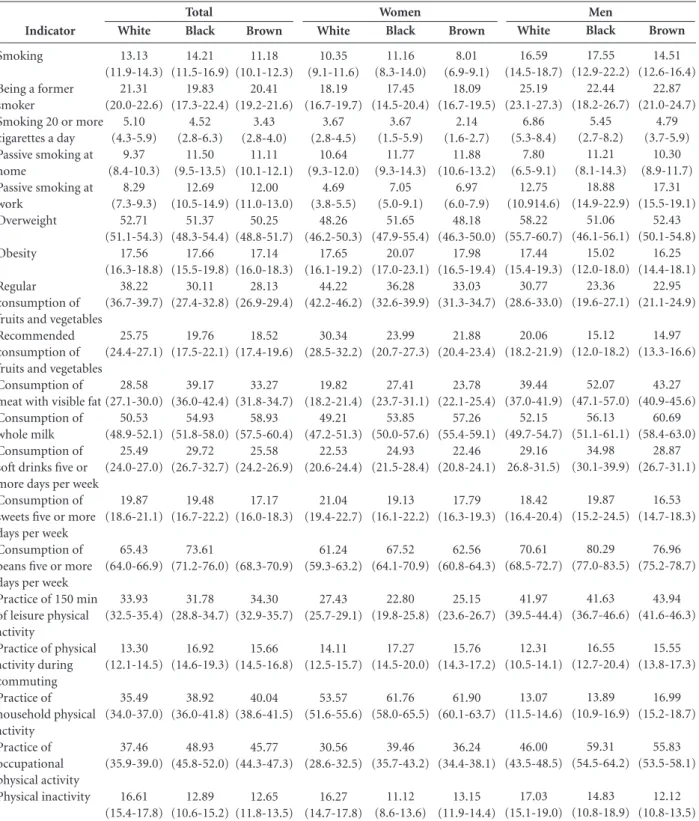
Table 1 shows the distribution of the prev-alence of the main indicators monitored by the Vigitel by skin color and stratified by gender in the 26 Brazilian capitals and Federal District. Regarding the distribution by gender, changes in the prevalence patterns were observed when skin color was considered for each gender, especially for the following indicators: smoking, smoking 20 or more cigarettes a day , passive smoking at home, consumption of meat with visible fat, practice of household physical activity, alcohol abuse, driving a vehicle after excessive consump-tion of alcoholic beverages and poor health con-dition. The variables age and educational level were associated with skin color. The brown and black populations had lower educational levels than the white one. Older people exhibited lower education.
ad-M
alta D
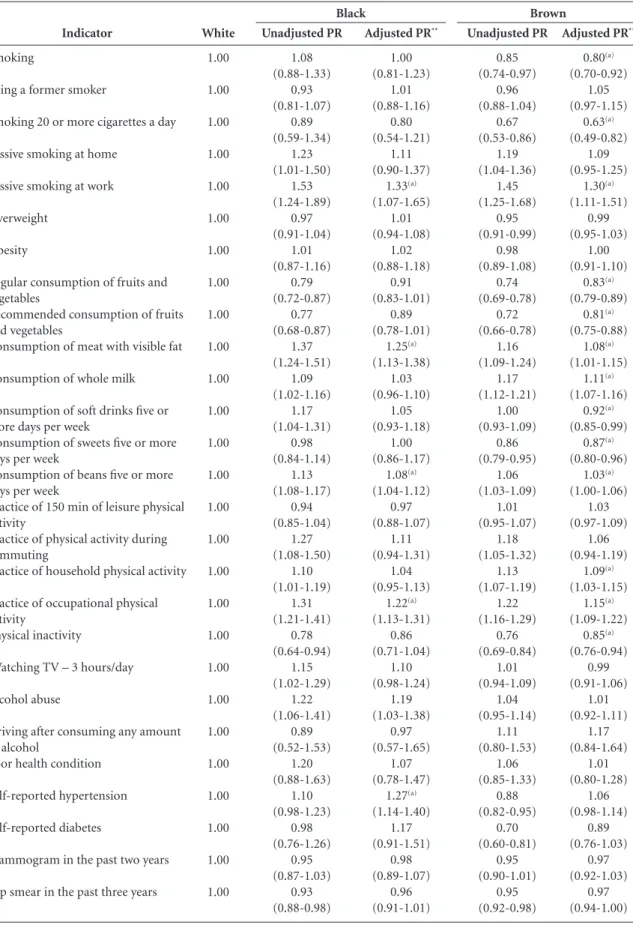
justed PRs of the indicators smoking, smoking 20 or more cigarettes a day, passive smoking at work, consumption of meat with visible fat,
con-sumption of whole milk and concon-sumption of soft drinks five or more days per week were lower than the respective unadjusted PRs. Regarding
Indicator
Smoking
Being a former smoker
Smoking 20 or more cigarettes a day Passive smoking at home
Passive smoking at work
Overweight
Obesity
Regular consumption of fruits and vegetables Recommended consumption of fruits and vegetables Consumption of meat with visible fat Consumption of whole milk Consumption of soft drinks five or more days per week Consumption of sweets five or more days per week Consumption of beans five or more days per week Practice of 150 min of leisure physical activity
Practice of physical activity during commuting Practice of household physical activity Practice of occupational physical activity Physical inactivity White 13.13 (11.9-14.3) 21.31 (20.0-22.6) 5.10 (4.3-5.9) 9.37 (8.4-10.3) 8.29 (7.3-9.3) 52.71 (51.1-54.3) 17.56 (16.3-18.8) 38.22 (36.7-39.7) 25.75 (24.4-27.1) 28.58 (27.1-30.0) 50.53 (48.9-52.1) 25.49 (24.0-27.0) 19.87 (18.6-21.1) 65.43 (64.0-66.9) 33.93 (32.5-35.4) 13.30 (12.1-14.5) 35.49 (34.0-37.0) 37.46 (35.9-39.0) 16.61 (15.4-17.8)
Table 1. Prevalence* of the main risk and protective factors for chronic non-communicable diseases according to skin color and gender in the 26 Brazilian capitals and the Federal District, 2012.
Brown 11.18 (10.1-12.3) 20.41 (19.2-21.6) 3.43 (2.8-4.0) 11.11 (10.1-12.1) 12.00 (11.0-13.0) 50.25 (48.8-51.7) 17.14 (16.0-18.3) 28.13 (26.9-29.4) 18.52 (17.4-19.6) 33.27 (31.8-34.7) 58.93 (57.5-60.4) 25.58 (24.2-26.9) 17.17 (16.0-18.3) (68.3-70.9) 34.30 (32.9-35.7) 15.66 (14.5-16.8) 40.04 (38.6-41.5) 45.77 (44.3-47.3) 12.65 (11.8-13.5) Black 14.21 (11.5-16.9) 19.83 (17.3-22.4) 4.52 (2.8-6.3) 11.50 (9.5-13.5) 12.69 (10.5-14.9) 51.37 (48.3-54.4) 17.66 (15.5-19.8) 30.11 (27.4-32.8) 19.76 (17.5-22.1) 39.17 (36.0-42.4) 54.93 (51.8-58.0) 29.72 (26.7-32.7) 19.48 (16.7-22.2) 73.61 (71.2-76.0) 31.78 (28.8-34.7) 16.92 (14.6-19.3) 38.92 (36.0-41.8) 48.93 (45.8-52.0) 12.89 (10.6-15.2) it continues White 10.35 (9.1-11.6) 18.19 (16.7-19.7) 3.67 (2.8-4.5) 10.64 (9.3-12.0) 4.69 (3.8-5.5) 48.26 (46.2-50.3) 17.65 (16.1-19.2) 44.22 (42.2-46.2) 30.34 (28.5-32.2) 19.82 (18.2-21.4) 49.21 (47.2-51.3) 22.53 (20.6-24.4) 21.04 (19.4-22.7) 61.24 (59.3-63.2) 27.43 (25.7-29.1) 14.11 (12.5-15.7) 53.57 (51.6-55.6) 30.56 (28.6-32.5) 16.27 (14.7-17.8) Brown 8.01 (6.9-9.1) 18.09 (16.7-19.5) 2.14 (1.6-2.7) 11.88 (10.6-13.2) 6.97 (6.0-7.9) 48.18 (46.3-50.0) 17.98 (16.5-19.4) 33.03 (31.3-34.7) 21.88 (20.4-23.4) 23.78 (22.1-25.4) 57.26 (55.4-59.1) 22.46 (20.8-24.1) 17.79 (16.3-19.3) 62.56 (60.8-64.3) 25.15 (23.6-26.7) 15.76 (14.3-17.2) 61.90 (60.1-63.7) 36.24 (34.4-38.1) 13.15 (11.9-14.4) Black 11.16 (8.3-14.0) 17.45 (14.5-20.4) 3.67 (1.5-5.9) 11.77 (9.3-14.3) 7.05 (5.0-9.1) 51.65 (47.9-55.4) 20.07 (17.0-23.1) 36.28 (32.6-39.9) 23.99 (20.7-27.3) 27.41 (23.7-31.1) 53.85 (50.0-57.6) 24.93 (21.5-28.4) 19.13 (16.1-22.2) 67.52 (64.1-70.9) 22.80 (19.8-25.8) 17.27 (14.5-20.0) 61.76 (58.0-65.5) 39.46 (35.7-43.2) 11.12 (8.6-13.6) White 16.59 (14.5-18.7) 25.19 (23.1-27.3) 6.86 (5.3-8.4) 7.80 (6.5-9.1) 12.75 (10.914.6) 58.22 (55.7-60.7) 17.44 (15.4-19.3) 30.77 (28.6-33.0) 20.06 (18.2-21.9) 39.44 (37.0-41.9) 52.15 (49.7-54.7) 29.16 26.8-31.5) 18.42 (16.4-20.4) 70.61 (68.5-72.7) 41.97 (39.5-44.4) 12.31 (10.5-14.1) 13.07 (11.5-14.6) 46.00 (43.5-48.5) 17.03 (15.1-19.0) Brown 14.51 (12.6-16.4) 22.87 (21.0-24.7) 4.79 (3.7-5.9) 10.30 (8.9-11.7) 17.31 (15.5-19.1) 52.43 (50.1-54.8) 16.25 (14.4-18.1) 22.95 (21.1-24.9) 14.97 (13.3-16.6) 43.27 (40.9-45.6) 60.69 (58.4-63.0) 28.87 (26.7-31.1) 16.53 (14.7-18.3) 76.96 (75.2-78.7) 43.94 (41.6-46.3) 15.55 (13.8-17.3) 16.99 (15.2-18.7) 55.83 (53.5-58.1) 12.12 (10.8-13.5) Black 17.55 (12.9-22.2) 22.44 (18.2-26.7) 5.45 (2.7-8.2) 11.21 (8.1-14.3) 18.88 (14.9-22.9) 51.06 (46.1-56.1) 15.02 (12.0-18.0) 23.36 (19.6-27.1) 15.12 (12.0-18.2) 52.07 (47.1-57.0) 56.13 (51.1-61.1) 34.98 (30.1-39.9) 19.87 (15.2-24.5) 80.29 (77.0-83.5) 41.63 (36.7-46.6) 16.55 (12.7-20.4) 13.89 (10.9-16.9) 59.31 (54.5-64.2) 14.83 (10.8-18.9)
aúd
e C
ole
tiv
a,
20(3):713-725,
2015
Indicator
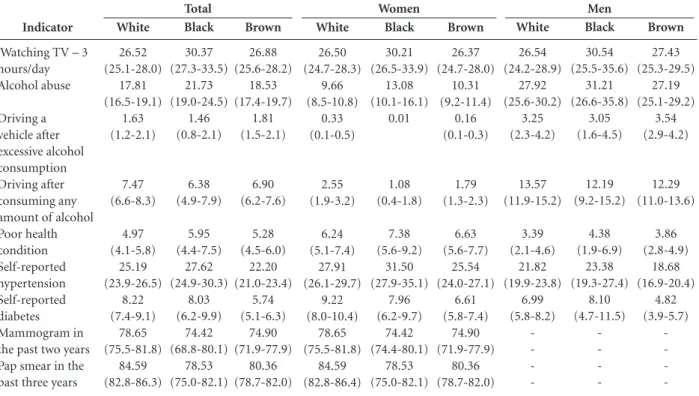
Watching TV – 3 hours/day Alcohol abuse
Driving a vehicle after excessive alcohol consumption Driving after consuming any amount of alcohol Poor health condition Self-reported hypertension Self-reported diabetes Mammogram in the past two years Pap smear in the past three years
White
26.52 (25.1-28.0)
17.81 (16.5-19.1)
1.63 (1.2-2.1)
7.47 (6.6-8.3)
4.97 (4.1-5.8)
25.19 (23.9-26.5)
8.22 (7.4-9.1)
78.65 (75.5-81.8)
84.59 (82.8-86.3)
Tabela 1. continuation
Brown
26.88 (25.6-28.2)
18.53 (17.4-19.7)
1.81 (1.5-2.1)
6.90 (6.2-7.6)
5.28 (4.5-6.0)
22.20 (21.0-23.4)
5.74 (5.1-6.3)
74.90 (71.9-77.9)
80.36 (78.7-82.0)
Black
30.37 (27.3-33.5)
21.73 (19.0-24.5)
1.46 (0.8-2.1)
6.38 (4.9-7.9)
5.95 (4.4-7.5)
27.62 (24.9-30.3)
8.03 (6.2-9.9)
74.42 (68.8-80.1)
78.53 (75.0-82.1)
* Weighted percentage to adjust the sociodemographic distribution of the Vigitel sample to the distribution of the adult population for 2010 according to gender, age, educational level and skin color by the rake method.
White
26.50 (24.7-28.3)
9.66 (8.5-10.8)
0.33 (0.1-0.5)
2.55 (1.9-3.2)
6.24 (5.1-7.4)
27.91 (26.1-29.7)
9.22 (8.0-10.4)
78.65 (75.5-81.8)
84.59 (82.8-86.4)
Brown
26.37 (24.7-28.0)
10.31 (9.2-11.4)
0.16 (0.1-0.3)
1.79 (1.3-2.3)
6.63 (5.6-7.7)
25.54 (24.0-27.1)
6.61 (5.8-7.4)
74.90 (71.9-77.9)
80.36 (78.7-82.0)
Black
30.21 (26.5-33.9)
13.08 (10.1-16.1)
0.01
1.08 (0.4-1.8)
7.38 (5.6-9.2)
31.50 (27.9-35.1)
7.96 (6.2-9.7)
74.42 (74.4-80.1)
78.53 (75.0-82.1)
White
26.54 (24.2-28.9)
27.92 (25.6-30.2)
3.25 (2.3-4.2)
13.57 (11.9-15.2)
3.39 (2.1-4.6)
21.82 (19.9-23.8)
6.99 (5.8-8.2)
-Brown
27.43 (25.3-29.5)
27.19 (25.1-29.2)
3.54 (2.9-4.2)
12.29 (11.0-13.6)
3.86 (2.8-4.9)
18.68 (16.9-20.4)
4.82 (3.9-5.7)
-Black
30.54 (25.5-35.6)
31.21 (26.6-35.8)
3.05 (1.6-4.5)
12.19 (9.2-15.2)
4.38 (1.9-6.9)
23.38 (19.3-27.4)
8.10 (4.7-11.5)
-Total Women Men
the indicators regular and recommended con-sumption of fruits and vegetables, the adjusted PR was greater than the unadjusted PR.
Table 3 shows the PRs unadjusted and ad-justed by educational level and income according to the skin color reported by the women. There were significant differences between the preva-lence rates in black or brown individuals and in the white ones. Among black and brown wom-en, significant adjusted PRs (95% confidence interval) were observed for passive smoking at work of 1.41 (1.00-1.99) and 1.40 (1.10-1.77), respectively. Regarding the practice of house-hold physical activity, the adjusted PRs were 1.09 (1.01-1.17) and 1.10 (1.05-1.15); for the practice of occupational physical activity, 1.23 (1.09-1.38) and 1.13 (1.04-1.23);and for physical inactivi-ty,0.76 (0.60-0.97) . Black women had a higher adjusted PR for the consumption of meat with visible fat, 1.26 (1.08-1.47), and a lower adjust-ed PR for driving a vehicle after excessive alco-hol consumption, 0.05 (0.01-0.26). Among the brown women, the adjusted PR for consumption of whole milk was 1.10 (1.04-1.16); for regular consumption of fruits and vegetables, 0.83
(0.77-0.89); for recommended consumption of fruits and vegetables,0.80 (0.73-0.88);for smoking, 0.74 (0.61-0.89); and for heavy smoking, 0.54 (0.38-0.77). The other indicators showed no differences between the white, black and brown women.
M
alta D
Indicator
Smoking
Being a former smoker
Smoking 20 or more cigarettes a day
Passive smoking at home
Passive smoking at work
Overweight
Obesity
Regular consumption of fruits and vegetables
Recommended consumption of fruits and vegetables
Consumption of meat with visible fat
Consumption of whole milk
Consumption of soft drinks five or more days per week
Consumption of sweets five or more days per week
Consumption of beans five or more days per week
Practice of 150 min of leisure physical activity
Practice of physical activity during commuting
Practice of household physical activity
Practice of occupational physical activity
Physical inactivity
Watching TV – 3 hours/day
Alcohol abuse
Driving after consuming any amount of alcohol
Poor health condition
Self-reported hypertension
Self-reported diabetes
Mammogram in the past two years
Pap smear in the past three years
White 1.00 1.00 1.00 1.00 1.00 1.00 1.00 1.00 1.00 1.00 1.00 1.00 1.00 1.00 1.00 1.00 1.00 1.00 1.00 1.00 1.00 1.00 1.00 1.00 1.00 1.00 1.00
Table 2. Confidence intervals (95%) for prevalence ratios* between the skin colors self-reported by men and women. Data from the 26 Brazilian capitals and Federal District, 2012.
* Weighted percentage to adjust the sociodemographic distribution of the Vigitel sample to the distribution of the adult population for 2010 according to gender, age, educational level and skin color by the rake method. ** Age- and educational level-adjusted PR. (a) Statistically significant value, considering the adjusted PR.
Unadjusted PR 1.08 (0.88-1.33) 0.93 (0.81-1.07) 0.89 (0.59-1.34) 1.23 (1.01-1.50) 1.53 (1.24-1.89) 0.97 (0.91-1.04) 1.01 (0.87-1.16) 0.79 (0.72-0.87) 0.77 (0.68-0.87) 1.37 (1.24-1.51) 1.09 (1.02-1.16) 1.17 (1.04-1.31) 0.98 (0.84-1.14) 1.13 (1.08-1.17) 0.94 (0.85-1.04) 1.27 (1.08-1.50) 1.10 (1.01-1.19) 1.31 (1.21-1.41) 0.78 (0.64-0.94) 1.15 (1.02-1.29) 1.22 (1.06-1.41) 0.89 (0.52-1.53) 1.20 (0.88-1.63) 1.10 (0.98-1.23) 0.98 (0.76-1.26) 0.95 (0.87-1.03) 0.93 (0.88-0.98)
Adjusted PR**
1.00 (0.81-1.23) 1.01 (0.88-1.16) 0.80 (0.54-1.21) 1.11 (0.90-1.37) 1.33(a) (1.07-1.65) 1.01 (0.94-1.08) 1.02 (0.88-1.18) 0.91 (0.83-1.01) 0.89 (0.78-1.01) 1.25(a) (1.13-1.38) 1.03 (0.96-1.10) 1.05 (0.93-1.18) 1.00 (0.86-1.17) 1.08(a) (1.04-1.12) 0.97 (0.88-1.07) 1.11 (0.94-1.31) 1.04 (0.95-1.13) 1.22(a) (1.13-1.31) 0.86 (0.71-1.04) 1.10 (0.98-1.24) 1.19 (1.03-1.38) 0.97 (0.57-1.65) 1.07 (0.78-1.47) 1.27(a) (1.14-1.40) 1.17 (0.91-1.51) 0.98 (0.89-1.07) 0.96 (0.91-1.01) Black
Adjusted PR**
aúd e C ole tiv a, 20(3):713-725, 2015 Indicator Smoking
Being a former smoker
Smoking 20 or more cigarettes a day
Passive smoking at home
Passive smoking at work
Overweight
Obesity
Regular consumption of fruits and vegetables
Recommended consumption of fruits and vegetables
Consumption of meat with visible fat
Consumption of whole milk
Consumption of soft drinks five or more days per week
Consumption of sweets five or more days per week
Consumption of beans five or more days per week
Practice of 150 min of leisure physical activity
Practice of physical activity during commuting
Practice of household physical activity
Practice of occupational physical activity
Physical inactivity
Watching TV – 3 hours/day
Alcohol abuse
Driving a vehicle after excessive alcohol consumption
Driving after consuming any amount of alcohol
Poor health condition
Self-reported hypertension
Self-reported diabetes
Mammogram in the past two years
Pap smear in the past three years
White 1.00 1.00 1.00 1.00 1.00 1.00 1.00 1.00 1.00 1.00 1.00 1.00 1.00 1.00 1.00 1.00 1.00 1.00 1.00 1.00 1.00 1.00 1.00 1.00 1.00 1.00 1.00 1.00
Table 3. Prevalence ratios* of the main risk and protective factors for chronic non-communicable diseases among women in the 26 Brazilian capitals and Federal District, 2012.
* Weighted percentage to adjust the sociodemographic distribution of the Vigitel sample to the distribution of the adult population for 2010 according to gender, age, educational level and skin color by the rake method. ** Age- and educational level- adjusted PR. (a) Statistically significant value, considering the adjusted PR.
Adjusted PR**
1.02 (0.77-1.35) 1.01 (0.84-1.23) 0.92 (0.49-1.71) 1.01 (0.78-1.31) 1.41 (1.00-1.99) 1.10 (1.01-1.20) 1.16 (0.97-1.38) 0.92 (0.82-1.03) 0.88 (0.76-1.03) 1.26(a) (1.08-1.47) 1.03 (0.95-1.12) 1.01 (0.86-1.19) 0.93 (0.78-1.11) 1.06 (1.00-1.13) 0.89 (0.77-1.04) 1.10 (0.89-1.34) 1.09(a) (1.01-1.17) 1.23(a) (1.09-1.38) 0.76(a) (0.60-0.97) 1.13 (0.97-1.30) 1.33 (1.04-1.72) 0.05(a) (0.01-0.26) 0.55 (0.27-1.10) 1.11 (0.81-1.52) 1.27 (1.13-1.43) 0.99 (0.76-1.28) 0.98 (0.89-1.07) 0.96 (0.91-1.01) Black
Adjusted PR**
M
alta D
Indicator
Smoking
Being a former smoker
Smoking 20 or more cigarettes a day
Passive smoking at home
Passive smoking at work
Overweight
Obesity
Regular consumption of fruits and vegetables
Recommended consumption of fruits and vegetables
Consumption of meat with visible fat
Consumption of whole milk
Consumption of soft drinks five or more days per week
Consumption of sweets five or more days per week
Consumption of beans five or more days per week
Practice of 150 min of leisure physical activity
Practice of physical activity during commuting
Practice of household physical activity
Practice of occupational physical activity
Physical inactivity
Watching TV – 3hours/day
Alcohol abuse
Driving a vehicle after excessive alcohol consumption
Driving after consuming any amount of alcohol
Poor health condition
Self-reported hypertension Self-reported diabetes White 1.00 1.00 1.00 1.00 1.00 1.00 1.00 1.00 1.00 1.00 1.00 1.00 1.00 1.00 1.00 1.00 1.00 1.00 1.00 1.00 1.00 1.00 1.00 1.00 1.00 1.00
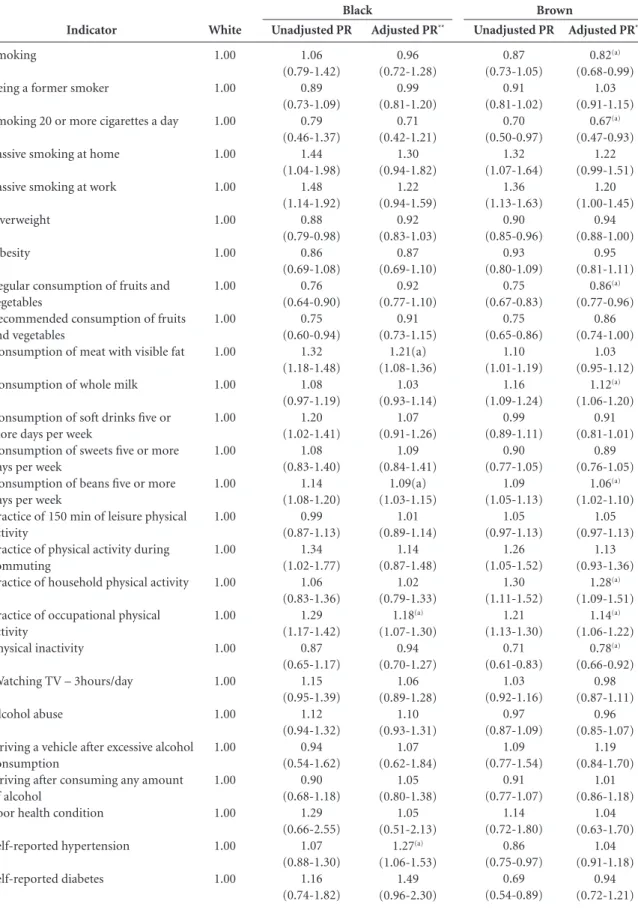
Table 4. Prevalence ratios* of the main risk and protective factors for chronic non-communicable diseases among men in the 26 Brazilian capitals and Federal District, 2012.
* Weighted percentage to adjust the sociodemographic distribution of the Vigitel sample to the distribution of the adult population for 2010 according to gender, age, educational level and skin color by the rake method. **Age- and educational level-adjusted PR. (a) Statistically significant value, considering the adjusted PR.
Adjusted PR**
0.96 (0.72-1.28) 0.99 (0.81-1.20) 0.71 (0.42-1.21) 1.30 (0.94-1.82) 1.22 (0.94-1.59) 0.92 (0.83-1.03) 0.87 (0.69-1.10) 0.92 (0.77-1.10) 0.91 (0.73-1.15) 1.21(a) (1.08-1.36) 1.03 (0.93-1.14) 1.07 (0.91-1.26) 1.09 (0.84-1.41) 1.09(a) (1.03-1.15) 1.01 (0.89-1.14) 1.14 (0.87-1.48) 1.02 (0.79-1.33) 1.18(a) (1.07-1.30) 0.94 (0.70-1.27) 1.06 (0.89-1.28) 1.10 (0.93-1.31) 1.07 (0.62-1.84) 1.05 (0.80-1.38) 1.05 (0.51-2.13) 1.27(a) (1.06-1.53) 1.49 (0.96-2.30) Unadjusted PR 1.06 (0.79-1.42) 0.89 (0.73-1.09) 0.79 (0.46-1.37) 1.44 (1.04-1.98) 1.48 (1.14-1.92) 0.88 (0.79-0.98) 0.86 (0.69-1.08) 0.76 (0.64-0.90) 0.75 (0.60-0.94) 1.32 (1.18-1.48) 1.08 (0.97-1.19) 1.20 (1.02-1.41) 1.08 (0.83-1.40) 1.14 (1.08-1.20) 0.99 (0.87-1.13) 1.34 (1.02-1.77) 1.06 (0.83-1.36) 1.29 (1.17-1.42) 0.87 (0.65-1.17) 1.15 (0.95-1.39) 1.12 (0.94-1.32) 0.94 (0.54-1.62) 0.90 (0.68-1.18) 1.29 (0.66-2.55) 1.07 (0.88-1.30) 1.16 (0.74-1.82) Black
Adjusted PR**
aúd
e C
ole
tiv
a,
20(3):713-725,
2015
Discussion
This is the first Vigitel study that analyzes differ-ences in the risk and protective factors for chron-ic non-communchron-icable diseases according to race or color. This study demonstrated that the risk and protective factors for chronic non-commu-nicable diseases are different between blacks, browns and whites. After adjusting for socioeco-nomic and demographic factors, such as educa-tional level and age, the differences between race/ color were reduced, but factors such as a lower prevalence of smoking, poor dietary habits, more occupational physical activity, and higher fre-quency of hypertension persisted among blacks and browns.
The literature describes the importance of methodological adjustments in the analysis of racial inequalities because racial issues are often associated with aspects such as access to infor-mation, occupation, goods, services and health as well as the perception of racism suffered by people. Thus, the explanation of such inequali-ties is still a complex one, and they should not be explained from a biological point of view but rather as a social variable dependent on the his-torical and cultural context. This social variable is an important determinant of inequality in health
among the racial groups24 . Some authors also
indicate that the worse health indicators among the black population may be partly explained by the socioeconomic status, while others consider that racial prejudice could explain these
differ-ences2,24,30.
All these factors may act synergistically, which can negatively intensify the health
indica-tors and increase the inequalities31,32.
According-ly, adjusting for socioeconomic variables reduces the excess risk due to social inequalities, although this does not completely eliminate the
differenc-es30. Thus, even with the adjustments, the racial/
ethnic inequalities persist, further showing their complexity. The differences in health behaviors observed in the present study, even after adjust-ing for socioeconomics variables, may still be attributable to factors that were not properly ad-justed and may partially explain them.
Smoking is an important risk factor for
chronic diseases33, and higher prevalence has
been reported in populations with lower
educa-tional level34-36. In contrast, the BRFSS study that
addressed the risk factors in adults in the US and analyzed differences between ethnic groups ob-served that black and Hispanic men were signifi-cantly less likely to smoke than white men and
white women in almost all age groups37.
Differ-ences in smoking habit were large and fairly con-sistent across the age groups, and the majority remained significant after adjustment for educa-tional level and income. In general, the adjust-ment for educational level and income increased the racial/ethnic differences in smoking habit. After the adjustment, the black and Hispanic women exhibited approximately from one-quar-ter to half the odds of smoking compared to
white women37.Similar results were observed in
the present study, which identified a lower PR among brown men and brown women, as well as a lower frequency of heavy smoking. Explana-tions for these differences need to be further ex-plored, and cultural differences between groups should be considered.
There were no differences between races re-garding the consumption of alcohol, unlike the BRFSS survey, which showed that younger black individuals (both women and men) were signifi-cantly less likely to consume alcohol compared to the same population group with similar age, after
adjusting for educational level and income37 .
The consumption of fruits and vegetables is considered a marker of healthy diet and a pro-tective factor for chronic non-communicable
diseases33. The present study demonstrated a
lower regular consumption of fruits and vege-tables among the brown and black populations (both women and men).Other differences in eat-ing pattern were the higher consumption of fat-ty red meat and beans among black women and the higher consumption of whole milk among brown women. The black and brown men con-sumed more beans, and brown men concon-sumed more whole milk. Some of these differences can be explained by cultural traditions because the
consumption of beans and feijoada were
popu-larized by the black population when Brazil was a colony of Portugal. Thus, beans, a staple food in Brazil, are essential for both “rice and beans” and
for the national dish feijoada38.
American studies using the same methods used in the present study show that black wom-en are significantly more likely to be physically inactive during leisure than white women after adjusting for educational level and income, while black men and white men are equally likely to be
physically inactive37. In the present study, black
M
alta D
with high educational level and income39,40, while
the other domains of physical activity (occupa-tional, household and commuting) are more practiced by workers who have lower educational
and income40. Even after adjusting for age and
educational level, black ethnicity remained as-sociated with the practice of household physical activity, perhaps due to associated and unadjust-ed socioeconomic factors. The fact that blacks are more active in these domains ultimately reduces their sedentariness because this indicator
com-prises all possible domains of physical activity39,41.
The analysis of overweight and obesity re-vealed no differences between the races, but fur-ther studies are required. American studies have observed different patterns, where blacks and
white men were equally likely to be obese37,42.
A higher prevalence of overweight and obesity among the black and Mexican populations living in the United States was also observed in other
studies43,44.
Studies on hypertension and race/color dif-ferences have been described in national and in-ternational studies for decades, indicating high
blood pressure rates among blacks32,45-53. There is
no consensus regarding the causes of increased blood pressure in the black population. Two main explanations have been proposed. One is a genetic predisposition in the black population, and another is related to a greater hardship due to their darker skin, which could cause a more stressful experience among blacks, worse access to health care services, fewer health-promoting practices, and lower access to health care goods and services as a result of lower socioeconomic
status, which would trigger high blood pressure54.
However, there is no consensus in the literature on this difference according to race/color or on the factors that can explain these differences. Ac-cording to Lessa, “the magnitude of hypertension varies widely depending on the biological-de-mographic characteristics of populations, their predominant lifestyle, physical and psychosocial environment and also the characteristics of the health care services’ organization and the
inter-actions between these factors”55.
The BRFSS studies also indicate that diabetes is nearly twice as prevalent among African Amer-icans compared to the white population in the
United States (16.8% and 8.8%, respectively)37.
However, these differences on hypertension and diabetes according to race/color were not found in the present study.
Although quality of and access to health
care services differ with race37, the current study
showed no differences in the performance of pre-ventive tests in women (mammography in the past two years and Pap smear in the past three years) according to race/color when adjusted for educational level. The self-assessment of health status was also not significantly different accord-ing to race/color after adjustaccord-ing for educational level and income, using data from the National
Household Sample Survey56. The present study
also found no differences.
The difficulty in measuring the race/color and their possible adjustments are among the limitations of this study. The differences identi-fied here are complex, and not all explanations can be considered definitive. According to some authors, concluding that effects are “indepen-dent” from race or ethnicity should be done with caution, mainly due to evidence that these
dif-ferences do not have a genetic basis2. They also
highlight discrimination on health as the main
explanatory mechanism of such differences2. In
addition, there are limitations in the socioeco-nomic measures used to adjust for the differenc-es. Limitations in socioeconomic measures might occur when adjusting for educational level be-cause, for example, there is no information about the quality of education. Therefore, there may be residual confounding bias due to unadjusted socioeconomic differences. In other words, the difference identified according to race/ethnicity in our models partly represents the unmeasured socioeconomic factors.
In addition, this study was performed with data obtained from the Vigitel, which interviews adults living in the Brazilian capitals who have a landline telephone. Post-stratification weights of the data were used to reduce possible non-rep-resentation bias. In addition, previous validation
studies from Vigitel57 and comparative studies
with household surveys are considered
appropri-ate58, showing that Vigitel is a useful tool in
mon-itoring risk factors for chronic diseases.
Conclusion
aúd
e C
ole
tiv
a,
20(3):713-725,
2015
effects of socioeconomic inequalities. According-ly, some variables remained different among the races/colors, such as increased blood pressure in black men, which has been classically reported as a variable associated with the black population. In addition some risk factors, such as a lower consumption of fruits and vegetables, higher consumption of fatty red meat and higher fre-quency of occupational physical activity, are as-sociated with less skilled, manual jobs and are not always considered beneficial to health. This study identified as protective factors a lower prevalence of smoking, a higher consumption of beans, and less inactivity. These differences can be explained by both cultural aspects and differences in access and opportunities.
Affirmative public policies aiming to move toward equity have been proposed by the
Min-istry of Health. These include “The Health of the Black Population and the SUS”, which considers the specific health needs of the black population and the inequalities that affect this population regarding their access to health care services. The approach used in this study is consistent with that document and aims to advance the discus-sion and academic research on the subject, with the ultimate goal of supporting public policies that promote equity.
Further studies are required because the gen-erated information provides relevant data for de-veloping preventive and interventional measures targeting the reduction of major risk factors for chronic non-communicable diseases specific to the black population. These findings can support policies that reduce social inequalities and meet the real needs of this segment of the population.
Collaborators
M
alta D
Soares Filho AM. Homicide victimization according to racial characteristics in Brazil. Rev Saude Publica 2011; 45(4):745-755.
Araújo MM, Malloy-Diniz LF, Rocha FL. Impulsividade e acidentes de trânsito. Rev Psiq Clín 2009; 36(2):60-68. Costa IER, Ludermir AB, Silva IA. Diferenciais da mor-talidade por violência contra adolescentes segundo es-trato de condição de vida e raça/cor na cidade do Reci-fe. Cien Saude Colet 2009; 14(5):1781-1788.
Barros FC, Victora CG, Horta BL. Ethnicity and infant health in Southern Brazil. A birth cohort study. Int J Epidemiol 2001; 30(5):1001-1008.
Morse ML, Fonseca SC, Barbosa MD, Calil MB, Eyer FPC. Mortalidade materna no Brasil: o que mostra a produção científica nos últimos 30 anos? Cad Saude Publica 2011; 27(4):623-638.
Mascarenhas MDM, Silva MMA, Malta DC, Moura L, Macário EM, Gawryszewski VP, Neto OLM. Perfil epi-demiológico dos atendimentos de emergência por vio-lência no Sistema de Serviços Sentinelas de Vigilância de Violências e Acidentes (Viva) – Brasil, 2006. Epide-miol Serv Saúde 2009; 18(1):17-28.
Peres MA, Peres KG, Barros AJD, Victora CG. The re-lationship between family socioeconomic trajectories from childhood to adolescence and dental caries and associated oral behaviours. J Epidemiol Community He-alth 2007; 61(2):141-145.
Araújo EM, Costa MCN, Hogan VK, Araújo TM, Dias AB, Oliveira LOA. A utilização da variável raça/cor em Saúde Pública: possibilidades e limites. Interface (Botu-catu) 2009; 13(31):383-394.
Pearce NP, Foliaki S, Sporle A, Cunningham C. Genetics, race, ethnicity, and health. BMJ 2004; 328(7447):1070-1072.
Barros MBA, Cesar CLG, Carandina L, Torre GD. Desigualdades sociais na prevalência de doenças crô-nicas no Brasil, PNAD-2003. Cien Saude Colet 2006; 11(4):911-926.
Moura EC, Morais Neto OL, Malta DC, Moura L, Sil-va NN, Bernal R, Claro RM, Monteiro CA. Vigilância de fatores de risco para doenças crônicas por inqué-rito telefônico nas capitais dos 26 estados brasileiros e no Distrito Federal (2006). Rev Bras Epidemiol 2008; 11(Supl. 1):20-37.
Brasil. Ministério da Saúde (MS). Vigitel Brasil 2012. Vi-gilância de fatores de risco e proteção para doenças crôni-cas por inquérito telefônico: estimativas sobre freqüência e distribuição sócio-demográfica de fatores de risco e prote-ção para doenças crônicas nas capitais dos 26 estados bra-sileiros e no Distrito Federal em 2012. Brasília: MS; 2013. Izrael D, Hoaglin DC, Battaglia MP. To rake or not to rake is not the question anymore with the enhanced raking macro. pp. 207-229. 2004. 29th Annual SAS Users Group International Conference. [acessado 2010 dez 12]. Disponível em: http://www2.sas.com/procee-dings/sugi29/207-29.pdf
Krieger N, Rowley D, Herman A, Avery B, Phillips MT. Racism, sexism and social class: implications for stu-dies of health, disease and well-being. Am J Prev Med 1993; 9(Supl. 2):82-122.
17.
18. 19.
20.
21.
22.
23.
24.
25.
26.
27.
28.
29.
30. References
Chor D, Araujo Lima CR. Aspectos epidemiológicos das desigualdades raciais em saúde no Brasil Epidemio-logic aspects of racial inequalities in health in Brazil. Cad Saude Publica 2005; 21(5):1586-1594.
Krieger N, Chen JT, Waterman PD, Rehkopf DH, Su-bramanian SV. Race/ethnicity, gender, and monitoring socioeconomic gradients in health: a comparison of area-based socioeconomic measures-the public health disparities geocoding project. Am J Public Health 2003; 93(10):1655-1671.
Instituto de Pesquisa Econômica Aplicada (IPEA), ONU Mulheres, Secretaria de Políticas para as Mu-lheres (SPM), Secretaria de Políticas de Promoção da Igualdade Racial (Seppir). Retrato das desigualdades de gênero e raça. 4ª ed. Brasília: Ipea; 2011.
Instituto Brasileiro de Geografia e Estatística (IBGE). Pesquisa Nacional por Amostra de Domicílios. Síntese dos Indicadores de 2009. Rio de Janeiro: IBGE; 2010. [acessado 2011 jan 4]. Disponível em: http://www.ibge. gov.br/home/estatistica/populacao/trabalhoerendi-mento/pnad2009/pnad_sintese_2009.pdf
Araújo EM, Nascimento Costa MC, Vilar Noronha C, Hogan VK, Vines AI, Araújo TM. Desigualdades em saúde e raça/cor da pele: revisão da literatura do Bra-sil e dos Estados Unidos (1996-2005). Saúde Coletiva 2010; 7(40):116-121.
Macinko J, Dourado I, Guanais FC. Doenças Crônicas, atenção primária e desempenho dos sistemas de saúde: Diagnósticos, instrumentos e intervenções. New York: In-ter-American Development Bank; 2011.
Leal MDC, Gama SGND, Cunha CBD. Desigualdades raciais, sociodemográficas e na assistência ao pré-natal e ao parto, 1999-2001. BEPA 2007; 4(Supl. 1):36-45. Macinko J, Lima-Costa MF. Horizontal equity in health care utilization in Brazil, 1998-2008. Int J Equity Health 2012; 11:33.
Leal MC, Gama SGN, Cunha CB. Desigualdades raciais, sociodemográficas e na assistência ao prénatal e ao par-to, 1999-2001. Rev Saude Publica 2005; 39(1):100-107. Travassos CMR. Acesso e utilização de serviços de saúde, primeiros resultados do Suplemento Saúde da PNAD 2003. Pesquisa Nacional por Amostra de Domi-cílio. Fiocruz. 2005 maio; [citado 2009 out 16]. Dispo-nível em: http://www.fiocruz.br/cict/media/pnad.pdf Peres MA, Peres KG, Antunes JLF, Junqueira SR, Frazão P, Narvai PC .The association between socioeconomic development at the town level and the distribution of dental caries in Brazilian children. Rev Panam Salud Pública 2003; 14(3):149-157.
Cunha EMGP. Mortalidade infantil e raça: as diferenças da desigualdade. J Rede Saúde 2001; 23:48-50. Vianna SM, Nunes A, Barata RB, Santos JRS. Medindo as desigualdades em saúde no Brasil: uma proposta de monitoramento. Brasília: Organização Pan-Americana da Saúde, Ipea; 2001.
Szwarcwald CL, Bastos FI, Castilho EA. The dynamics of the AIDS epidemic in Brazil: A space-time analy-sis in the period 1987- 1995. Braz J Infect Dis 1998; 2(4):175-186.
Souza JJ, Souza MT, Fernandes RA, Guercia RF, Adoni T. Desigualdade de indicadores de mortalidade no Su-deste do Brasil. Rev Saude Publica 1999; 33(6):593-601. Minayo MCS, Souza ER. Violência para todos. Cad Saude Publica 1993; 9(1):65-78.
1.
2.
3.
4.
5.
6.
7.
8.
9.
10.
11.
12. 13.
14.
15.
aúd
e C
ole
tiv
a,
20(3):713-725,
2015
Yusuf S, Reddy S, Ôunpuu S, Anand S. Global burden of cardiovascular diseases. Part II: Variations in car-diovascular disease by specific ethnic groups and ge-ographic regions and prevention strategies. Circulation 2001; 104(23):2855-2864.
Hahn RA, Heath GW, Chang MH. Cardiovascular dise-ase risk factors and preventive practices among adults - United States, 1994: a behavioral risk factor atlas. Beha-vioral Risk Factor Surveillance System State Coordina-tors. MMWR CDC Surveill Summ. 1998; 47(5):35-69. Duncan BB, Schmidt MI, Polanczkyk CA, Homirich CS, Rosa RS, Achutti AC. Fatores de risco para doen-ças não transmissíveis em área metropolitana do sul do Brasil. Prevalência e simultaneidade. Rev Saude Publica 1993; 27(1):43-48.
Schieri R, Oliveira MC, Pereira RA. High prevalence of hypertension among black and mulatto women in a Brazilian survey. Ethn Dis. 2001; 11(3):412-418. Lessa I. Hipertensão arterial. In: Brasil, Ministério da Saúde (MS), Secretaria de Políticas de Saúde. Manual de doenças mais importantes, por razões étnicas, na po-pulação brasileira afro-descendente. Brasília: MS; 2001. p. 43-53.
Mosley JD, Appel LJ, Ashour Z, Coresh J, Whelton PK, Ibrahim MM. Relationship between skin color and blood pressure in Egyptian Adults: results from the National Hypertension Project. Hypertension 2000; 36(2):296-302.
Gravlee CC, Dressler WW, Bernard HR. Skin color, so-cial classification, and blood pressure in southeastern Puerto Rico. Am J Public Health 2005; 95(12):2191-2197.
Klonoff EA, Landrine H. Is skin color a marker for ra-cial discrimination? Explaining the skin color-hyper-tension relationship. J Behav Med 2000; 23(4):329-338. Lessa I. O adulto brasileiro e as doenças da modernida-de:epidemiologia das doenças crônicas nãotransmissíveis. São Paulo: Editora Hucitec; 1998.
Dachs J, Norberto W. Determinantes das desigualdades na auto-avaliação do estado de saúde no Brasil: análi-se dos dados da PNAD/1998. Cien Saude Colet 2002; 7(4):641-657.
Ferreira AD, César CC, Malta DC, Andrade ACS, Ramos CGC, Proietti FA, Bernal RTI, Caiaffa WT. Validade de estimativas obtidas por inquérito telefônico: compara-ção entre Vigitel 2008 e inquérito Saúde em Beagá. Rev. bras. epidemiol. 2011; 14(Supl. 1):16-30.
Mendes LL, Campos SF, Malta DC, Bernal RTI, Bandei-ra de Sá NN, Velásquez-Meléndez G. Validade e repro-dutibilidade de marcadores do consumo de alimentos e bebidas de um inquérito telefônico realizado na ci-dade de Belo Horizonte (MG), Brasil. Rev. bras. epide-miol. 2011; 14(Supl. 1):80-89.
Article submitted on 10/14/2014 Approved on 11/11/2014
Final version submitted on 11/13/2014 Cooper R, Rotimi C, Ataman S, McGee D, Osotimehin
B, Kadiri S, Muna W, Kingue S, Fraser H, Forrester T, Bennett F, Wilks R. The prevalence of hypertension in seven populations of west African origin. Am J Public Health 1997; 87(2):160-168.
Frisancho AR, Farrow S, Friedenzohn I, Johnson T, Kapp B, Miranda C, Perez M, Rauchle I, Sanchez N, Wheatcroft G, Woodill L, Ayllon I, Bellido D, Rodriguez A, Machicao J, Villena M, Vargas E. Role of genetic and environmental factors in the increased blood pressures of Bolivian blacks. Am J Hum Biol 1999; 11(4):489-498. World Health Organization (WHO). Global status re-port on noncommunicable diseases 2010. Geneva: WHO; 2011.
Facina T. Pesquisa Especial de Tabagismo (PETab) – Relatório Brasil. Rev Brasileira de Cancerologia 2011; 57(3):429-430.
Monteiro CA, Cavalcante TM, Moura EC, Claro RM, Szwarcwald CL. Population-based evidence of a strong decline in the prevalence of smokers in Brazil (1989-2003). Bull World Health Organ 2007; 85(7):527-534. Malta DC, Moura EC, Silva AS, Oliveira PPV, Costa e Silva VJL. Prevalência do tabagismo em adultos resi-dentes nas capitais dos estados e no Distrito Federal, Brasil 2008. J Bras Pneumol 2010; 36(1):75-85. Centers for Disease Control and Prevention (CDC). Behavioral Risk Factor Surveillance System – BRFSS. About the BRFSS, 2008. [acessado 2013 fev 20]. Dispo-nível em http://www.cdc.gov/brfss/about/htm. Maciel ME. Uma cozinha à brasileira. Estudos Históri-cos 2004; 33:25-39.
Hallal PC, Knuth AG, Reis RS, Rombaldi AJ, Malta DC, Iser BPM, Bernal RTI, Florindo AA. Tendências tempo-rais de atividade física no Brasil (2006-2009). Rev. bras. epidemiol. 2011; 14(Supl. 1):53-60.
Knuth AG, Malta DC, Dumith SC, Pereira CA, Morais Neto OL, Temporão JG, Penna G, Hallal PC. Prática de atividade física em brasileiros: resultados da Pesquisa Nacional por Amostra de Domicílios (PNAD) – 2008. Cien Saude Colet 2011; 16(9):3697-3705.
Malta DC, Moura EC, Castro AM, Cruz DKA, Neto OLM, Monteiro CA. Padrão de atividade física em adultos brasileiros: resultados de um inquérito por en-trevistas telefônicas, 2006. Epidemiol Serv Saúde 2009; 18(1):7-16.
Mokdad AH, Ford ES, Bowman BA, Dietz WH, Vinicor F, Bales VS, Marks JS. Prevalence of obesity, diabetes, and obesity-related health risk factors. JAMA 2003; 289(1):76-79.
Ogden CL, Carroll MD, Curtin LR, McDowell MC, Tabak CJ, Flegal, KM. Prevalence of overweight and obesity in the United States, 1999-2004. JAMA 2006; 295(13):1549-1555.
Flegal KM, Carroll MD, Ogden CL, Curtin LR. Preva-lence and trends in obesity among US adults, 1999-2008. JAMA 2010; 303(3):235-241.
Adams JM. Some racial differences in blood pressures and morbidity in groups of White and colored work-men. Am J Med Sci 1932; 184(3):342-349.
Maio MC, Monteiro S, Chor D, Faerstein E, Lopes C. Cor/raça no Estudo Pró-Saúde: resultados compara-tivos de dois métodos de autoclassificação no Rio de Janeiro, Brasil. Cad Saude Publica 2005; 21(1):171-180. 31.
32.
33.
34.
35.
36.
37.
38. 39.
40.
41.
42.
43.
44.
45.
46.
47.
48.
49.
50.
51.
52.
53.
54.
55.
56.
57.