Department of Medical Emergencies, São Paulo University Medical School - São Paulo/SP, Brazil.
Email: [email protected] Received for publication on July 24, 2006. Accepted for publication on October 09, 2006.
CLINICAL SCIENCES
UNMEASURED ANIONS ACCOUNT FOR MOST OF
THE METABOLIC ACIDOSIS IN PATIENTS WITH
HYPERLACTATEMIA
Alexandre Toledo Maciel, Marcelo Park
Maciel AT, Park M. Unmeasured anions account for most of the metabolic acidosis in patients with hyperlactatemia. Clinics. 2007;62(1):55-62.
PURPOSE: To characterize the different components of metabolic acidosis in patients with hyperlactatemia in order to determine the degree to which lactate is responsible for the acidosis and the relevance that this might have in the outcome of these patients.
METHODS: Arterial blood gas, arterial lactate, Na+, K+, Ca2+, Mg2+, Cl-, phosphate, albumin, and creatinine were measured on
admission to make a diagnosis of the acid-base disturbances present. Intensive Care Unit and in-hospital mortality were also recorded.
RESULTS: A total of 58 patients with hyperlactatemia were included. They usually had a mild acidemia (pH 7.31 ± 0.12) and a significantly high Standard Base Deficit (7.6 ± 6.7 mEq/L). In addition to lactate (4.3 ± 2.3 mEq/L), chloride (106.9 ± 9.5 mEq/L) and unmeasured anions (8.6 ± 5.0 mEq/L) accounted for the metabolic acidosis. Unmeasured anions were primarily responsible
for the acidosis in both Intensive Care Unit survivors and nonsurvivors (44.7% ± 26.0% and 46.0% ± 17.5%, respectively, P =
0.871). Lactate contributed in similar percentages to the acidosis in both groups (23.0% ± 11.8% and 24.2% ± 9.7% in Intensive
Care Unit survivors and nonsurvivors, respectively; P = 0.753). Correlation between Standard Base Deficit and lactate was found
only in Intensive Care Unit nonsurvivors (r = 0.662, P < 0.01).
DISCUSSION: Hyperlactatemia is usually accompanied by metabolic acidemia, but lactate is responsible for a minor percentage of the acidosis; unmeasured anions account for most of the acidosis in patients with hyperlactatemia. The percentage of the acidosis due to hyperlactatemia was not relevant in terms of outcome.
KEYWORDS: Hyperlactatemia. Lactic acidosis. Unmeasured anions. Outcome. Critically ill patients.
INTRODUCTION
Since the first definition of hyperlactatemia and lactic acidosis proposed by Huckabee in 1961,1 many
controver-sies have occurred and different definitions have been pro-posed in order to determine and separate distinct situations that lead to an altered lactate metabolism. Initially, the terms “hyperlactatemia” or “stress hyperlactatemia” were used for situations in which no concomitant metabolic aci-dosis (at that time defined as low levels of serum
bicarbo-nate) was present. Increases in serum lactate attributed to an enhanced aerobic glycolytic pathway with a normal pyruvate/lactate ratio were thought to account for the cases of hyperlactatemia without acidosis.
When acidemia and low levels of serum bicarbonate were also present, the term “lactic acidosis” was then used. This condition could occur in the absence or in the pres-ence of tissue hypoperfusion, and physical exam would de-termine whether there were or were not signs of hemodynamic compromise and circulatory shock.
In 1976, Cohen and Woods2 abolished the term
More recently, the physicochemical approach to acid-base disturbances 3 has supported the idea that there is no
reason to separate “hyperlactatemia” and “lactic acidosis” since lactate, as a strong anion, is an acid itself. This mod-ern approach has the great advantage of characterizing the different components of the complex and usually multifac-torial metabolic acidosis of critically ill patients.
Standard base deficit (SBD) is frequently used to quan-tify the degree of metabolic acidosis, and it seems to be a better parameter than bicarbonate, which is highly influ-enced by the level of pCO2 and, therefore, by respiratory disturbances. Some authors have defined lactic acidosis as an SBD greater than 2 mEq/L with a lactate component that comprises at least 50% of the SBD.4
The aim of this study was to evaluate the SBD and its components in the presence of hyperlactatemia on admis-sion to the intensive care unit (ICU) using the physico-chemical approach and to determine to what degree hyperlactatemia was responsible for changes in the SBD. We hypothesized that in a significant number of patients with hyperlactatemia, lactate would not be the major anion responsible for metabolic acidosis and, additionally, that some patients with hyperlactatemia would not actually have metabolic acidosis (defined as an SBD ≥ 2 mEq/L). We also
determined whether the percentage of the SBD due to hyperlactatemia was relevant in terms of outcome. Because lactic acidosis seems to be the metabolic acidosis with the poorest prognosis,4 it is possible that both the absolute
lev-els of lactate and the degree to which lactate contributes to the final SBD are important.
MATERIALS AND METHODS
This study was approved by the local institutional eth-ics committee. Since all data used here was collected in the process of routine exams performed for all patients that are admitted to our ICU, the requirement for informed writ-ten consent was waived.
It is the routine in our 7-bed medical ICU to collect a list of laboratory tests from all patients on admission. This list includes an arterial blood gas determination with si-multaneous arterial lactate measurement, Na+, K+, Ca2+,
Mg2+, Cl-, phosphate, urea, creatinine, and albumin. From
July 2005 until January 2006, all consecutive patients ad-mitted to the ICU and their admission blood gas samples were checked prospectively for hyperlactatemia, defined as an arterial lactate ≥ 2 mEq/L. Patients transferred from or
to a different ICU were excluded. In patients with hyperlactatemia, we evaluated the simultaneous arterial pH, standard base deficit (SBD), partial pressure of carbon di-oxide (pCO2), bicarbonate (HCO3-), lactate, Na+, K+, Ca2+,
Mg2+, Cl-, phosphate, albumin, and creatinine, and we
cal-culated the 4 distinct components of SBD, the apparent strong ion difference (SIDa), the effective strong ion dif-ference (SIDe), and the strong ion gap (SIG) (see below). Age, gender, APACHE II score, ICU mortality, and in-hos-pital mortality were also recorded for all patients with hyperlactatemia.
Laboratory techniques and measurements
All biochemical variables were simultaneously collected at the time of admission to the ICU. All samples were analyzed in the central laboratory of the Institution. Na+,
K+, Ca2+, and Cl- were measured with the use of a direct
ion-selective electrode technique, Mg2+ by a colorimetric
technique, and phosphate with the use of an ultraviolet tech-nique. Albumin was measured with a bromocresol dye colorimetric technique. Arterial blood gas was analyzed and lactate was measured on the OMNI analyzer (Roche Di-agnostics System, F. Hoffmann-La Roche Ltd, Basel, Swit-zerland).
Quantitative physicochemical analysis
According to the contemporary approach to acid-base disturbances proposed by Stewart 3 and then modified by
Figge et al,5 only 3 independent variables can change the
blood pH: the strong ion difference (SID), weak acids (mainly phosphate and albumin), and pCO2. Based on the principles of electroneutrality and conservation of mass, the strong ion difference represents the net balance between positive strong ions (cations) and negative strong ions (ani-ons) according to the following formula (all concentrations in mEq/L):
SID = (Na+ + K+ + Ca2+ + Mg2+) – (Cl- + lactate-)
Therefore, decreases in the strong ion difference (such as those occurring in hyperchloremia and hyperlactatemia) lead to increases in dissociation of water (to maintain electroneutrality) and a fall in the pH. The opposite hap-pens if the strong ion difference increases. This equation, however, does not take into account the weak acids present in blood; therefore, we call this the apparent strong ion dif-ference (SIDa). The effective strong ion difdif-ference (SIDe) is represented by the sum of the charges of the weak acids according to the following equation:
SIDe = [(2.46 x 10⁻⁸)*(pCO
2 (mm Hg)/(10-pH))] + [(albumin
In healthy people, no significant amounts of unmeasured anions or lactate are present in the blood. The values of apparent and effective strong ion difference are therefore very close. However, in critically ill patients, both lactate and unmeasured ions are likely to increase. Unmeasured anions, measured by the strong ion gap (SIG), represent the “gap” between apparent and effective strong ion difference as shown in the following formula:
SIG = SIDa – SIDe
In summary, metabolic acidosis, according to the physi-cochemical theory, can only be the result of decreases in apparent strong ion difference (mainly hyperchloremia and hyperlactatemia), increases in the strong ion gap (unmeasured anions), or increases in weak acids (hyperalbuminemia, which is exceedingly rare, and hyperphosphatemia).
The final result of alkalinizing and acidifying distur-bances present in the blood is represented by the SBD, which is the titrable acid in blood,6 being positive when
acidifying disturbances predominate and negative when al-kalinizing disturbances are more prevalent. Using a physi-cochemical analysis, we can separate 4 distinct components of the SBD7 as follows:
• standard base deficit due to free water (SBDfw), which depends on the concentration of Na+:
SBDfw = 0.3 x (140 – Na+ (mEq/L))
• standard base deficit due to chloride (SBDcl), which de-pends on the concentration of both Na+ and Cl-:
SBDcl = (Cl+ (mEq/L) x (140/Na+ (mEq/L)) – 102
• standard base deficit due to albumin (SBDalb), which depends on the arterial pH and the concentration of se-rum albumin:
SBDalb = ((0.148 x pH) – 0.818) x (albumin (g/L) – 45)
• standard base deficit due to lactate and unmeasured ani-ons (SBDua), which corresponds to the rest of the SBD: SBDua = SBD – (SBDfw + SBDcl + SBDalb)
Although there is no consensus about a precise value of the SBD that represents significant metabolic acidosis, we decided to use an arbitrary value of 2 mEq/L, since hypoalbuminemia is an almost universal finding in criti-cally ill patients, contributing a mean value of -5 mEq/L in the final SBD in a recent study.8 Therefore, even a small
positive SBD value, such as 2 mEq/L, could be the conse-quence of a significant acidifying disturbance.
To calculate the percentage of metabolic acidosis due to hyperlactatemia, we considered the total acidifying ele-ments (SBD acid) as the following (all concentrations in mEq/L):
SBD acid = [lactate] + SBDfw + SBDcl + SIG
We did not use the SBDua in the formula, since it does not discriminate between lactate and unmeasured anions; we preferred to use the strong ion gap,9 as the equivalent
of the unmeasured anions, and lactate, separately. Since hypoalbuminemia is almost invariably present in critically ill patients, SBDalb was not included in the formula (it al-most always has an alkalinizing effect). SBDfw and SBDcl were only included in the formula when their sum was posi-tive, ie, when they had an acidifying effect.
The percentage of metabolic acidosis due to lactate (% lactate) and due to the SIG (%SIG) were then determined by the following relationships:
%lactate = lactate / SBD acid %SIG = SIG / SBD acid
The rest of the metabolic acidosis (not due to lactate or the SIG) was attributed mainly to hyperchloremia.
Statistical analysis
All values were expressed as mean and standard devia-tion except for 2 variables (Ca2+ and creatinine), which
re-quired a logarithmic transformation in order to acquire a normal distribution. Their values were expressed as geo-metric means. The Student t test was used for comparison of continuous parameters, and Pearson’s test was used for the correlation analysis. The software SigmaStat for Win-dows (version 2.0, Copyrightãð Jandel Corporation) and
SPSS for Windows (version 10.0.1, Copyrightãð SPSS
In-corporation) were used for all measurements. A P value less than 0.05 was considered significant.
RESULTS
During the study period, 159 patients were admitted into our ICU, and 152 patients were included in the study; 7 patients were excluded because they came from another ICU or were transferred to another ICU before discharge. Of the 152 patients, we found lactate ≥ 2 mEq/L in 58
physi-cochemical approach to analyze the different components of the acid-base disturbances present in these patients (Ta-ble 2), we verified that they usually exhibited a mild acidemia (pH 7.31 ± 0.12) and a significant metabolic aci-dosis (SBD 7.6 ± 6.7 mEq/L). This metabolic aciaci-dosis was due to both hyperlactatemia (lactate 4.3 ± 2.3 mEq/L) and hyperchloremia (chloride 107 ± 10 mEq/L), both of which
contributed to a decreased apparent strong ion difference (36.3 ± 6.5 mEq/L), and to an increased strong ion gap (8.6 ± 5.0 mEq/L). Serum levels of Na+, K+, Ca2+, Mg2+, and
phosphate were normal, and low levels of serum albumin (26 ± 8 g/L) attenuated the level of metabolic acidemia. Creatinine was already increased at admission (1.4 ± 2.4 mg/dL). Lactate was 23.3% ± 11.2% of the SBD acid, and the SIG was 45.1% ± 23.9% (P < 0.001) (Figure 1). A
sig-nificant correlation was found between SBD and lactate (r
= 0.322, P = 0.01).
We divided the patients grouping into ICU survivors and nonsurvivors, and we then evaluated the same variables de-scribed above (Table 3). Both groups were usually acidemic on admission, but nonsurvivors had a tendency to be more acidemic (pH 7.33 ± 0.10 vs 7.26 ± 0.15, P = 0.05).
Meta-bolic acidosis was more severe in nonsurvivors (SBD 11.7 ± 7.3 mEq/L vs 6.1 ± 5.8 mEq/L in survivors, P< 0.01).
The same acidifying variables—hyperlactatemia, hyperchloremia, and increased strong ion gap—contributed to metabolic acidosis in both groups. Of these, only lac-tate was significantly higher in nonsurvivors (3.8 ± 1.8 vs 5.8 ± 2.9 mEq/L, P < 0.01). However, as occurred in the
analysis of all patients with hyperlactatemia (Table 2), both survivors and nonsurvivors had a minority of their meta-bolic acidosis due to lactate. Lactate comprised 23.0% ± 11.8% of the SBD acid in survivors and 24.2% ± 9.7% in
nonsurvivors (P = 0.753). The SIG comprised 44.7% ±
26.0% of the SBD acid in survivors and 46.0% ± 17.5% in nonsurvivors (P = 0.871). The percentage of SBD acid
Table 2 - Biochemical variables of the 58 patients with hyperlactatemia (lactate ≥ 2 mEq/L) (mean ± SD)
Variable Value (n = 58)
pH 7.31 ± 0.12
pCO2 - mm Hg 35.6 ± 14.3
HCO3- - mEq/L 17.7 ± 6.2
SBD* - mEq/L 7.6 ± 6.7
Lactate - mEq/L 4.3 ± 2.3
Na+ - mEq/L 140 ± 7
K+ - mEq/L 4.3 ± 0.9
Ca2+ a - mEq/L 2.3 ± 1.2
Mg2+ - mEq/L 1.0 ± 0.3
Cl- - mEq/L 107 ± 10
Phosphate - mmol/L 1.4 ± 0.5
Albumin - g/L 26 ± 8
SIDab - mEq/L 36.3 ± 6.5
SIDe - mEq/L 27.2 ± 6.4
SIGc - mEq/L 8.6 ± 5.0
Creatininea - mg/dL 1.4 ± 2.4
SBDfw - mEq/L 0.0 ± 2.0
SBDCl - mEq/L 4.8 ± 6.7
SBDalb - mEq/L -5.0 ± 2.2
SBDua - mEq/L 7.4 ± 5.9
* SBD = standard base deficit, the respective following abbreviations; denote: FW - free water portion of SBD, Cl - chloride portion of SBD, alb - albumin portion of SBD and ua - unmeasured anions portion of SBD; ageometric
mean and standard deviation; bSID = strong ion difference, and the
abbreviations denote: a - apparent SID and e - effective SID; cSIG denotes
strong ion gap
Table 1 - General characteristics of the 58 patients with hyperlactatemia (lactate ≥ 2 mEq/L)
Characteristic Value (n = 58)
Age – years (mean ± SD) 54 ± 19
Gender - male/female – no. (%)* 30 (52) / 28 (48)
APACHE II scorea (mean ± SD) 16 ± 8
ICUb mortality – no. (%) 16 (28)
Hospital mortality – no. (%) 25 (43)
Diagnosis
Severe sepsis / septic shock – no. (%) 19 (33)
Post-operative – no. (%) 12 (21)
Respiratory failure – no. (%) 11 (19)
Trauma – no. (%) 5 (9)
Neurologic syndromesc – no. (%) 4 (7)
Pancreatitis – no. (%) 2 (3)
Cardiogenic shock – no. (%) 1 (2)
Other – no. (%) 4 (7)
*no. = the number of patients with the characteristic. aAPACHE II = the
acute physiologic and chronic health evaluation score, which ranges from 0 to 72. bICU = intensive care unit. cneurologic syndromes including stroke
and meningoencephalitis
due to the strong ion gap was significantly greater than the percentage due to lactate in both survivors and nonsurvivors (P < 0.001 for both groups) (Figure 1). All electrolytes were
similar in both groups, as was creatinine. Hypoalbuminemia was present in both groups but was greater in nonsurvivors (2.1 ± 0.5 g/dL) than in survivors (2.8 ± 0.8 g/dL) (P <
0.01). Correlation between SBD and lactate was absent in
survivors (r = -0.125, P = 0.430) and present in
nonsurvivors (r = 0.662, P < 0.01).
Eight of the 58 patients with hyperlactatemia (13.8%) did not have metabolic acidosis (ie, an SBD > 2 mEq/L). Only 1 died in the ICU. Of the 58 patients with hyperlactatemia, 7 (12.1%) had lactate levels greater than the strong ion gap on admission. All survived until discharge from ICU.
DISCUSSION
Hyperlactatemia is a well established marker of poor outcome in critically ill patients.10–13 However,
interpreta-tion of high levels of lactate is a challenge to intensivists, since its etiology and pathophysiology is not always clear. Until recently, it was common to use the terms “hyperlactatemia” and “lactic acidosis” interchangeably and as synonyms of “tissue hypoperfusion;” however, this is not always the case.14 Although we have shown in our
study that patients with hyperlactatemia usually presented with metabolic acidemia, and that at admission, both lac-tate and the SBD were significantly different between ICU
survivors and nonsurvivors, lactate was not primarily re-sponsible for the acidemia; it was rather, the unmeasured anions that were primarily responsible. The etiology and pathophysiology of increased levels of unmeasured anions is even more obscure than that of hyperlactatemia. They are thought to increase in many distinct situations such as renal and hepatic impairment,15 tissue hypoperfusion,16 and
endotoxemia.17
Controversy exists regarding the relevance that unmeasured anions have in the outcome of critically ill pa-tients.18–20 In our study, the strong ion gap was not
differ-ent between survivors and nonsurvivors at admission, but this could have been due to the small sample size. In a larger study, Cusack et al18 also failed to find a significant
difference in the strong ion gap between survivors and nonsurvivors. Similarly to our study, they found a relevant difference in the SBDua between survivors and nonsurvivors. Although both the strong ion gap and SBDua are variables used to quantify unmeasured anions, SBDua includes lactate and the strong ion gap does not. This could explain the fact that in both studies, SBDua was different in survivors vs nonsurvivors, while the strong ion gap was not. Kellum suggested that the use of gelatins as resusci-tation fluids may interfere in the prognostic relevance of unmeasured anions.21 Neither do our ICU, or our
Emer-gency Department use this type of colloid; rather, we use crystalloids in the resuscitation of our patients and only rarely colloids.
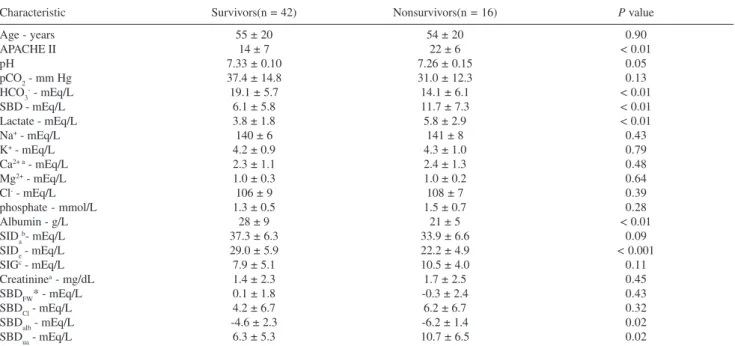
Table 3 - Comparison between survivors and nonsurvivors (mean ± SD)
Characteristic Survivors(n = 42) Nonsurvivors(n = 16) P value
Age - years 55 ± 20 54 ± 20 0.90
APACHE II 14 ± 7 22 ± 6 < 0.01
pH 7.33 ± 0.10 7.26 ± 0.15 0.05
pCO2 - mm Hg 37.4 ± 14.8 31.0 ± 12.3 0.13
HCO3- - mEq/L 19.1 ± 5.7 14.1 ± 6.1 < 0.01
SBD - mEq/L 6.1 ± 5.8 11.7 ± 7.3 < 0.01
Lactate - mEq/L 3.8 ± 1.8 5.8 ± 2.9 < 0.01
Na+ - mEq/L 140 ± 6 141 ± 8 0.43
K+ - mEq/L 4.2 ± 0.9 4.3 ± 1.0 0.79
Ca2+ a - mEq/L 2.3 ± 1.1 2.4 ± 1.3 0.48
Mg2+ - mEq/L 1.0 ± 0.3 1.0 ± 0.2 0.64
Cl- - mEq/L 106 ± 9 108 ± 7 0.39
phosphate - mmol/L 1.3 ± 0.5 1.5 ± 0.7 0.28
Albumin - g/L 28 ± 9 21 ± 5 < 0.01
SIDab- mEq/L 37.3 ± 6.3 33.9 ± 6.6 0.09
SIDe - mEq/L 29.0 ± 5.9 22.2 ± 4.9 < 0.001
SIGc - mEq/L 7.9 ± 5.1 10.5 ± 4.0 0.11
Creatininea - mg/dL 1.4 ± 2.3 1.7 ± 2.5 0.45
SBDFW* - mEq/L 0.1 ± 1.8 -0.3 ± 2.4 0.43
SBDCl - mEq/L 4.2 ± 6.7 6.2 ± 6.7 0.32
SBDalb - mEq/L -4.6 ± 2.3 -6.2 ± 1.4 0.02
SBDua - mEq/L 6.3 ± 5.3 10.7 ± 6.5 0.02
* SBD = standard base deficit, the respective following abbreviations denote: FW - free water portion of SBD, Cl - chloride portion of SBD, alb - albumin portion of SBD and ua - unmeasured anions portion of SBD; ageometric mean and standard deviation; bSID = strong ion difference, and the abbreviations
We found unmeasured anions to be the most important acidifying variable in patients with hyperlactatemia, even greater than lactate itself. If we use the definition of lactic acidosis proposed by Gunnerson et al4 (lactate accounting
for more than 50% of the metabolic acidosis), most of pa-tients with hyperlactatemia actually did not have lactic aci-dosis. Although these authors found lactate to be prima-rily responsible for metabolic acidosis in more patients than were unmeasured anions, they selected only patients with suspected lactic acidosis with an SBD higher than 2 mEq/ L. We found 13.8% of the patients with hyperlactatemia to have an SBD lower than 2 mEq/L. Additionally, in their study, not all values were collected at the same time on the day of admission, and they studied a distinct popula-tion. This could explain at least in part the differences be-tween their findings and ours.
Most studies in critically ill patients have found a poor correlation between the SBD and lactate.22–24 This could be
explained by the fact that lactate only represents a small percentage of the SBD in most patients, in agreement with the finding of our study. On the other hand, we found that although the percentage of metabolic acidosis due to lac-tate was similar between survivors and nonsurvivors with hyperlactatemia, a significant correlation between lactate and the SBD was only present in nonsurvivors. The most feasible explanation would be that nonsurvivors had higher levels of lactate, which could have resulted in a correla-tion between the two variables. However, we had previously found a correlation between lactate and the SBD only in ICU nonsurvivors even when comparing groups with simi-lar levels of lactate.25 According to the theory of unreversed
ATP hydrolysis proposed by Zilva,26 hyperlactatemia in
anaerobic conditions is followed by metabolic acidosis due to the accumulation of protons that were produced in the glycolytic pathway but not used in the oxidative metabo-lism. At that time, lactate was not considered an acid. How-ever, if the Zilva theory is true, depending on the origin of hyperlactatemia (aerobic or anaerobic), the same level of lactate could lead to distinctly different degrees of meta-bolic acidosis. It is probable that in the group of ICU nonsurvivors, more patients had hyperlactatemia due to tis-sue hypoperfusion and anaerobiosis. This could lead to the presence of a significant correlation between lactate and the SBD in only this group of patients.
Our study had some limitations. Since we used only a
specific group of critically ill patients (those presenting hyperlactatemia at admission to the ICU) during a short observation period, our sample size was small; some ab-sence of difference between groups could be due to this fact. We also had a heterogenous population of critically ill patients, so it is not easy to arrive at conclusions regard-ing any specific group of patients, such as for instance sep-tic patients.
Although largely used to define metabolic acidosis, the SBD is the sum of both acidifying and alkalinizing vari-ables. Therefore, normal values for the SBD may result when significant acidifying disturbances including hyperlactatemia occur concomitantly with significant alka-linizing disturbances such as hypoalbuminemia. We found a small proportion of patients with hyperlactatemia hav-ing normal or even low values for the SBD, and we used the term “hyperlactatemia without acidosis” for these pa-tients, but this may not be appropriate or may even be para-doxical.
The fact is that current literature does not have very pre-cise and accurate definitions for “metabolic acidosis” and “lactic acidosis.” A large variability between definitions makes the comparison between studies very difficult. Gunnerson et al4 defined “lactic acidosis” as lactate
ac-counting for more than 50% of the SBD. However, they did not clearly define how they calculated this percentage. Since, as we have already noted, the SBD includes alkali-nizing variables, it would be more appropriate to calculate this percentage by selecting only the acidifying variables (the SBD acid in our study). The use of the total SBD may overestimate the percentage of acidosis due to lactate.
Finally, all the data in this study were limited to the day of admission. Evolutive changes in lactate and the SBD are certainly very important in the outcome of these pa-tients. However, the aim of this study was to check for the prevalence of anions other than lactate on admission of pa-tients with hyperlactatemia and not to evaluate the evolu-tion of these anions during ICU stay. Our findings show that although very relevant in terms of prognosis, lactate is only the tip of a much larger iceberg predominantly com-prised of unmeasured anions.
COMPETING INTERESTS
RESUMO
Maciel AT, Park M. Ânions não mensuráveis são responsáveis pela maior parte da acidose metabólica de pacientes com hiperlactatemia. Clinics. 2007;62(1):55-62.
OBJETIVO: Caracterizar os diferentes componentes da acidose metabólica de pacientes com hiperlactatemia de modo a verificar o quanto o lactato é responsável pela acidose e a relevância que isso possa ter no prognóstico desses pacientes.
MÉTODOS: Gasometria arterial com dosagem de lactato, Na+, K+, Ca2+, Mg2+, Cl-, fosfato, albumina e creatinina
séricas foram coletados no momento da admissão para fazer o diagnóstico dos possíveis distúrbios ácido-básicos presentes. Mortalidade na UTI e mortalidade hospitalar foram avaliadas.
RESULTADOS: Um total de 58 pacientes com hiperlactatemia foram incluídos. Eles tinham na média uma acidemia leve (pH 7.31 ± 0.12) e o déficit de base significativamente elevado (7.6 ± 6.7 mEq/L). Além do lactato (4.3 ± 2.3 mEq/L), o cloro (106.9 ± 9.5 mEq/L) e
os ânions não mensuráveis (8.6 ± 5.0 mEq/L) contribuíram para a acidose metabólica. Os ânions não mensuráveis foram responsáveis pela maior parcela da acidose tanto nos pacientes que tiveram alta da UTI como nos que faleceram (44.7 ± 26.0 % e 46.0 ± 17.5 %, respectivamente, p= 0.871). O lactato contribuiu em percentagens semelhantes para a acidose em ambos os grupos (23.0 ± 11.8 % nos sobreviventes e 24.2 ± 9.7 % nos óbitos, p= 0.753). Correlação entre o déficit de base e o lactato somente foi encontrada nos óbitos (r = 0.662, p < 0.01).
DISCUSSÃO: Hiperlactatemia é comumente acompanhada de acidemia metabólica, porém o lactato corresponde a uma parcela minoritária da acidose; ânions não mensuráveis contribuem com a maior parte da carga ácida em pacientes hiperlactatêmicos. O percentual da acidose devido à hiperlactatemia não foi relevante em termos de prognóstico.
UNITERMOS: Hiperlactatemia. Acidose láctica. Ânions não mensuráveis. Prognóstico. Pacientes críticos.
REFERENCES
1. Huckabee WE. Abnormal resting blood lactate: I. The significance of hyperlactatemia in hospitalized patients. Am J Med. 1961;30:833-9. 2. Cohen RD, Woods HF. Clinical and biochemical aspects of lactic
acidosis. Boston: Blackwell Scientific Publications; 1976.
3. Stewart P. Modern quantitative acid-base chemistry. Can J Physiol Pharmacol. 1983;61:1444-61.
4. Gunnerson KJ, Saul M, He S, Kellum JA. Lactate versus non-lactate metabolic acidosis: a retrospective outcome evaluation of critically ill patients. Critical Care. 2006;10:R22.
5. Figge J, Rossing TH, Fencl V. The role of serum proteins in acid-base equilibria. J Lab Clin Med. 1991;117:453-67.
6. Siggaard-Andersen O. The acid-base status of the blood. 4th ed.
Copenhagen: Munksgaard; 1974.
7. Gilfix BM, Bique M, Magder S. A physical chemical approach to the analysis of acid-base balance in the clinical setting. Journal of Critical Care. 1993;8:187-97.
8. Funk GC, Doberer D, Heinze G, Madl C, Holzinger U, Schneeweiss B. Changes of serum chloride and metabolic acid-base state in critical illness. Anaesthesia. 2004;59:1111-5.
9. Kellum JA. Determinants of blood pH in health and disease. Critical Care. 2000;4:6-14.
10. Smith I, Kumar P, Molloy S, Rhodes A, Newman PJ, Grounds RM, et al. Base excess and lactate as prognostic indicators for patients admitted to intensive care. Intensive Care Med. 2001;27:74-83.
11. Marecaux G, Pinsky MR, Dupont E, Kahn RJ, Vincent JL. Blood lactate levels are better prognostic indicators than TNF and IL-6 levels in patients with septic shock. Intensive Care Med. 1996;22:404-8. 12. Bakker J, Coffernils M, Leon M, Gris P, Vincent JL. Blood lactate levels
are superior to oxygen-derived variables in predicting outcome in human septic shock. Chest. 1991;99:956-62.
13. Bernardin G, Pradier C, Tiger F, Deloffre P, Mattei M. Blood pressure and arterial lactate level are early indicators of short-term survival in human septic shock. Intensive Care Med. 1996;22:17-25.
14. Handy JM, Soni NC. Lactic acidosis: theory and practice uncoupled? In Yearbook of Intensive Care and Emergency Medicine. Edited by Vincent JL. Berlin: Springer-Verlag; 2004, p 675-82.
16. Kaplan LJ, Kellum JA. Initial pH, base deficit, lactate, anion gap, strong ion difference and strong ion gap predict outcome from major vascular injury. Crit Care Med. 2004;32:1120-4.
17. Kellum JA, Bellomo R, Kramer DJ, Pinsky MR. Hepatic anion flux during acute endotoxemia. J Appl Physiol. 1995;78:2212-7. 18. Cusack RJ, Rhodes A, Lochhead P, Jordan B, Perry S, Ball JAS, et al.
The strong ion gap does not have prognostic value in critically ill patients in a mixed medical/surgical adult ICU. Intensive Care Med. 2002;28:864-9.
19. Rocktaeschel J, Morimatsu H, Uchino S, Bellomo R. Unmeasured anions in critically ill patients: can they predict mortality? Crit Care Med. 2003;31:2131-6.
20. Balasubramanyan N, Havens PL, Hoffman GM. Unmeasured anions identified by the Fencl-Stewart method predict mortality better than base excess, anion gap, and lactate in patients in the pediatric intensive care unit. Crit Care Med. 1999;27:1577-81.
21. Kellum JA. Clinical review: Reunification of acid-base physiology. Critical Care. 2005;9:500-7.
22. Mikulaschek A, Henry SM, Donovan R, Scalea TM. Serum lactate is not predicted by anion gap or base excess after trauma resuscitation. J Trauma. 1996;40:218-24.
23. Aduen J, Bernstein WK, Miller J, Kerzner R, Bhatiani A, Davison L, et al. Relationship between blood lactate concentrations and ionized calcium, glucose, and acid-base status in critically ill and noncritically ill patients. Crit Care Med. 1995;23:246-52.
24. Nimmo GR, Grant IS, Mackensie SJ. Lactate and acid base changes in the critically ill. Postgrad Med J. 1991;67:S56-S61.
25. Maciel AT, Pizzo VRP, Machado AS, Park M. Relevance of base deficit in the outcome of critically ill patients admitted with hyperlactatemia. Revista Brasileira de Terapia Intensiva. 2005;17:153-6.