Relationships among Body Condition, Insulin
Resistance and Subcutaneous Adipose Tissue
Gene Expression during the Grazing Season in
Mares
Shaimaa Selim1, Kari Elo1*, Seija Jaakkola1, Ninja Karikoski2, Ray Boston3, Tiina Reilas4, Susanna Särkijärvi4, Markku Saastamoinen4, Tuomo Kokkonen1
1Department of Agricultural Sciences, P.O. Box 28, FI-00014 University of Helsinki, Helsinki, Finland,
2Department of Equine and Small Animal Medicine, P.O. Box 57, FI-00014 University of Helsinki, Helsinki, Finland,3Department of Clinical Studies, New Bolton Center, School of Veterinary Medicine, University of Pennsylvania, Philadelphia, PA 19104, United States of America,4Department of Green Technology, Natural Resources Institute Finland (Luke), Opistontie 10 A 1, FI-32100 Ypäjä, Finland
Abstract
Obesity and insulin resistance have been shown to be risk factors for laminitis in horses. The objective of the study was to determine the effect of changes in body condition during the grazing season on insulin resistance and the expression of genes associated with obe-sity and insulin resistance in subcutaneous adipose tissue (SAT). Sixteen Finnhorse mares were grazing either on cultivated high-yielding pasture (CG) or semi-natural grassland (NG) from the end of May to the beginning of September. Body measurements, intravenous glu-cose tolerance test (IVGTT), and neck and tailhead SAT gene expressions were measured in May and September. At the end of grazing, CG had higher median body condition score (7 vs. 5.4, interquartile range 0.25 vs. 0.43;P=0.05) and body weight (618 kg vs. 572 kg±
10.21 (mean±SEM);P=0.02), and larger waist circumference (P=0.03) than NG. Neck fat
thickness was not different between treatments. However, tailhead fat thickness was smaller in CG compared to NG in May (P=0.04), but this difference disappeared in Septem-ber. Greater basal and peak insulin concentrations, and faster glucose clearance rate (P=0.03) during IVGTT were observed in CG compared to NG in September. A greater de-crease in plasma non-esterified fatty acids during IVGTT (P<0.05) was noticed in CG com-pared to NG after grazing. There was down-regulation of insulin receptor, retinol binding protein 4, leptin, and monocyte chemoattractant protein-1, and up-regulation of adiponectin (ADIPOQ), adiponectin receptor 1 and stearoyl-CoA desaturase (SCD) gene expressions in SAT of both groups during the grazing season (P<0.05). Positive correlations were ob-served betweenADIPOQand its receptors and betweenSCDandADIPOQin SAT (P<0.01). In conclusion, grazing on CG had a moderate effect on responses during IVGTT, but did not trigger insulin resistance. Significant temporal differences in gene expression profiles were observed during the grazing season.
a11111
OPEN ACCESS
Citation:Selim S, Elo K, Jaakkola S, Karikoski N, Boston R, Reilas T, et al. (2015) Relationships among Body Condition, Insulin Resistance and
Subcutaneous Adipose Tissue Gene Expression during the Grazing Season in Mares. PLoS ONE 10(5): e0125968. doi:10.1371/journal.pone.0125968
Academic Editor:Marinus F.W. te Pas, Wageningen UR Livestock Research, NETHERLANDS
Received:November 11, 2014
Accepted:March 27, 2015
Published:May 4, 2015
Copyright:© 2015 Selim et al. This is an open access article distributed under the terms of the
Creative Commons Attribution License, which permits unrestricted use, distribution, and reproduction in any medium, provided the original author and source are credited.
Data Availability Statement:All relevant data are within the paper and its Supporting Information file.
Funding:Funding was received from the Ministry of Agriculture and Forestry of Finland to MS and the first author (S. Selim) was financially supported by Raisio plc Research Foundation and Niemi Säätiö Foundation. The funders had no role in study design, data collection and analysis, decision to publish, or preparation of the manuscript.
Introduction
Obesity is a common disease and welfare problem in equines [1]. The metabolic effects of obe-sity and its association with insulin resistance, laminitis, and increased inflammatory cytokine expression in equids are of increasing prevalence and importance. Equine metabolic syndrome is an endocrinopathic disease of horses and ponies characterized by obesity, hyperinsulinemia and insulin resistance, laminitis, dyslipidemia, hyperleptinemia, and altered reproductive cy-cling [2]. Obesity may play a role in the development of insulin resistance in equine through in-duction of a pro-inflammatory state [3,4] and/or elevated plasma lipid concentrations [5]. However, not all obese horses are insulin resistant and, on the contrary, insulin resistance can occur in non-obese animals [2,6]. Obesity and insulin resistance have been linked with increased risk for laminitis [7,8]; however, the mechanism by which obesity and insulin resistance/hyperinsulinemia increase susceptibility to laminitis has not yet been clarified. In experimental studies, continuous hyperinsulinemia has been shown to induce laminitis in both ponies and horses [9,10].
Several studies in equine [3,11,12,13] highlight the role of adipose tissue in the regulation of metabolism and homeostasis through secretion of various cytokines; however the mecha-nism governing these cytokines in metabolic disorders often remains obscure. Obesity may in-duce a state of low-grade inflammation by recruiting macrophages into adipose tissue in response to the increased monocyte chemoattractant protein-1 (MCP-1) gene expression, and these macrophages may attribute to elevated circulating inflammatory markers in humans and mice such as tumor necrosis factor-alpha (TNF) [14]. Vicket al. [3] reported that higher blood
TNFmRNA expression and plasma TNF concentration were connected with obesity in Thor-oughbred mares. However, in non-obese, over-conditioned horses,MCP-1orTNFgene ex-pression was not different across adipose tissue depots or altered by insulin sensitivity status [12]. In human and rodent obesity, increased mRNA expression ofTNFis implicated in the in-duction of insulin resistance through several mechanisms, including inhibition of intracellular signalling from the insulin receptor [15]. Suageeet al. [16] reported that acute hyperinsuline-mia decreased the transcript abundance of insulin receptor, but had no effect on its protein ex-pression in adipose tissue of Thoroughbred mares.
Obesity also affects the production of adiponectin (ADIPOQ), leptin and retinol binding protein 4 (RBP4). Obesity has been associated with higher plasma concentration of leptin and lower plasma concentration of ADIPOQ in horses [17]. A recent study by Ungruet al. [13] re-ported that elevated circulating ADIPOQ, and decreased circulating leptin and RBP4 were as-sociated with body weight reduction in ponies; however, their expression patterns in tailhead subcutaneous adipose tissue (SAT) did not reflect these changes.
Stearoyl-CoA desaturase (SCD) may play an important role in the pathogenesis of obesity-induced insulin resistance in humans and mice [18]. Mice withSCDgene deficiency had creased insulin signalling/sensitivity and were resistant to diet-induced obesity, despite in-creased food intake [19]. The study by Yao-Borengasseret al. [20] showed that the expression ofSCDis positively correlated with the expression of adiponectin receptor 1 (ADIPOR1) in human adipose tissue. To the authors’knowledge, the role ofSCDin obesity and/or insulin re-sistance in equine has not been previously reported.
glucose challenge, and more abundant expression of genes potentially associated with insulin resistance in SAT. Additionally, we hypothesized that seasonal change in gene expression would reflect changes in body condition during the grazing season.
Materials and Methods
Animals, diets, and experimental design
The experimental procedures were authorized by the National Animal Experiment Board in Finland (Permit Number: ESAVI/2244/04.10.03/2011). Insertion of catheters and skin inci-sions were performed under local anesthesia with sedation.
Twenty-two mares were grazed either on CG (n = 11) or semi-natural grassland (NG; n = 11) from the end of May to the beginning of September at MTT Agrifood Research Finland in Ypäjä. The coordinates of the pastures are 60.795° N and 23.315° E. The experimental design has been described previously by Särkijärviet al. [21]. In the beginning of the trial, the horses formed equal pairs based on their age, live weight and body condition, medication and repro-ductive history, and pedigree. The two horses of each pair were then randomly allotted to dif-ferent pastures. The horses were stable fed according to their needs on maintenance level with similar diets before May samples. The mares had access to CG or NG 24 h a day during the grazing season. Eight mares from each group (in total 16), aged from 6 to 19 yrs. old (mean age 10.46 ± 4.42 SD), were used for intravenous glucose tolerance test (IVGTT) and gene expres-sion profiling as a part of a larger project [21]. One mare from the CG group was excluded from the experiment in July because of laminitis that was not related to treatment; thus, Sep-tember data presented are derived from 15 mares. The excluded mare had been eating spoiled feed. Spring flood had moved an old hay bale in the paddock and this horse started eating it.
The area of 4.5 ha CG was divided into three equal paddocks (I-III). The grass was dominat-ed with three grass species: tall fescue (Festuca arundinacea Schreb.), timothy (Phleum pratense L.), and meadow fescue (Festuca pratensis L.). All paddocks were fertilized with 82 kg nitrogen per ha at the beginning of the growing season and with 54 kg nitrogen per ha in July. Paddocks II and III were topped in July; old vegetation which was rejected by the horses were cut and col-lected. There was no need for topping in the paddock I because it was thoroughly eaten by the horses. The suitability of these grass species and their mixtures in the relation to their water sol-uble carbohydrates content, chemical composition and preferences by Finnhorse mares has been presented previously [22,23].
and declined when maturing, being lowest in the reproductive phase (Herzon et al., 2013, unpublished).
Body measurements
Body measurements were determined in May and September for 16 mares used for IVGTT and gene expression. Body weights (BW) were measured with an electric animal scale and body condition score (BCS) evaluated using the Henneke one to nine scoring system [24]. Waist circumference was measured from two-thirds of the distance from the point of the shoulder to the point of the hip as suggested by Carteret al. [25]. Subcutaneous fat thickness was measured using an Aloka SSD-500 ultrasound scanner with a 3.5 MHz transducer (Aloka, Tokyo, Japan) at neck and tailhead. The thickness of the neck fat was measured 10 cm down the halfway of the neck length measured from the poll to the withers. Tailhead subcutaneous fat was measured 11 cm cranially and 10 cm laterally from the tailhead.
Intravenous glucose tolerance test (IVGTT)
On the day prior to IVGTT, horses were restrained in stocks and sedated with detomidine (0.01 mg/kg IV; Domosedan 10 mg/mL, Orion Pharma, Turku, Finland) and butorphanole (0.01 mg/kg IV; Butordol 10 mg/mL, MSD Animal Health, Boxmeer, Netherlands) for the bi-lateral jugular vein catheter insertion. After having achieved adequate sedation, the hair over the jugular veins was removed and the puncture sites were prepared surgically. Catheters (Mila 14G, Mila International, Kentucky, USA) were then inserted into both jugular veins using a local anesthetic (2% lidocaine, Lidocain 20 mg/mL, Orion Pharma, Turku, Finland) blockade. Finally, the catheters with 3-way valves were heparinized and sutured to skin. In the following morning, after 12 h fasting, mares received a jugular intravenous infusion of 0.3 g of glucose/kg body weight (glucose 300 mg/mL, B. Braun Melsungen AG, Melsungen, Germany). Average infusion times were 5 min 18 sec in May and 5 min 13 sec in September. During the 3-h dura-tion of the IVGTT, venous blood samples were collected at -10, -5, 0, 2, 4, 6, 8, 10, 12, 14, 16, 18, 20, 25, 30, 40, 50, 60, 70, 80, 90, 120, 150 and 180 min relative to the start of glucose infu-sion. Catheters were flushed with heparin solution (1 mL of heparin/100 mL of 0.9% NaCl) im-mediately after infusions or blood samplings. Blood samples were collected from the right jugular vein, whereas the infusion of glucose for the IVGTT was administered into the left jugular vein.
The blood samples were immediately placed in EDTA tubes (Vacutainer; BD Medical, Bec-ton Dickinson Oy, Vantaa, Finland) and kept in ice until centrifuged. Blood samples were cen-trifuged at 2220 × g for 10 min to separate plasma. The plasma was stored in plastic tubes at −20°C until analysis for concentrations of glucose, insulin and NEFA. Plasma NEFA and glu-cose were determined as described previously by Salinet al. [26]. Intra- and inter-assay CVs for glucose measurement were 8.20% and 1.96%, respectively. Intra- and inter-assay CVs for NEFA determination were 7.90% and 1.83%, respectively. Plasma insulin was measured by RIA (Coat-A-Count; Siemens Diagnostics, Los Angeles, CA, USA) according to manufacturer’s instructions. Intra-assay CV for insulin determination was 12.20% and inter-assay CVs were 9.16% and 9.43% for low and medium concentrations, respectively. The detection limit for in-sulin was 2.56μIU/mL.
Calculations. Plasma glucose, insulin, and NEFA responses to IVGTT were determined as the net incremental area under the response curve (AUC180; mmol/L × min for glucose and NEFA;μIU/mL × min for insulin) during the 180 min of IVGTT. The AUC was calculated
NEFA and -5 min for insulin). Peaks of glucose and insulin, and the nadir of NEFA concentra-tions were determined. The clearance rate (CR180; %/min) of metabolites during IVGTT was calculated using PROC NLIN of SAS (version 9.2). Exponential curves for the calculation of clearance rate for glucose and NEFA concentrations during IVGTT were fitted using the equa-tions described by Salinet al. [26]. Results of the IVGTT for each horse were also analyzed ac-cording to the minimal model of glucose and insulin dynamics [28]. Since a large number of implausible solutions for individual IVGTT results was found, minimal model results are not presented for the treatment groups. Instead, they are used only to demonstrate the degree of in-sulin resistance of horses and its effect on the outcome of minimal model analysis. Based on the estimability of the insulin sensitivity index (Si x 10-4/mU/L/min) in minimal model analysis the horses were categorized to two groups. Values 1<Si<10 x 10-4/mU/L/min were
consid-ered normal, whereas very low (Si<1 x 10⁻⁴/mU/L/min, n = 10) or very high values (Si>10 x
10-4/mU/L/min, n = 11) were considered problematic to estimate (inestimable).
Adipose tissue biopsy specimen collection
Neck and tailhead SAT were collected for the gene expression profiling in May and September from the same area where the fat thickness was measured, but on the other side of the horse. Adipose tissue biopsies were performed on the same day of the IVGTT. After the insertion of jugular vein catheters for IVGTT, hair over the sample collection area was removed, and the area was prepared surgically. In addition, local anesthesia (lidocaine 40–100 mg per collection site; Lidocain 20 mg/mL, Orion Pharma, Turku, Finland) was applied to the area prior to skin incision. A 2–3 cm skin incision was made and a 0.5–1.0 g piece of SAT was removed through the incision, snap frozen in liquid nitrogen and stored in -80°C until RNA extraction. Finally, the skin incision was sutured with interrupted pattern.
RNA extraction and cDNA synthesis
Total RNA was extracted from SAT samples using RNeasy Lipid Tissue Kit (Qiagen GmbH, Hilden, Germany) according to manufacturer’s instructions. The purity of RNA was analyzed by measuring the absorbance at 260 and 280 nm using a NanoDrop ND-1000 spectrophotome-ter (NanoDrop Technologies, Wilmington, Delaware, USA). RNA quality was assessed using RNA integrity number (RIN) on an Agilent Bioanalyzer 2100 chip electrophoresis system with Agilent RNA 6000 Nano Kit (Agilent Technologies, Santa Clara, CA, USA). Total RNA sam-ples from SAT had 260/280 average absorbance ratio 1.9 and average RIN value 5.8. First-strand cDNA was synthesized with Anchored-Oligo (dT)18primer using Transcriptor First Strand cDNA Synthesis Kit (Roche Diagnostics GmbH, Mannheim, Germany) according to manufacturer’s instructions. The cDNA was then diluted (1:4) with DNase/RNase free water.
Primer design and quantitative Real-Time RT-PCR
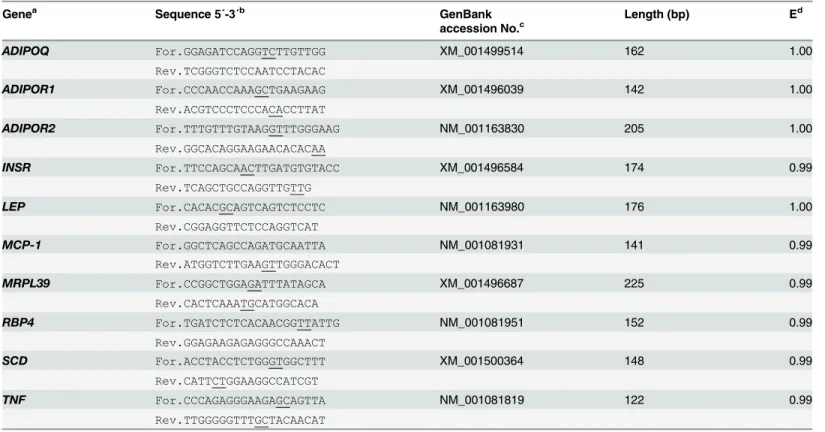
Primers were designed to measure gene expression of the selected genes using the online Prim-er3 software program [29]. Primer sequences were designed to include at least one exon-exon junction. Primer sequences were searched against NCBI database using BLASTN to determine the uniqueness of selected sequences among annotated sequences in the database. Primer se-quences for studied genes and internal control gene are presented inTable 1. The composition of qPCR reactions and the temperature profile of the qPCR were described in Selimet al. [30]. The concentration of primers in qPCR was 5 pmol/μl each for forward and reverse primers
whereas for MCP-1 the concentration was 20 pmol/μl each for forward and reverse primers.
stability was tested for two internal control genes (eukaryotic translation initiation factor 3 sub-unit K and mitochondrial ribosomal protein L39 (MRPL39)) using NormFinder software [31] andMRPL39was selected as internal control gene.MRPL39has been shown to be one of the most stable internal control genes [32,33]. The mRNA abundances ofMRPL39were stable across groups and time points in both SAT. The mRNA abundance was calculated relative to the expression ofMRPL39as an internal control gene; i.e. the calculation of the expression was based on the difference between the Ct values of the target genes and the internal control gene. The mRNA abundance was presented as delta cycle threshold (ΔCt) values (14-ΔCt). Approxi-mate amplification efficiencies (E) were calculated from the amplification curves as described in Selimet al. [30]. Amplification efficiency values for the studied genes and internal control gene are presented inTable 1.
Statistical analysis
Statistical computations were performed using SAS (SAS Institute Inc., Cary, NC, USA, release 9.3). Residuals of all data at both time points were verified for normality and outliers using the Table 1. Studied genes, DNA sequences for forward and reverse primers (5΄-3΄), GenBank accession numbers, the PCR product length and ap-proximate amplification efficiency.
Genea Sequence 5΄-3΄b GenBank Length (bp) Ed
accession No.c
ADIPOQ For.GGAGATCCAGGTCTTGTTGG XM_001499514 162 1.00
Rev.TCGGGTCTCCAATCCTACAC
ADIPOR1 For.CCCAACCAAAGCTGAAGAAG XM_001496039 142 1.00
Rev.ACGTCCCTCCCACACCTTAT
ADIPOR2 For.TTTGTTTGTAAGGTTTGGGAAG NM_001163830 205 1.00
Rev.GGCACAGGAAGAACACACAA
INSR For.TTCCAGCAACTTGATGTGTACC XM_001496584 174 0.99
Rev.TCAGCTGCCAGGTTGTTG
LEP For.CACACGCAGTCAGTCTCCTC NM_001163980 176 1.00
Rev.CGGAGGTTCTCCAGGTCAT
MCP-1 For.GGCTCAGCCAGATGCAATTA NM_001081931 141 0.99
Rev.ATGGTCTTGAAGTTGGGACACT
MRPL39 For.CCGGCTGGAGATTTATAGCA XM_001496687 225 0.99
Rev.CACTCAAATGCATGGCACA
RBP4 For.TGATCTCTCACAACGGTTATTG NM_001081951 152 0.99
Rev.GGAGAAGAGAGGGCCAAACT
SCD For.ACCTACCTCTGGGTGGCTTT XM_001500364 148 0.99
Rev.CATTCTGGAAGGCCATCGT
TNF For.CCCAGAGGGAAGAGCAGTTA NM_001081819 122 0.99
Rev.TTGGGGGTTTGCTACAACAT
aADIPOQ
, adiponectin;ADIPOR1, adiponectin receptor 1;ADIPOR2, adiponectin receptor 2;INSR, insulin receptor;LEP, leptin;MCP-1, monocyte chemoattractant protein-1;MRPL39, mitochondrial ribosomal protein L39;RBP4, retinol binding protein 4;SCD, stearoyl CoA desaturase;TNF, tumour necrosis factor-alpha.
b
For, forward; Rev, reverse; exon-exon junctions are underlined. c
GenBank accession numbers are from the databases of the National Center for Biotechnology Information; all sequences were derived from horse (Equus caballus).
d
E, approximate amplification efficiency for each gene calculated from amplification curves as described by Selim et al. [30].
MIXED and UNIVARIATE procedures of SAS. In this analysis, the statistical model included a fixed effect of treatment, and a random effect of pair. Gene expression data were
log2-transformed to create a normal distribution of data. If data were not normally distributed after log2-transformation, data points with highest studentized residuals (>3) were considered
outliers. The numbers of observations, which were considered outliers and excluded were two in tailhead (ADIPOR2) and three in neck (leptin andADIPOR1) SAT gene expressions.
Final data were analyzed using the MIXED procedure of SAS with a model that included a fixed effect of treatment and a random effect of pair. May values were used as covariates when analyzing September data. Covariate was removed from the model, if the effect was not statisti-cally significant (P>0.10). Friedman’s non-parametric test was used to investigate
group-related differences in body condition scores. Changes over time were analyzed using a model that included fixed effects of treatment, time, and the interaction between treatment and time, and a random effect of pair. Differences between Si categories were assessed using model that included fixed effect of Si group, using merged IVGTT data. Significance was declared at
P<0.05and trend at0.05P<0.10. Spearman rank correlation coefficients were calculated
for all data using GraphPad Prism 5 software (GraphPad Software, Inc., La Jolla, CA, USA) to identify significant (P<0.05) correlations.
Results
Body measurements
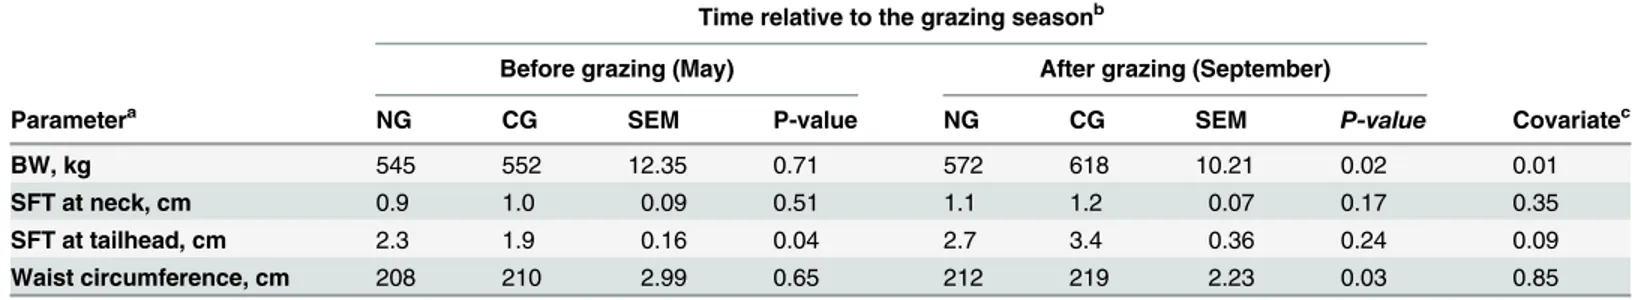
Results of body measurements have been previously presented in Särkijärviet al. [21] for the 22 horses in the trial. The results of body measurements for the sub-group of 16 horses used in the gene expression profiling and IVGTT were mostly similar to Särkijärviet al. [21] and are presented inTable 2. In May, there were no significant differences between the groups for BW, BCS (median 5.5 vs. 6, interquartile ranges (IQR) were 1 vs. 0.25 for CG and NG, respectively;
P = 0.35) or waist circumference (P = 0.65). In September, the CG group had a higher BW (P = 0.02) and larger waist circumference (P = 0.03) compared to NG. The CG group had higher (P = 0.05) median BCS (7, IQR = 0.25) than the NG mares (5.4, IQR = 0.43) after the grazing season. There was no difference between the groups in neck fat thickness before or after grazing (P>0.10). However, CG mares had a smaller tailhead fat thickness compared to
NG mares in May (P = 0.04), but this difference disappeared in September. Higher waist cir-cumference and fat thickness of neck and tailhead were observed for all mares in September compared to May (P<0.05).
Response to IVGTT
(2 CG mares in May and 1 NG mare in September) did not develop hyperinsulinemia during IVGTT (reference range less than 20μIU/ml).
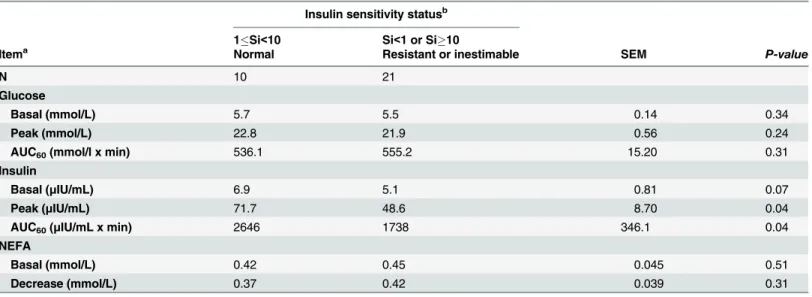
Results of minimal model analysis based on Si classification are shown inTable 4. Si esti-mates were classified as normal in 10 tests out of total number of 31 individual IVGTT, and in 21 tests Si estimates suggested severe insulin resistance or showed problems in estimability. In the tests categorized as normal, horses tended to have higher basal insulin concentration (P = 0.07), had higher peak insulin concentration (P = 0.04) and greater insulin AUC during Table 2. Effect of pasture type on body measurements of Finnhorse mares.
Time relative to the grazing seasonb
Before grazing (May) After grazing (September)
Parametera NG CG SEM P-value NG CG SEM P-value Covariatec
BW, kg 545 552 12.35 0.71 572 618 10.21 0.02 0.01
SFT at neck, cm 0.9 1.0 0.09 0.51 1.1 1.2 0.07 0.17 0.35
SFT at tailhead, cm 2.3 1.9 0.16 0.04 2.7 3.4 0.36 0.24 0.09
Waist circumference, cm 208 210 2.99 0.65 212 219 2.23 0.03 0.85
aSFT, subcutaneous fat thickness.
bFinnhorse mares were grazing either on cultivated high-yielding pasture (CG) or semi-natural grassland (NG) from the end of May to the beginning of September.
cCovariate (May) was removed from the model, if the effect was not statistically signi
ficant (P>0.10).
doi:10.1371/journal.pone.0125968.t002
Table 3. Plasma glucose, insulin and NEFA response to i.v. glucose tolerance test (IVGTT, 0.3 g of glucose i.v. /kg of BW) of Finnhorse mares be-fore and after the grazing season.
Time relative to the grazing seasonb
Before grazing (May) After grazing (September)
Itema NG CG SEM P-value NG CG SEM P-value Covariatec
Glucose
Basal (mmol/L) 5.8 5.3 0.08 0.01 5.8 5.4 0.14 0.04 NS
Peak (mmol/L) 22.2 22.2 0.78 0.97 22.6 21.7 0.45 0.19 0.07
CR180(%/min) 0.79 0.81 0.06 0.72 0.72 0.81 0.04 0.03 NS
AUC180(mmol/L x min) 895.3 878.0 44.35 0.79 927.0 902.8 50.21 0.70 NS
Insulin
Basal (μIU/mL) 5.1 4.9 1.02 0.88 5.5 7.3 0.59 0.07 0.01
Peak (μIU/mL) 48.0 54.9 8.77 0.60 47.1 76.9 9.89 0.08 0.05
AUC180(μIU/mL x min) 4,869 6,431 1,052 0.33 4,698 7,465 1,107 0.13 0.06
NEFA
Basal (mmol/L) 0.41 0.41 0.05 0.98 0.43 0.52 0.04 0.17 NS
Nadir (mmol/L) 0.05 0.03 0.01 0.26 0.05 0.04 0.01 0.33 0.02
CR180(%/min) 2.06 2.07 0.18 0.96 1.64 2.24 0.15 0.02 NS
AUC180(mmol/L x min) -49.6 -49.7 4.74 0.98 -43.3 -63.5 4.52 0.03 0.06
aBasal, average concentration at 10 and 5 min before IVGTT; CR180, clearance rate during
first 180 min of IVGTT; AUC180, area under the curve during thefirst 180 min of IVGTT; NEFA, non-esterified fatty acids.
bNG, semi-natural grassland group; CG, cultivated high-yielding pasture group. cCovariate (May) was removed from the model, if the effect was not statistically signi
ficant (P>0.10).
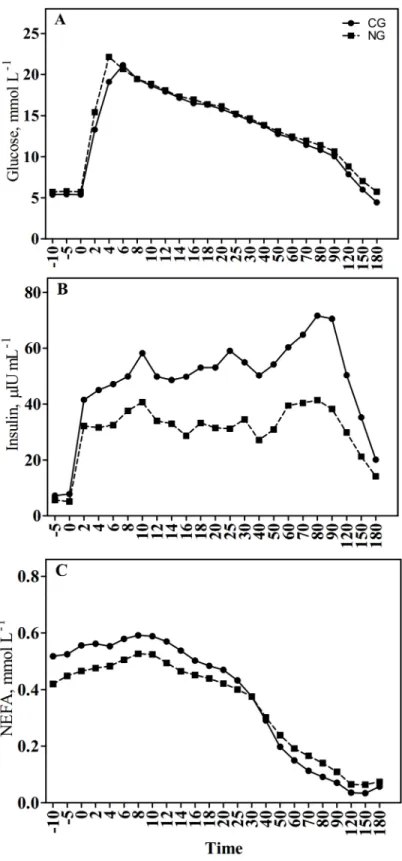
Fig 1. Effect of grazing on cultivated high-yielding pasture (CG) or semi-natural grassland (NG) on plasma glucose (A), insulin (B), and (C) NEFA concentrations after i.v. glucose tolerance test (IVGTT; 0.3 g of glucose/kg of BW).
the first 60 min of IVGTT (P = 0.04) than in the other group. No differences in glucose and NEFA responses were observed.
Gene expression in neck subcutaneous adipose tissue
There were no differences in the gene expression ofADIPOQ,ADIPOR1/2, insulin receptor, leptin,MCP-1,RBP4,SCDorTNFbetween the groups before or after the grazing season (Table 5). The mRNA abundances coding for insulin receptor (P = 0.04),RBP4(P = 0.06), lep-tin (P = 0.004) andMCP-1(P = 0.04) were down-regulated in September compared to May across groups.
Gene expression in tailhead subcutaneous adipose tissue
In May, CG mares had tendencies for lower mRNA abundance ofADIPOQ(P = 0.08), and
ADIPOR2(P = 0.08), and significantly lower mRNA expression ofSCD(P = 0.02) compared to NG, but these differences disappeared in September (Table 6). In addition, up-regulation of
MCP-1mRNA was observed in CG compared to NG before grazing (P = 0.02), but there was no difference inMCP-1mRNA abundance between the groups after grazing (Table 6). Gene expressions ofADIPOR1, insulin receptor, leptin,RBP4orTNFwere not different between the groups (Table 6). We observed down-regulation of insulin receptor (P<0.001),MCP-1
(P<0.001) andRBP4(P = 0.03) in September compared to May in both groups. Up-regulation
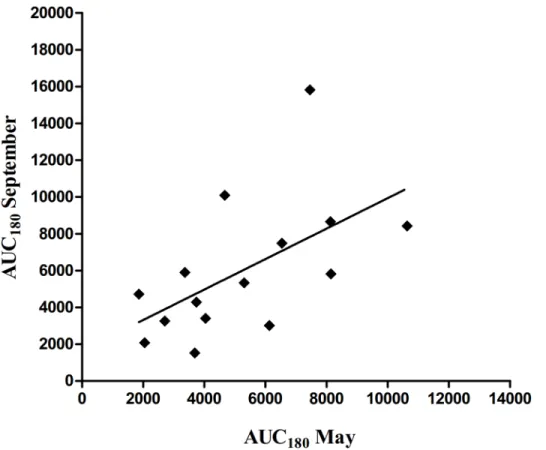
Fig 2. Correlation (r = 0.60,P = 0.02) between insulin area under curve during the 180 min of i.v. glucose tolerance test (IVGTT; 0.3 g of glucose/kg of BW) (AUC180) before and after the grazing
season.
Table 4. Plasma glucose and insulin response during i.v. glucose tolerance test (IVGTT, 0.3 g of glucose i.v. /kg of BW) in different categories of in-sulin sensitivity classification.
Insulin sensitivity statusb 1Si<10 Si<1 or Si10
Itema Normal Resistant or inestimable SEM P-value
N 10 21
Glucose
Basal (mmol/L) 5.7 5.5 0.14 0.34
Peak (mmol/L) 22.8 21.9 0.56 0.24
AUC60(mmol/l x min) 536.1 555.2 15.20 0.31
Insulin
Basal (μIU/mL) 6.9 5.1 0.81 0.07
Peak (μIU/mL) 71.7 48.6 8.70 0.04
AUC60(μIU/mL x min) 2646 1738 346.1 0.04
NEFA
Basal (mmol/L) 0.42 0.45 0.045 0.51
Decrease (mmol/L) 0.37 0.42 0.039 0.31
aBasal, average concentration at 10 and 5 min before IVGTT; AUC180, area under the curve during the
first 180 min of IVGTT; NEFA, non-esterified fatty acids.
bSi, the insulin sensitivity index (× 10-4min-1/
μIU/mL).
doi:10.1371/journal.pone.0125968.t004
Table 5. Relative mRNA abundance of neck subcutaneous adipose tissue genes [Log2(14-ΔCt)] of Finnhorse mares grazed either on cultivated
high-yielding pasture or semi-natural grassland.
Time relative to the grazing seasonb
Before grazing (May) After grazing (September)
Genea NG CG SEM P-value NG CG SEM P-value Covariatec
ADIPOQ 4.09 4.16 0.07 0.52 4.05 4.03 0.13 0.91 0.78
ADIPOR1 3.67 3.74 0.06 0.44 3.70 3.87 0.07 0.14 0.12
ADIPOR2 3.58 3.71 0.07 0.22 3.61 3.72 0.15 0.49 0.85
INSR 4.33 4.25 0.08 0.39 4.20 4.02 0.09 0.23 0.98
LEP 4.10 4.05 0.03 0.23 3.97 3.77 0.09 0.14 0.43
MCP-1 3.76 3.71 0.05 0.20 3.65 3.51 0.10 0.35 0.32
RBP4 3.26 3.51 0.14 0.17 3.02 2.87 0.35 0.75 0.73
SCD 3.75 3.81 0.11 0.71 3.70 4.02 0.19 0.25 0.57
TNF 2.41 2.90 0.21 0.15 2.24 2.31 0.29 0.67 0.70
aADIPOQ, adiponectin;ADIPOR1, adiponectin receptor 1;ADIPOR2, adiponectin receptor 2;INSR, insulin receptor;LEP, leptin;MCP-1, monocyte chemoattractant protein-1;RBP4, retinol binding protein 4;SCD, stearoyl-CoA desaturase;TNF, tumor necrosis factor-alpha.
bNG, semi-natural grassland group; CG, cultivated high-yielding pasture group. cCovariate (May) was removed from the model, if the effect was not statistically signi
ficant (P>0.10).
ofADIPOQ(P = 0.03),ADIPOR1(P = 0.03) andADIPOR2(P = 0.06) was found in September compared to May across the groups.
Correlations between gene expressions and body measurements
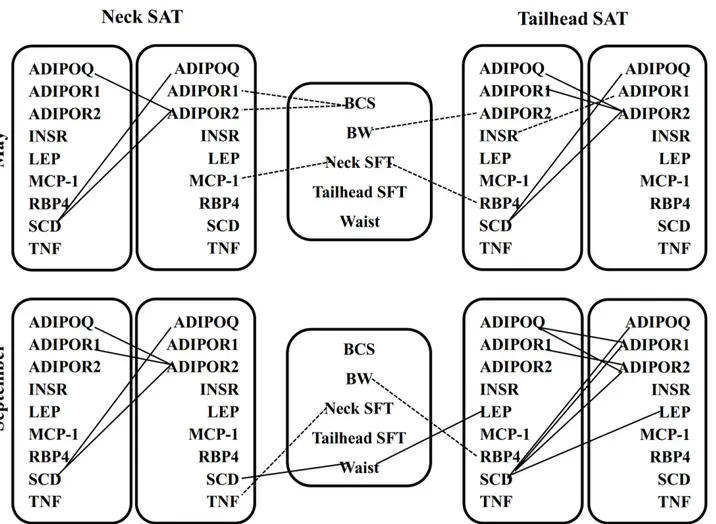
The correlations between gene expression and body measurements are presented inFig 3. The correlations shown had an R-value of>0.50. In May, BCS was negatively correlated with neck
ADIPOR1andADIPOR2mRNA abundance. There was a significant negative relationship be-tween neckMCP-1expression and neck fat thickness. Body weight showed negative correlation with tailheadADIPOR2gene expression. TailheadRBP4mRNA abundance had negative corre-lation with neck fat thickness. In September, waist circumference showed positive correcorre-lations with tailhead leptin and neckSCDmRNA expressions. A significant negative correlation was observed between tailheadRBP4expression and BW. NeckTNFmRNA had a negative correla-tion with neck fat thickness.
Correlations between gene expressions in subcutaneous adipose tissue
The correlations between gene expression in SAT are presented inFig 3and had an R-value of
>0.50. In May,ADIPOQhad a strong positive correlation withADIPOR2mRNA abundance
in both SAT. TailheadADIPOR1andADIPOR2gene expressions were positively correlated with each other. Tailhead insulin receptor gene expression showed negative correlation with tailheadADIPOR1mRNA expression. The mRNA abundance ofSCDshowed a significant positive correlation withADIPOQandADIPOR2in both SAT. In September, a strong positive correlation was observed between tailheadADIPOQandADIPOR1andADIPOR2gene expres-sion. However, neckADIPOQwas positively correlated with neckADIPOR2only. Positive cor-relations were observed betweenADIPOR1andADIPOR2mRNA expressions in both SAT. TailheadSCDmRNA abundance was positively correlated with tailheadADIPOQ,ADIPOR1,
ADIPOR2and leptin gene expression. However, in neck SAT,SCDwas positively correlated withADIPOQandADIPOR2mRNA abundance.
Table 6. Relative mRNA abundance of tailhead subcutaneous adipose tissue genes [Log2(14-ΔCt)] of Finnhorse mares grazed either on cultivated
high-yielding pasture or semi-natural grassland.
Time relative to the grazing seasonb
Before grazing (May) After grazing (September)
Genea NG CG SEM P-value NG CG SEM P-value Covariatec
ADIPOQ 4.20 4.11 0.03 0.08 4.34 4.28 0.09 0.69 0.56
ADIPOR1 3.70 3.72 0.05 0.79 3.92 3.89 0.11 0.90 0.59
ADIPOR2 3.79 3.67 0.04 0.08 3.88 3.90 0.11 0.89 0.24
INSR 4.29 4.33 0.07 0.69 4.04 3.90 0.07 0.18 0.67
LEP 4.00 3.99 0.04 0.87 3.87 3.94 0.06 0.45 0.96
MCP-1 3.63 3.91 0.07 0.02 3.50 3.27 0.10 0.10 0.07
RBP4 3.11 3.01 0.16 0.66 2.80 2.50 0.19 0.24 0.12
SCD 4.02 3.87 0.05 0.02 4.12 4.20 0.13 0.63 0.71
TNF 2.24 2.42 0.19 0.54 1.94 1.84 0.32 0.83 0.96
aADIPOQ, adiponectin;ADIPOR1, adiponectin receptor 1;ADIPOR2, adiponectin receptor 2;INSR, insulin receptor;LEP, leptin;MCP-1, monocyte chemoattractant protein-1;RBP4, retinol binding protein 4;SCD, stearoyl-CoA desaturase;TNF, tumor necrosis factor-alpha.
bNG, semi-natural grassland group; CG, cultivated high-yielding pasture group. cCovariate (May) was removed from the model, if the effect was not statistically signi
ficant (P>0.10).
Discussion
In this study, horses were grazing 98 days on two types of pastures. Horses on CG had in-creased BW, BCS, and waist circumference compared to horses grazing on NG. Previous stud-ies [3,5], utilizing the 9-point BCS scale [24], have described horses with BCS7 as obese. In the current study, median BCS of the CG group was 7 compared to 5.4 in the NG group after the grazing season, suggesting that mares in the CG group were overweight. In addition, the large increase in waist circumference in the CG group in September may indicate that the CG mares might have accumulated more visceral fat than subcutaneous fat during the
grazing season.
Status of insulin resistance
The pasture type had only moderate effects on responses during IVGTT. Horses on CG tended to have higher basal and peak insulin concentrations in September than horses on NG. In-creased glucose clearance rate of CG in September indicates that higher BW and BCS gain did not compromise the ability of these horses to control plasma glucose. However, greater basal Fig 3. Relationships between body measurements and gene expression measurements in subcutaneous neck and tailhead adipose tissue in May and September as revealed by Spearman’s correlation coefficients.The correlations shown had anR>0.50andP<0.05. Solid lines represent positive and dashed lines represent negative correlations. SFT, subcutaneous fat thickness;ADIPOQ, adiponectin;ADIPOR1, adiponectin receptor 1;ADIPOR2, adiponectin receptor 2;INSR, insulin receptor;LEP, leptin;MCP-1, monocyte chemoattractant protein-1;RBP4, retinol binding protein 4;SCD, stearoyl Co-A desaturase;TNF, tumor necrosis factor-alpha.
and peak insulin concentrations might indicate a compensatory insulin secretion in response to decreased insulin sensitivity or responsiveness of peripheral tissues in CG compared to NG. Earlier studies have shown that increased consumption of feeds with high content of non-structural carbohydrates is associated with insulin resistance in the context of obesity [34,35]. However, Suageeet al. [36] showed recently that high glycaemic diet did not alter peripheral insulin sensitivity in horses that had BCS<7.5. Further, Bailey et al. [37] observed that pasture
feeding with grass rich in fructans did not increase insulin resistance of non-obese healthy po-nies, whereas ponies previously predisposed to laminitis developed increased insulin resistance. In the present study, a positive correlation was found between insulin AUC’s before and after the grazing season. This finding together with only moderate effect of pasture type on insulin AUC suggest that in non-obese horses, previous health status or nutritional history may be more important factors affecting insulin function than pasture feeding.
Greater decrease in plasma NEFA during IVGTT in the CG mares, and the lack of differ-ence in basal NEFA concentration, suggest that increased energy intake did not compromise insulin sensitivity/responsiveness of adipose tissue. In obese horses insulin resistance reduces the ability of insulin to inhibit hormone-sensitive lipase, resulting in elevated plasma NEFA concentrations [5]. However, Carteret al. [35] observed that feeding horses for weight-gain over 16 weeks had no effect on plasma NEFA concentrations despite induced obesity, indicat-ing that longer period of insulin resistance may be needed for the development of major changes in lipid metabolism. Suageeet al. [36] observed that meal-induced NEFA suppression was reduced in non-obese horses after only 90 d feeding of high glycemic diet, showing that in-sulin resistance in adipose tissue takes time to develop. In the present study, the differences be-tween groups in energy and carbohydrate intake were probably too moderate to induce major effects on adipose tissue insulin sensitivity, or grazing season was too short to affect lipid me-tabolism of the horses.
An alternative or complementary explanation for the lack of effects of more abundant ener-gy supply from CG could be the initial insulin resistance status of the horses (e.g. horses might have been relatively insulin resistant before the grazing season). Several horses showed blunted insulin response during IVGTT (S1 Fig), suggesting impaired pancreaticβcell response to glu-cose [38]. The individual differences in insulin secretion in response to glucose stimulus were largely retained during the grazing period, as indicated by the positive correlation of insulin AUC during IVGTT in May and September. Furthermore, based on the Si classification results, a large proportion of horses was either insulin resistant or had implausible Si estimates, and these horses had lower insulin response during IVGTT (Table 4).
Previously minimal model analysis of frequently sampled IVGTT has been successfully used in horses [38–39]. Treiber et al. [40] reported that the lowest quintile of Si estimates was 0.14–0.78 x 10⁻⁴/mU/L/min in healthy Thoroughbred horses, whereas highest quintile was 3.05–5.94 x 10⁻⁴/mU/L/min. On the other hand, the study by Bamford et al. [41] demonstrated breed-related differences in the insulin responses of horses and ponies to intravenous glucose test, showing that Andalusians were relatively insulin resistant, having mean Si of 0.99 x 10⁻⁴/ mU/L/min, whereas in Standardbred horses mean Si was 5.43 x 10⁻⁴/mU/L/min. Based on these previous studies, classifying Si below 1 as insulin resistant seems justified, whereas Si over 10 x 10-4/mU/L/min would represent extreme insulin sensitivity. It is likely that these extreme values of Si were also contributed by the limited pancreatic capacity to secrete insulin in re-sponse to glucose stimulation. However, based on the current approach, IVGTT without exog-enous insulin, it is not possible to judge between the above-mentioned alternatives.
insulin was not injected during the test [39]. The current results emphasize the importance of applying exogenous insulin during IVGTT, if minimal model is used in the analysis of glucose-insulin dynamics in horses with a relatively high degree of glucose-insulin resistance.
Gene expression in adipose tissue
Adipose tissue constitutes a dynamic endocrine organ, secreting hormones and inflammatory mediators which have been involved in the inflammatory response and insulin resistance in dogs, cats, and horses [42]. Adiponectin has been shown to modulate fatty acid metabolism and energy homeostasis [43]. Previous studies in horses by Kearnset al. [17] and Gordonet al. [44] showed that circulating ADIPOQ was negatively correlated with fat mass, percent body fat and BCS. In the current study, negative correlations between neckADIPOQreceptors and BCS were detected in May but not in September. Tsuchidaet al. [45] reported that in mice, the expression ofADIPOR1/2 was correlated with ADIPOQ sensitivity. Therefore, the observed positive correlations betweenADIPOQand its receptors in the current study suggest a synchro-nous regulation ofADIPOQand its receptors at transcriptional level. In addition, up-regulation ofADIPOQand its receptors in tailhead SAT but not in neck SAT in September compared to May was observed across treatments. Fuet al. [46] found thatADIPOQexpression promotes proliferation and differentiation of adipocytes, and enhances insulin sensitivity and lipid accu-mulation in mature adipocytes. A recent study in horses by Bruynsteenet al. [33] suggested that SAT (loin and tailhead) is more stimulated to differentiate pre-adipocytes into adipocytes than other adipose tissue depots. Our results may indicate that insulin sensitivity, and differen-tiation and accumulation of adipocytes were more enhanced in tailhead SAT than in neck SAT.
We detected down-regulation in the mRNA abundance of insulin receptor in September compared to May in both groups. Increased basal insulin concentrations during the grazing season (P = 0.16), reduced insulin receptor gene expression in SAT which could possibly indi-cate a negative feedback mechanism of insulin on the insulin signaling pathway in SAT [16]. Basal blood samples were collected after fasting which may mask the potential time effect on insulin concentration. Suageeet al. [16] found that a six-h insulin infusion to insulin sensitive horses decreased insulin receptor transcript abundance in adipose tissue but did not affect its protein expression. A recent study by de Laat et al. [47] reported a reduction in insulin receptor gene expression in lamellar tissue of horses during the development (24 h) and acute (46 h) stages of insulin-induced laminitis compared to control horses. In the current study, the ob-served higher insulin concentration in CG was not large enough to induce significant effect on the mRNA expression of insulin receptor.
Gene expression ofSCDin both neck and tailhead SAT was not different between treat-ments in September. However, time effect was observed in tailhead SAT characterized by a higher mRNA abundance in September compared to May. Stearoyl-CoA desaturase is the rate-limiting enzyme for fat accumulation in adipose tissue, converting saturated fatty acids into monounsaturated fatty acids [48]. The expression ofSCDwas increased in tailhead but not in neck SAT during the grazing season. This was in line with greater fat thickness in tailhead com-pared to neck, and thus lipogenesis may differ among fat depots. The strong positive correla-tion betweenSCDandADIPOQand its receptors suggests thatADIPOQandSCDin horses, as well as in humans [20], may be closely linked through a selective mechanism in adipose tissue regarding lipogenesis and potentiation ofADIPOQsignalling. However, the link between the regulation of SCD and insulin sensitivity in equine is unclear.
weight reduction program, but there were no differences in the mRNA expression ofRBP4in tailhead SAT between insulin sensitive and insulin resistant ponies. Ungruet al. [13] stated that serum RBP4 was closely linked to adiposity probably independently of insulin resistance.
A significant down-regulation ofMCP-1in both neck and tailhead SAT during the grazing season suggests that the regulation ofMCP-1in SAT of horses may not be tightly linked to the state of fat reserves. Alternatively, the significant effect of fattening in the mRNA expression of
MCP-1may not be observed until the onset of obesity or following a prolonged period of obesi-ty. Our results were in line with Burnset al. [12] who observed that theMCP-1mRNA abun-dance was not related to insulin sensitivity status, andMCP-1expression was not different across adipose tissue depots in non-obese or over-conditioned horses.
We observed down-regulation of leptin mRNA in neck SAT across the groups in September compared to May. Fitzgerald and McManus [49] reported an increase in the average blood concentration of leptin in young and mature Thoroughbred mares from July to September. Ungruet al. [13] observed a significant reduction in serum leptin after body weight reduction in obese insulin resistant ponies. Gentryet al. [50] reported that other factors than body fat mass determine the relative levels of leptin production and secretion (low vs. high) in light horse mares under conditions of BCS between 6.5 and 8. The seasonal rise of circulating leptin in late summer and autumn compared to winter may not be entirely dependent on body fat mass [49,50], and other factors such as environmental influences and seasonal reproductive activity may be involved. In the current study, the down-regulation of neck leptin, with no dif-ference in tailhead leptin gene expression, during the grazing season suggests that seasonal changes of leptin gene expression in SAT of Finnhorse mares may be regulated by other factors than body fat mass. In line with this, we did not find any correlation between leptin mRNA abundance and BW, BCS or subcutaneous fat thickness.
Franket al. [51] and McFarlaneet al. [52] have shown that the concentrations of ACTH and alpha-melanocyte stimulating hormone (α-MSH) in plasma are highest in the autumn (August-October) in horses. This adaptation helps the animals to prepare themselves for the metabolic and nutritional demands during the winter [53]. Alpha-melanocyte stimulating hor-mone plays a role in energy metabolism and has anti-inflammatory effects that involve decreas-ing the production of cytokines and other factors contributdecreas-ing to inflammation [54]. Based on these previous studies, we suggest that the observed down-regulation of leptin,RBP4and
MCP-1gene expression in September compared to May might reflect a seasonal adaptation of horses to the winter season.
We did not detect any treatment- or time-related differences in the mRNA abundance of
Gileset al. [1] and Johnsonet al. [57] have shown that certain native breeds are more at risk of becoming obese. This can be explained by adaptation to the seasonality of ancestral environ-ments of native breeds. Obese body condition at the end of summer can be viewed as a natural survival strategy for poorer feed quality and inescapable weight loss during winter months. Our hypothesis was that Finnhorse is a high-risk breed that develop obesity and obesity-associated metabolic diseases if horses have unrestricted access to cultivated high-yielding pas-ture. However, based on our results, we suggest that Finnhorses became overweight or moder-ately obese at the end of summer, but they stayed healthy without signs of obesity-associated metabolic diseases.
Conclusions
We conclude that fattening associated with grazing on cultivated high-yielding pasture induced moderate changes in glucose, insulin and NEFA responses during IVGTT but did not compro-mise the ability of the horses to control plasma glucose concentrations and adipose tissue lipol-ysis. Significant temporal differences in the gene expression profiles during the grazing season were observed. Based on the subcutaneous neck and tailhead adipose tissue gene expressions, the BCS and weight gain during the grazing season were not associated with increased insulin resistance. These findings support the hypothesis that obesity and severe hyperinsulinemia are required to produce alterations in insulin resistance status in equine. Finally, our results indi-cate that grazing on cultivated high-yielding pasture does not increase the risk for metabolic diseases in Finnhorse mares that have normal BCS at the beginning of the grazing season.
Supporting Information
S1 Fig. Individual’s insulin response (μIU/mL) to i.v. glucose tolerance test (IVGTT; 0.3 g
of glucose/kg of BW) before and after the grazing season.NG, semi-natural grassland group; CG, cultivated high-yielding pasture group.
(TIF)
Acknowledgments
The authors gratefully appreciate the assistance of the staff at Natural Resources Institute Fin-land (former: MTT Agrifood Research FinFin-land) and The Equine College of Ypäjä for the care of experimental animals, and that of the laboratory staff of the Department of Agricultural Sci-ences, University of Helsinki. The help of Petri Auvinen and Eeva-Marja Turkki in DNA Se-quencing and Genomics Laboratory of the Institute of Biotechnology is greatly appreciated.
Author Contributions
Conceived and designed the experiments: KE SJ S. Särkijärvi MS TK. Performed the experi-ments: S. Selim KE SJ NK TR S. Särkijärvi MS TK. Analyzed the data: S. Selim KE RB TK. Con-tributed reagents/materials/analysis tools: NK RB TR. Wrote the paper: S. Selim TK. Designed the software used in analysis: RB.
References
1. Giles SL, Rands SA, Nicol CJ, Harris PA (2014) Obesity prevalence and associated risk factors in out-door living domestic horses and ponies. PeerJ 2, e299. doi:10.7717/peerj.299PMID:24711963
3. Vick MM, Adams AA, Murphy BA, Sessions DR, Horohov DW, Cook RF, et al. (2007) Relationships among inflammatory cytokines, obesity, and insulin sensitivity in the horse. J Anim Sci 85, 1144–1155. PMID:17264235
4. Vick MM, Murphy BA, Sessions DR, Reedy SE, Kennedy EL, Horohov DW, et al. (2008) Effects of sys-temic inflammation on insulin sensitivity in horses and inflammatory cytokine expression in adipose tis-sue. Am J Vet Res 69, 130–139. doi:10.2460/ajvr.69.1.130PMID:18167098
5. Frank N, Elliott SB, Brandt LE (2006) Physical characteristics, blood hormone concentrations, and plas-ma lipid concentrations in obese insulin resistant horses. J Am Vet Med Assoc 228, 1383–1390. PMID: 16649943
6. Geor RJ, Harris P (2009) Dietary management of obesity and insulin resistance: countering risk for lam-initis. Vet Clin North Am Equine Pract 25, 51–65. doi:10.1016/j.cveq.2009.02.001PMID:19303550
7. Treiber KH, Kronfeld DS, Hess TM, Byrd BM, Splan RK, Staniar WB (2006) Evaluation of genetic and metabolic predispositions and nutritional risk factors for pasture-associated laminitis in ponies. J Am Vet Med Assoc 228, 1538–1545. PMID:16677122
8. Carter RA, Treiber KH, Geor RJ, Douglass L, Harris PA (2009) Prediction of incipient pasture-associated laminitis from hyperinsulinaemia, hyperleptinaemia and generalised and localised obesity in a cohort of ponies. Equine Vet J 41, 171–178. PMID:19418747
9. Asplin KE, Sillence MN, Pollitt CC, McGowan CM (2007) Induction of laminitis by prolonged hyperinsuli-nemia in clinically normal ponies. Vet J 174, 530–535. PMID:17719811
10. de Laat MA, McGowan CM, Sillence MN, Pollitt CC (2010) Equine laminitis: induced by 48 h hyperinsu-linaemia in Standardbred horses. Equine Vet J 42, 129–135. doi:10.2746/042516409X475779PMID: 20156248
11. Carter RA (2008) Equine obesity and its role in insulin resistance, inflammation and risk for laminitis. PhD thesis, Faculty of Virginia Polytechnic Institute and State Univeristy, Blacksburg. Available:http:// scholar.lib.vt.edu/theses/available/etd-07242008-093620/unrestricted/Carter_PhD_Dissertation_final. pdf.
12. Burns TA, Geor RJ, Mudge MC, McCutcheon LJ, Hinchcliff KW, Belknap JK. (2010) Proinflammatory cytokine and chemokine gene expression profiles in subcutaneous and visceral adipose tissue depots of insulin-resistant and insulin-sensitive light breed horses. J Vet Intern Med 24, 932–939. doi:10. 1111/j.1939-1676.2010.0551.xPMID:20649750
13. Ungru J, Blüher M, Coenen M, Raila J, Boston R, Vervuert I(2012) Effects of body weight reduction on blood adipokines and subcutaneous adipose tissue adipokine mRNA expression profiles in obese po-nies. Vet Rec 24, 528.
14. Weisberg SP, McCann D, Desai M, Rosenbaum M, Leibel RL, Ferrante AW Jr(2003) Obesity is associ-ated with macrophage accumulation in adipose tissue. J Clin Invest 112, 1796–1808. PMID:14679176
15. Hotamisligil GS, Peraldi P, Budavari A, Ellis R, White MF, Spiegelman BM (1996) IRS-1-mediated inhi-bition of insulin receptor tyrosine kinase activity in TNF-alpha- and obesity-induced insulin resistance. Science 271, 665–668. PMID:8571133
16. Suagee JK, Corl BA, Hulver MW, McCutcheon LJ, Geor RJ (2011) Effects of hyperinsulinemia on glucose and lipid transporter expression in insulin-sensitive horses. Domest Anim Endocrinol 40, 173–181. doi:10.1016/j.domaniend.2010.11.002PMID:21292427
17. Kearns CF, Mckeever KH, Roegner V, Brady SM, Malinowski K (2006) Adiponectin and leptin are relat-ed to fat mass in horses. Vet J 172, 460–465. PMID:15996495
18. Dobrzyn P, Jazurek M, Dobrzyn A (2010) Stearoyl-CoA desaturase and insulin signaling—what is the molecular switch? Biochim Biophys Acta 1797, 1189–1194. doi:10.1016/j.bbabio.2010.02.007PMID: 20153289
19. Ntambi JM, Miyazaki M, Stoehr JP, Lan H, Kendziorski CM, Yandell BS, et al. (2002) Loss of stearoyl-CoA desaturase-1 function protects mice against adiposity. Proc Natl Acad Sci U S A 99, 11482– 11486. PMID:12177411
20. Yao-Borengasser A, Rassouli N, Varma V, Bodles AM, Rasouli N, Unal R, et al. (2008) Stearoyl-coenzyme A desaturase 1 gene expression increases after pioglitazone treatment and is associated with peroxisomal proliferator-activated receptor-gamma responsiveness. J Clin Endocrinol Metab 93, 4431–4439. doi:10.1210/jc.2008-0782PMID:18697866
21. Särkijärvi S, Reilas T, Saastamoinen M, Elo K, Jaakkola S, Kokkonen T (2012) Effect of cultivated or semi-natural pasture on changes in live weight, body condition score, body measurements and fat thickness in grazing Finnhorse mares. In: Saastamoinen M, Fradinho MJ, Santos AS, Miraglia N, edi-tors, Forages and Grazing in Horse Nutrition. EAAP Scientific Series, 132, 231–234.
changing world, Schnyder H, Isselstein J, Taube F, Auerswald K, Schellberg J, Wachendorf M, Herr-mann A, Gierus M, Wrage N, Hopkins A, editors, In Proceedings of 23thGeneral Meeting of the Europe-an GrasslEurope-and Federation, August 29th—September 2nd, Kiel, Germany, 15, 1000–1002.
23. Särkijärvi S, Niemeläinen O, Sormunen-Cristian R, Saastamoinen M (2012) Changes in chemical com-position of different grass species and-mixtures in equine pasture during grazing season. In: Forages and Grazing in Horse Nutrition, Saastamoinen M, Fradinho MJ, Santos AS, Miraglia N, editors. EAAP Scientific Series, Wageningen Academic Publication, Netherland, 132, 45–48,
24. Henneke DR, Potter GD, Kreider JL, Yeates BF (1983) Relationship between condition score, physical measurements and body fat percentage in mares. Equine Vet J 15, 371–372. PMID:6641685
25. Carter RA, Geor RJ, Staniar WB, Cubitt TA, Harris PA (2009) Apparent adiposity assessed by standardised scoring systems and morphometrics measurements in horses and ponies. Vet J 179, 204–210. doi:10.1016/j.tvjl.2008.02.029PMID:18440844
26. Salin S, Taponen J, Elo K, Simpura I, Vanhatalo A, Kokkonen T (2012) Effects of abomasal infusion of tallow or camelina oil on responses to glucose and insulin in dairy cows during late pregnancy. J Dairy Sci 95, 3812–3825. doi:10.3168/jds.2011-5206PMID:22720937
27. Shiang KH (2004) The SAS1
calculations of areas under the curve (AUC) for multiple metabolic read-ings. Western users of SAS Software presentation, Pasadena. Available:http://www.lexjansen.com/ wuss/2004/posters/c_post_the_sas_calculations_.pdf. Accessed 20 February 2010.
28. Boston RC, Stefanovski D, Moate PJ, Sumner AE, Watanabe RM, Bergman RN (2003) MINMOD Mil-lennium: A computer program to calculate glucose effectiveness and insulin sensitivity from the fre-quently sampled intravenous glucose tolerance test. Diabetes Technol Ther 5, 1003–1015. PMID: 14709204
29. Rozen S, Skaletzky H (2000) Primer3 on the WWW for general users and for biologist programmers. In: Bioinformatics Methods and Protocols, Methods in Molecular Biology Series, Krawetz S, Misener S, ed-itors. Humana press Inc., Totowa, NJ. 132, 365–386.
30. Selim S, Salin S, Taponen J, Vanhatalo A, Kokkonen T, Elo K (2014) Prepartal dietary energy alters transcriptional adaptations of the liver and subcutaneous adipose tissue of dairy cows during the transi-tion period. Physiol Genomics 46, 328–337. doi:10.1152/physiolgenomics.00115.2013PMID: 24569674
31. Andersen CL, Jensen JL,Ørntoft TF (2004) Normalization of real-time quantitative reverse transcrip-tion-PCR data: a model-based variance estimation approach to identify genes suited for normalization, applied to bladder and colon cancer data sets. Cancer Res 64, 5245–5250. PMID:15289330
32. Kadegowda AK, Bionaz M, Thering B, Piperova LS, Erdman RA, Loor JJ (2009) Identification of internal control genes for quantitative polymerase chain reaction in mammary tissue of lactating cows receiving lipid supplements. J Dairy Sci 92, 2007–2019. doi:10.3168/jds.2008-1655PMID:19389958
33. Bruynsteen L, Erkens T, Peelman LJ, Ducatelle R, Janssens GPJ, Harris PA, et al. (2013) Expression of inflammation-related genes is associated with adipose tissue location in horses. BMC Vet Res 9, 240. doi:10.1186/1746-6148-9-240PMID:24295090
34. Quinn RW, Burk AO, Hartsock TG, Petersen ED, Whitley NC, Treiber KH, et al. (2008) Insulin sensitivity in Thoroughbred geldings: effect of weight gain, diet, and exercise on insulin sensitivity in Thorough-bred geldings. J Equine Vet Sci 28, 728–738.
35. Carter RA, McCutcheon LJ, George LA, Smith TL, Frank N, Geor RJ (2009) Effects of diet induced weight gain on insulin sensitivity and plasma hormone and lipid concentrations in horses. Am J Vet Res 70, 1250–1258. doi:10.2460/ajvr.70.10.1250PMID:19795940
36. Suagee JK, Corl BA, Swyers KL, Smith TL, Flinn CD, Geor RJ (2013) A 90-day adaptation to a high gly-caemic diet alters postprandial lipid metabolism in non-obese horses without affecting peripheral insulin sensitivity. J Anim Physiol Anim Nutr (Berl) 97, 245–254. doi:10.1111/j.1439-0396.2011.01261.x PMID:22129443
37. Bailey SR, Menzies-Gow NJ, Harris PA, Habershon-Butcher JL, Crawford C, Berhane Y, et al. 2007. Effect of dietary fructans and dexamethasone administration on the insulin response of ponies predis-posed to laminitis. J Am Vet Med Assoc 231, 1365–1373. PMID:17975996
38. Firshman AM, Valberg SJ (2007) Factors affecting clinical assessment of insulin sensitivity in horses. Equine vet J 39, 567–575. PMID:18065318
39. Kronfeld DS, Treiber KH, Geor RJ (2005) Comparison of nonspecific indications and quantitative meth-ods for the assessment of insulin resistance in horses and ponies. J Am Vet Med Ass 226, 712–719. PMID:15776943
41. Bamford NJ, Potter SJ, Harris PA, Bailey SR (2014) Breed differences in insulin sensitivity and insuline-mic responses to oral glucose in horses and ponies of moderate body condition score. Domest Anim Endocrinol 47, 101–107. doi:10.1016/j.domaniend.2013.11.001PMID:24308928
42. Radin MJ, Sharkey LC, Holycross BJ (2009) Adipokines: a review of biological and analytical principles and an update in dogs, cats, and horses. Vet Clin Pathol 38, 136–156. doi:10.1111/j.1939-165X.2009. 00133.xPMID:19392760
43. Kadowaki T, Yamauchi T (2005) Adiponectin and adiponectin receptors. Endocr Rev 26, 439–451. PMID:15897298
44. Gordon ME, McKeever KH, Betros CL, Manso Filho HC (2007) Plasma leptin, ghrelin and adiponectin concentrations in young fit racehorses versus mature unfit Standardbreds. Vet J 173, 91–100. PMID: 16377220
45. Tsuchida A, Yamauchi T, Ito Y, Hada Y, Maki T, Takekawa S, et al. (2004) Insulin/Foxo1 pathway regu-lates expression levels of adiponectin receptors and adiponectin sensitivity. J Biol Chem 279, 30817– 30822. PMID:15123605
46. Fu Y, Luo N, Klein RL, Garvey WT (2005) Adiponectin promotes adipocyte differentiation, insulin sensi-tivity, and lipid accumulation. J Lipid Res 46, 1369–1379. PMID:15834118
47. de Laat MA, Pollitt CC, Kyaw-Tanner MT, McGowan CM, Sillence MN (2013) A potential role for lamel-lar insulin-like growth factor-1 receptor in the pathogenesis of hyperinsulinaemic laminitis. Vet J 197, 302–306 doi:10.1016/j.tvjl.2012.12.026PMID:23394844
48. Ntambi JM, Miyazaki M (2004) Regulation of stearoyl-CoA desaturases and role in metabolism. Prog Lipid Res 43, 91–104. PMID:14654089
49. Fitzgerald BP, McManus CJ (2000) Photoperiodic versus metabolic signals as determinants of season-al anestrus in the mare. Biol Reprod 63, 335–340. PMID:10859276
50. Gentry LR, Thompson DL, Gentry GT Jr, Davis KA Jr, Godke RA, Cartmill JA (2002) The relationship between body condition, leptin, and reproductive and hormonal characteristics of mares during the sea-sonal anovulatory period. J Anim Sci 80, 2695–2703. PMID:12413093
51. Frank N, Elliott SB, Chameroy KA, Tóth F, Chumbler NS, McClamroch R (2010) Association of season and pasture grazing with blood hormone and metabolite concentrations in horses with presumed pitui-tary pars intermedia dysfunction. J Vet Intern Med 24, 1167–1175. doi:10.1111/j.1939-1676.2010. 0547.xPMID:20666984
52. McFarlane D, Donaldson MT, McDonnell SM, Cribb AE (2004) Effects of season and sample handling on measurement of plasma alpha-melanocyte-stimulating hormone concentrations in horses and po-nies. Am J Vet Res 65, 1463–1468. PMID:15566081
53. Schuhler S, Ebling FJ (2006) Role of melanocortin in the long-term regulation of energy balance: les-sons from a seasonal model. Peptides 27, 301–309. PMID:16269204
54. Lipton JM, Catania A (1997) Anti-inflammatory actions of the neuroimmunomodulator alpha-MSH. Immunol Today 18, 140–145. PMID:9078687
55. Treiber K, Carter R, Gay L, Williams C, Geor R (2009) Inflammatory and redox status of ponies with a history of pasture-associated laminitis. Vet Immunol Immunopathol 129, 216–220. doi:10.1016/j. vetimm.2008.11.004PMID:19108899
56. Saleri R, Sabbioni A, Vecchi I, Davighi I, Vaccari Simonini F, Superchi P (2011) Peripheral cytokine expression in Standardbred mares at different adiposity during the periparturient period. Animal 5, 1938–1943. doi:10.1017/S175173111100084XPMID:22440470
![Table 6. Relative mRNA abundance of tailhead subcutaneous adipose tissue genes [Log 2 (14-ΔCt)] of Finnhorse mares grazed either on cultivated high-yielding pasture or semi-natural grassland.](https://thumb-eu.123doks.com/thumbv2/123dok_br/18294371.346973/12.918.55.869.151.395/relative-abundance-tailhead-subcutaneous-finnhorse-cultivated-yielding-grassland.webp)