RAAE
REGULAR ARTICLE
URBAN FRESHWATER USERS’ WILLINGNESS TO PAY FOR UPLAND DEGRADED
WATERSHED MANAGEMENT: THE CASE OF DECHATU IN DIRE DAWA
ADMINISTRATION, ETHIOPIA
Alem MEZGEBO*, Endrias GETA, Fresenbet ZELEKE
Address:
Haramaya University College of Agriculture and Environmental Science, School of Agricultural Economics and Agribusiness, Dire Dawa, Ethiopia
*Corresponding author: adeway12@gmail.com
ABSTRACT
The study assesses urban freshwater users’ perception of watershed degradation and users' willingness to pay for upland degraded watershed management. Cross sectional data was collected from 282 urban freshwater users. A number of causes and effects of watershed degradation and water supply problems are identified. Economic instruments and mechanisms are also identified as the basis of charging and collecting the fee for watershed management, respectively. Besides, contingent valuation result shows that about 82 percent of the respondents were willing to pay for upland degraded watershed management. The mean willingness to pay from the spike model was computed to be 97 Ethiopian birr (ETB) per annum for five years whereas the mean willingness to pay from the open-ended elicitation method was computed 70 ETB per year. Urban freshwater user willingness to pay is affected by total income, initial bids, marital status, ownership of house and educational levels. The study recommends that any watershed management activities need to consider the socio-economic variables of the affected respondents. Besides, it is worthy to consider the demand of the urban dweller (downstream users) for any upland degraded watershed management.
Keywords: degraded watershed management; urban freshwater users; willingness to pay
JEL: Q00, Q20, Q50, Q57, Q59
INTRODUCTION
A watershed is a total land area that is drained to some point on a stream or river. It is an area of land that captures rainfall and other precipitation where all of the water that falls in it ends up in common outlet (Sheng, 1990; Achouri, 2002; Swallow et al., 2002; Lakew et.al 2005; Postel and Thompson, 2005; Wani et al., 2008). The size of watershed can be a few square kilometers or thousand square kilometers (Sheng, 1990). Watershed includes people, their farming system and interactions with their land resources, management strategies, social, economic and cultural aspects (Lakew et.al, 2005). All watersheds contain many kinds of natural resources such as soil, water, forest, rangeland, wildlife, minerals, etc (Sheng, 1990). They are very important for providing clean water, purification of freshwater, recreational opportunities and tourism (Hajkowicz and Okotai, 2005; Postel and Thompson, 2005). Watersheds help to mitigate climatic change and protect biodiversity. However, the 2005 Millennium Ecosystem Assessment concludes that globally, 60 percent of all ecosystem services (like watershed services) are currently being degraded and used unsustainably. Watershed degradation is the loss of health, productive potential of land and water over time (Sheng, 1990; Aglanu, 2014).
Reduced economic opportunities and increased social problems are the effects of watershed degradation. The degradation was considered as the greatest constraint
to sustainable development in most of the developing countries (Sheng, 1990). Currently, there has been a growing concern by policy makers, interest groups and the public in pursuing degraded watershed management. In order to properly manage watershed services reliable information on the economic value of upland degraded watershed management is very crucial. However, in Ethiopia as well as in the study area no attempt was made to estimate the economic value of degraded upland watershed management using contingent valuation method. This study therefore, tried to estimate the economic value of Dechatu watershed management. The level of awareness of urban freshwater users’ about the causes and effects of watershed degradation were also assessed. The result of this study will be used for policy planning and improving the socio-economic, environment and well-being of the communities.
DATA AND METHODS
Study Area
area, with slopes ranging between 16 and 30%, very shallow soils composed mainly of stones and rock out-crops most of which are devoid of vegetation cover; (c) valley bottoms and river terraces mainly situated at the foot slopes of mountain ranges and rivers banks with moderately fertile and deep soil and with slopes ranging from 0 to 3% and (d) flat plains mostly concentrated in the north eastern and north western part , with slopes ranging between 0 and 3%, deep and fertile soils with slight vegetation cover (mostly shrubs) mainly used as grazing and browsing by pastoral livestock (DDAEPA, 2011). Based on the 2007 population and housing census of Ethiopia, the total population of the study area is
228,856 with an average of about 4 persons per
households. All these people uses dechatu watershed as source of water supply (FDREPCC, 2008).
Sampling Techniques and Methods of Data Collection
A two-stage sampling technique was used to select sample respondents. In the first stage three urban kebeles (05, 06 and 09 kebeles) were purposively selected as they are severely affected by flood from the upland degraded watershed. Kebele is an administrative hierarchy in Ethiopia. In Ethiopia there are nine regional state where every region is structured into zones. Besides, zones are divided into districts and every district is again divided into kebeles. Secondly, proportionally from population size in each Kebele, a total of 282 freshwater users’ were randomly selected. Both primary and secondary data were collected for this study. The secondary data were collected from relevant sources including Central Statistical Agency, and Dire Dawa Bureau of Agriculture. The primary data on the willingness to pay were collected through face to face interview. Structured questionnaire was pre-tested to evaluate its effectiveness and to identify the initial bids. The initial bids identified and used in actual survey were include 30, 70, 100, 140 and 180 Ethiopian birr (ETB) per year. ETB refers to Ethiopian birr which means Ethiopian currency. EUR 1 = 26 ETB during the study period. The chosen bids were randomly assigned to the respondents such that each bid was presented to an equivalent sub-sample.
Contingent valuation method (CVM) was employed to elicit urban freshwater users’ willingness to pay (WTP) for upland degraded watershed management. Many CVM studies have made use of this format because it has properties for incentive-compatible or truthful revelation of preferences. Despite, these advantages there are four possible sources of bias such as strategic bias, information bias, starting point bias and hypothetical market bias in CVM (Tietenberg, 2003). A strategic bias occurs when respondent understate and overstate the true values of the WTP (Hanley et al.,
1997). An information bias occurs when the respondents are forced to value the environmental goods with which they have little or no information (Tietenberg, 2003). On the other hand, the starting point bias occurs when the respondent’s WTP amount is influenced by a value introduced by the hypothetical scenario (Mitchell and Carson, 1989). Hypothetical market bias seems to depend on how the questions are asked in the CVM questionnaire and on how realistic respondents feel the
hypothetical market (Hanley and Spash, 1993). To minimize these CVM biases the present study used the following four approaches. First, a clear presentation of hypothetical market, and face to face interview method was used to collect the data from the respondents. Second, CVM in the form of double bounded elicitation method was used to elicit the mean willingness to pay. Third, the initial bids were identified before the actual survey was conducted. Fourth, the sample respondents were selected using random sampling method.
Data Analysis Methods
In contingent valuation survey the respondents were also given an opportunity to zero bid (willingness to pay) (Johnson and Whitehead, 2000). These zero responses may separate genuine and protest zeros. Hence, to distinguish between genuine and protest zero responses, and to treat these zero response, we should adopt an appropriate framework of analysis (Strazzera et al., 2003). Nonparticipation can have a substantial impact on the results of CVM studies. If it is inadequately accounted for in the estimation process resulting in an important difference in the final WTP estimates (Haab, 1999; Dziegielewska and Mendelsohn, 2007).
A genuine zero value is not a problem since it reflects the true value that the public good has for the respondent. The problem is with protest zero responses (Jorgensen and Syme, 2000). In the traditional CVM analysis protest responses has tended to exclude from the sample data set. However, this creates a problem if protest responses encourage a selectivity bias (Calia and Strazzera, 2001), that is, there is a systematic relationship between protesting and participating in the market. Although there is no a general consensus in the CVM literature on the most appropriate way of dealing with this problem of nonparticipation, a solution that has gained an increasing popularity is the Spike model. The Spike model was proposed by Kriström (1997) and it explicitly allows for the possibility that some portion of the respondents are indifferent to the good being valued, i.e. this model assigns a non-zero probability to zero WTP responses.
Following Kriström (1997), the simple spike model was used in the study to allow a better handling of the zero responses that are common when using the dichotomous choice referendum format. A respondent was asked whether or not he or she is willing to contribute to a trust fund that was used for the management of degraded Dechatu watersheds. The willingness to pay for a change in environmental quality(watershed improvement) → can be expressed (1)
, , (1)
where: V(y, q) is an individual’s indirect utility function and y is income.
Pr (2)
where is a right continuous non-decreasing function.
As a result, the expected WTP can then be expressed by Eq. 3.
(3)
To be able to estimate in this study different amounts of initial bids (A) were presented to each sub-sample. The spike-model assumes that the distribution function of WTP ( ) has the Eq. 4 form.
(4)
where p belongs to (0, 1) and Gwtp (A) is a continuous and increasing function such that Gwtp (0) = p and lim A→∞ Gwtp (A) =1. This creates a jump-discontinuity or a spike at zero.
In this study after the contingent valuation scenario was presented to the respondents two valuation questions were offered for the spike model. These valuation questions include:
- Whether the respondent is willing to participate in the market.
- Whether the respondent is willing to pay the initial bid per year.
For each respondent, i, an indicator of was defined to determine whether the respondent is “in-the-market” or not (Eq. 5).
(5)
The respondent is “in-the-market” if the additional amount that he/she is asked to contribute to the trust fund is lower than his/her willingness to pay. To identify the effect of respondent’s socio-economic characteristics on their WTP for upland degraded watershed management, the model specified by Eq. 6 was used.
, , ⋯ , , (6)
where:
, , … , is also a vector of explanatory
variables not necessarily distinct of below; unknown parameters of the model. Analogously, one can assume that behind the decision to participate in the hypothetical market the latent variable was used to indicate the respondent’s willingness to pay the suggested prices A (Eq. 7).
(7)
This latent variable is specified as:
, , ⋯ , ,
(8)
where , , … , is a vector of explanatory variables, is the initial bids, offered to the respondent in order to enjoy an improvement in the environmental quality → , in the case of this study, upland Dechatu watershed management. And , are unknown parameters of the model. The disturbance terms are assumed to have a bivariate normal distribution with a correlation parameter, . That is,
, ~ , , , , . Therefore, with the
introduction of these decision rules, the spike model becomes a bivariate specification with sample selection (Eq. 9).
∗
∗ → ∗
∗ (9)
The log likelihood for the sample is then given by (Eq. 10).
∏ ∗ ∏ ∏ ∗ , ∗
∏ ∗ , ∗ (10)
which implicitly contains the joint probability of ∗ and
∗ and the marginal probability of ∗.
RESULTS AND DISCUSSION
Socio-economic characteristics of freshwater users
All the sample size including the protest response (bidders) (11.3% of the respondents) was included in the analysis to avoid the problem of sample selection bias. The descriptive result shows that 84.4% and 15.6% were males and female respondents, respectively. Among the sample respondents 81.9% were married. About 65% and 31% of the sample respondents were living in their own house and kebele, respectively. The remaining 4% were living in rented house. The age of these sample respondents ranged from 18 to 77 years with an average about 44 years. The average age indicates that most of the sample respondents were active working group. The average family size was 5 persons with a minimum of 1 and maximum of 9 persons per household. This average family size was greater than the national average of 4.7 persons per household (FDREPCC, 2008). This is due to the fact that the respondents are practiced a polygamy custom. On average the educational status of the sample respondents was computed at 8 years of schooling. On average the monthly income of sample households was computed at 2021 ETB per month. This is because of Khat production and smuggled goods.
Perception on water availability and quality
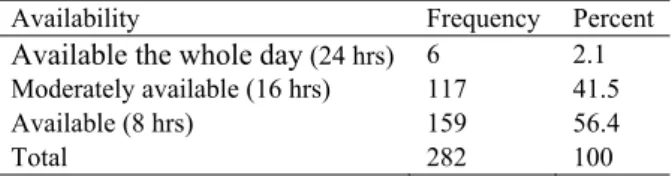
consumption per month of the respondents was 1.89 cubic meters. However, 56.4% of the respondents reported that water is availability for 8 hours per day. About 2.1% of the respondents stated that water is available the whole day(Table 1).
Table 1: Perception on the availability of water
Availability Frequency Percent
Available the whole day (24 hrs) 6 2.1 Moderately available (16 hrs) 117 41.5
Available (8 hrs) 159 56.4
Total 282 100
Source: survey data
83.3% of the sample respondents reported that there is no problem on the quality of water directly used from the pipeline. Whereas the remaining respondents reported that there is a problem on the quality of availability of water (Table 2).
Table 2: Perceptions on the quality of water
Quality of water Frequency Percent Highly acceptable 235 83.3 Moderately acceptable 45 16
Acceptable 2 0.7
Total 282 100
Source: survey data
Awareness on the causes and effects of water supply problems
The respondents are using the water resource for drinking, cooking, bathing, cleaning and other purposes. However, shortage of water supply is a problem for the livelihoods of the respondents. Four interrelated causes of water supply problems were identified and described: (1) busted pipeline, (2) insufficient raw water, (3) deforestation and (4) climate change. Each of these causes would individually enhance water supply problem of the urban freshwater users. The result shows that 48.9% of the respondents were identified busted pipeline as the cause of water supply problem. In the case of insufficient raw water 66% of the respondents answered yes response. Moreover, 27% and 10% of the respondents stated that deforestation and climate change were the causes of water supply problem, respectively (Table 3). Insufficient raw water is ranked first by respondents as cause of water supply problem. This insufficient raw water may be occurred due to the degradation of upland watershed.
On the other hand, four effects of water supply problem were identified: (1) health problem (2) higher expenditure (3) delay in household chores (4) affected personal hygiene. Specifically, 57% of the respondents reported that health problem is the effect of water supply problem. About 52% of the respondents said that higher expenditure is the problem. In the case of delay in household chores 24% of the respondents say yes response. Moreover, about 35%, the respondents stated that personal hygiene problem is the effect of water supply problem (Table 4). This is in agreement with the findings of John-Dewole (2012). John-Dewole (2012),
found that lack of good water supply enhanced various
forms of water-borne diseases such as typhoid fever, diarrhea and paratyphoid fever.
Table 3. Cause of water supply problem
Causes Response
Yes (%) No (%) Busted pipeline 49 51 Insufficient raw water
during the dry season 66 34 Deforestation 27 73 Climate change 10 90
Source: Survey data, 2014
Table 4. Effects of unstable water supply to freshwater users
Effects Response Yes (%) No (%)
Health problem 57 43 Higher expenditure 52 48 Delay in household chores 24 76 Personal hygiene is affected 35 65 Source: survey data, 2014
Perception on causes of Dechatu watershed degradation
About 87.6% of the sample respondents were familiar with the Dechatu watershed, and they reported that the upland watershed has been degraded. Agricultural expansion, population pressure, soil and water degradations, change in weather conditions and climate change are the causes of watershed degradation identified from the respondents. Specifically, 23.8% and 53.3% of the respondents reported that agricultural expansion, and soil and water degradations are the causes of upland degradation, respectively (Table 5). This study is consistent with the finding of JICA team (2007). JICA study team (2007) identified that intensive firewood collection, over-grazing, unfavourable climatic conditions, shifting cultivation, poor land management and lack of law enforcement as the causes of watershed degradation.
Table 5. Causes of Dechatu watershed degradation
Causes Response Yes (%) No (%) Agricultural expansion 24 76 Population Pressure 62 38 Soil and Water degradations 53 47 Change in weather conditions 10 90 Climate change 17 83 Source: Survey data, 2014
Solutions were also elicited from the aware respondents for possible improvement of degraded Dechatu watershed. Strong government regulation, soil and water conservation, tree planting and training users and creation of other source of income are among the protection measures (Table 6).
Well managed and protected watershed provides goods and services for the communities. According to
recreation, food and timber. The result of this study is consistent with the finding of EPA (2012). The result found that well managed and protected watershed absorbs water and makes it available for future, minimize floods, and improve water quality. Specifically, 66% of the respondents reported that well managed and protected watersheds are important for absorb water and make it available for future use. About 40% of the respondents specified that well managed and protected watersheds are important for minimizing floods. On the other hand, 25% of the respondents reported that well protected watershed is very important for water quality improvement (Table 7).
Table 6.Solutions for watershed degradation
Solutions Response Yes (%) No (%) Government regulation 13 87 Tree planting 34 66 Soil and water
conservations 67 33 Training 51 49 Other source of income 13 87 Source: Survey data, 2014
Table 7. Important of well protected watershed
Important Response Yes (%) No (%) They absorb water and
make it available for future use 66 34 They minimize floods 40 60 Improve water quality 25 75 Source: Survey data, 2014
Freshwater users’ responses on mechanisms and economic instruments
Three mechanisms were identified to collect the fund for upland degraded watershed management. These mechanisms include contribution as trust fund, amount to be added to water bill and recover through income tax. Specifically, about 13% of the respondents preferred none of the mechanism. On the other hand, 26% of the respondents preferred trust fund mechanism. Whereas about 45% and 16% of the sample respondents were specified water bills and income tax as appropriate mechanisms to collect watershed management fee, respectively. In general, the result shows that the majority of the respondents were willing to contribute as amount to be added to water bill.
The bases of charging the fee were also identified from the respondents: (1) volume of water used (2) income (3) number of members in the households and (4) fixed rate. About 9% of the respondents were selected fixed rate as a base of charging the fee. On the other hand, about 14% of the respondents were selected none of the bases of charging the fee.
Freshwater users’ WTP for upland degraded watershed management
About 82% of the sample respondents were willing to pay for Dechatu watershed management. Among these willing respondents about 45% of them accepted the initial bids offered to them. The average initial bids
assigned to the respondents were computed at 104 ETB. From discrete responses of WTP, the study shows that about 20% of the respondents accepted both the 1st bids and 2nd higher bids offered. Besides, about 25% of the respondents responded “Yes-No” response. Furthermore, about 20% and 35% of the sample respondents responded “No-Yes” and “No-No” for the offered bids, respectively (Table 8).
The mean willingness to pay for upland degraded watershed management was computed at 97.13 ETB per year per household for five years horizon (Table 9). The result shows that the mean WTP from spike model is different from the mean value of open ended elicitation method significantly at 1% level of significance. This is because open ended elicitation method has an advantage to avoid the anchoring effect unlike double bounded elicitation method. This finding is consistent with various studies (Amponinet al., 2007; Alem, 2012).
The mean WTP of the respondents from open ended elicitation method was computed at 70.27 ETB per households per year for five years. The willing respondents were also asked to point out their reasons for their maximum willingness to pay. About 42.9% of the respondents reported that they could not afford more than what they stated because of inadequate income. On the other hand, ‘’I think it is worth that amount and others should pay’’ were also the reasons identified from 28.4% and 10.3% of the sample respondents, respectively. Nevertheless, about 18.44% of the sample respondents were not willing to pay for upland degraded watershed management. Of the unwilling respondents about 88.7% of them were stated genuine zero. Whereas, the remaining respondents stated protest zero. The criteria for selecting protest zero was based on the discussion on NOAA panel guide on Arrow et al (1993)
Determinants of urban freshwater users’ WTP
Table 10 summarizes the determinants of freshwater users’ willingness to pay for upland degraded watershed management. The result shows that the income of the sample respondents had positive and significant relationship with the freshwater users’ WTP. The positive effect indicates that respondents with higher monthly income were more likely to say yes to the offered bids than freshwater users’ with lower income. This shows that degraded watershed management is a normal economic good whose demand changes in the direction of income change. The studies by Amponin et al. (2007) and Alem (2012) recognized significant association between households’ income and WTP.
Table 8. Freshwater users’ responses from double bounded elicitation method
Offered bids Households Response for the offered initial bids Initial bids(ETB) Second higher
bids(ETB)
Second lower
bids(ETB) yes-yes (%) yes-no (%) no-yes (%) no-no (%)
30 60 15 11.7 6.03 0.36 1.77
70 140 35 3.55 7.8 3.9 4.97
100 200 50 2.13 5.32 4.26 8.16
140 280 70 1.42 3.55 6.03 8.51
180 360 90 1.06 2.5 4.97 12.06
Source: survey data, 2014
Table 9. Parameter estimates of spike model
Coef. Std. Err. z P>z
Initialbid 0.017 0.001 11.99 0.000
_Constant 1.49 0.150 9.93 0.000
A:1/(1+exp(_b[s:_cons]))
wtp:1/(_b[eq1:initialbid])*log(1+exp(_b[s:_cons]))
A 0.18 0.02 8.14 0.000
wtp 97.13 6.73 14.43 0.000
Number of obs=282 Wald chi2(1)=143.85 Log likelihood= -258.46453 Prob> chi2=0.000
Source: model output, 2014
Table 10. Bivariate probit regression result
eq1: wtparticipate eq2: wtpinitialbid
Explanatory variables Coef. P>z Coef. P>z
Age 0.020 0.079* 0.002 0.826
Sex 0.020 0.942 0.183 0.486
Maritalstatus - - - -
Single (base)(1) - - - -
Married(2) 0.075 0.850 -0.275 0.421
Widow/er(3) -0.213 0.591 0.117 0.850
Divorced (4) -1.31 0.050** -1.303 0.050**
Occupations - - - -
Unemployed(base)(1) - - - -
Self-employed (2) 0.263 0.412 0.452 0.111 Governmentemployee (3) -0.124 0.716 0.308 0.329 Privatesectoremployee (4) 0.132 0.922 -5.274 1.000
Educationallevel 0.132 0.000*** 0.058 0.017** Householdsize -0.007 0.936 -0.076 0.326 totalincome 0.0002 0.091* .0004 0.000*** Waterconsumptionin(m3) 0.158 0.321 0.113 0.397
Ownershipofhouse - - - -
Owned(base) - - - -
Rented -0.899 0.048** -0.650 0.151
Kebele 0.062 0.774 -0.202 0.303
Bids -0.005 0.032** -0.015 0.000***
Constant -1.135 0.125 0.031 0.962
Number of obs= 282 Wald chi2(30)= 184.52 Log likelihood= -221.76 Prob> chi2= 0.000
***, ** & * indicate significant level at 1%, 5% and 10%, respectively Source: model output, 2014
Divorced respondents were less likely willing to pay for upland degraded watershed management than single respondents. The coefficient of this variable is negative and significant at 5% level of significance. The study shows that respondents lived in rented house were less
likely willing to pay than the households lived in their own house. This could be due to households were spent high expenditure for renting house. The coefficient of this variable was significant at 5% level of significance.
significant for households WTP. The negative sign indicates that as starting bid price increases the probability of freshwater users’ willingness to pay were reduced. In other word, the demand for upland degraded watershed management was decreased as price increases. This is consistent with the finding of various studies (Whittington et al., 1990; Carlsson et al., 2004; Amponin et al., 2007; Alem, 2012).
Aggregate Benefits of upland degraded watershed management
An important issue related to the measurement of welfare using WTP is aggregation of benefit. Since the watershed dealt with is not a pure public good the mean WTP was used as a measure of aggregate benefit of improved degraded upland watershed management. The aggregate WTP was calculated by multiplying the mean WTP by the total number of households in the population. From spike model the aggregate benefit for upland degraded watershed management of the total population of the study area was computed at 5,206,362 ETB per year. Whereas, from open ended elicitation method the total WTP was computed at 3,766,613 ETB.
CONCLUSION AND RECOMMENDATIONS
Contingent valuation method was used to elicit freshwater users’ willingness to pay for degraded watershed management. The descriptive analysis shows that the urban residents are facing water supply problem because of busted pipeline, insufficient raw water, deforestation and climate change. The local government together with the freshwater users’ should therefore take an immediate action to manage the upland degraded watershed. Unless, it is very difficult to sustain life in the degraded watershed, and hence migration may increase. The study objective was identified different causes of upland watershed degradation from the respondents. The main causes of watershed degradation are agricultural expansion, population pressure, soil and water degradation, weather and climate changes. Therefore, the government together with the residents should carry out soil and water conservations and planting tree on the degraded watershed.
The study found that Mechanisms to collect the amount of money for degraded watershed management are different from household to household. In addition, the basis of charging the fee applied for management activities should also different from individual to individual.
The annual willingness to pay value of households from the double bounded choice was greater than the annual total WTP from open ended format. The study concluded that double bounded dichotomies choice is affected from anchoring effect. The findings in the study can be used to compare for the cost of the watershed management. If the aggregate willingness to pay is lower than the proposed cost of watershed management plan, there should be an effort from the management agency or government to solve social acceptability problem.
Willingness to pay was also affected from different household’s socio-economic characteristic such as total
income, initial bids, marital status, ownership of house and educational levels. The study leads us to conclude that understanding of such socio-economic characteristics is a necessary and first step to achieve watershed management.
Acknowledgements
We would like to acknowledge Haramaya University for providing us financial support. We also thank the enumerators for the effort they made to collect primary data. Dire Dawa Agriculture office deserves special thanks for providing and allowing data for the analysis.
REFERENCES
ACHOURI, M. (2005).Preparing for the next generation watershed programs and projects: Africa in swallow: OKONE, B., ACOURI, M. N., TENNYSON, L. (eds) (2005). Paper presented at African workshop on watershed management, 8-10 October 2005, Nairobi, Kenya.
AGLANU, L.M. (2014). Watersheds and rehabilitations measures: a review. Resources and Environment
4(2):104-114.
AGUDELO, J.I. (2001). The economic valuation of water: principles and methods. Value of water. Research Report Series No. 5.
ALEM, M. (2012). Households’ willingness to pay for restoring environmental resource: A case study of forest resource from Dire Dawa Area, Eastern Ethiopia.
Ethiopian Journal of Economics 21(2): 33-62.
AMPONIN, J.A.R., BENNAGEN, M.E.C. HESS, S., CRUZ, J.D.S.D. (2007). Willingness to pay for watershed protection by domestic water users in Tuguegarao City. PREM Working Paper: PREM07/06, Philippines.
BIROL, E., KAROUSAKIS, K., KOUNDOURI, P. (2006). Using economic valuation techniques to inform water resources management: a survey and critical appraisal of available techniques and an application.
Science of the Total Environment 365: 105–122.
CALIA, P. AND STRAZZERA, E. (2001).A sample selection model for protest responses in contingent valuation analyses’. Statistica 61(3):473–485.
CARLSSON F., KÖHLIN, G., ALEMU, M. (2004). Contingent valuation of community plantations in Ethiopia: a look into value elicitation formats and intra-household preference variations. Working Papers in Economics no. 151, Gothenburg University, Sweden. CBD (Secretariat of the Convention on Biological Diversity) (2001). The Value Of Forest Ecosystems. CBD Technical Series no. 4. Montreal, SCBD, 67p. DDAEPA (Dire Dawa Administration Environmental Protection Agency) (2011). Dire Dawa Administration Program of Adaptation To Climate Change, Dire Dawa, Ethiopia.
DZIEGIELEWSKA, A., MENDELSOHN, R. (2007). Does “no” mean “no”? A protest methodology’.
Environmental and Resource Economics 38:71–87.
http://dx.doi.org/10.1007/s10640-0069057-4
FDREPCC (Federal Democratic republic of Ethiopia Population Census Commission) (2008). Summary Statistics And Statistical Report of The 2007 Population and Housing Census: Population Size By Age And Sex. Addis Ababa, Ethiopia.
FREEMAN III, A.M. (2003). The Measurements of Environmental And Resource Values: Theory and Methods. Resource for the Future, Washington DC, USA.
HAAB, T.C., MCCONNELL, K.E. (2002).Valuing Environmental and Natural Resources: The Econometrics of Non Market Valuation. Edward Elgar, Cheltenham U.K.
HAAB, T.C. (1999). Nonparticipation or misspecification. The impacts of nonparticipation on dichotomous choice contingent valuation. Environmental
and Resource Economics 14: 443-461.
http://dx.doi.org/10.1023/A:1008349525868
HAJKOWICZ, S.A., OKOTAI, P. (2005). An economic valuation of watershed management in Rarotonga. the Cook Islands’, CSIRO Sustainable Ecosystems, Brisbane, Australia.
HANEMANN, M.W. (1994). Valuing the environment through contingent valuation method. Journal of
Economic Perspectives 8(4): 19-43.
HANLEY, N., SHOGREN, F.J., WHITE, B. (1997).Environmental Economics: In Theory and Practice. Macmillan Press Lt.d. UK.
JICA STUDY TEAM (2007).Toward Sustainable Watershed Management. Newsletter of JICA Study Team for Community-Based Integrated Watershed Management in Laclo and Comoro River Basins 1(2), September 2007.
JOHN-DEWOLE, O.O. (2012). Adverse effects of inadequate water supply on human health: a case study of Kajola Local Government in Oyo State, Nigeria. Greener
Journal of Medical Sciences 2 (5): 115-119.
JOHNSON, B.K., WHITEHEAD, J.C. (2000).Value of public goods from sports stadiums: the CVM approach. Contemporary Economic Policy 18:48–58.
http://dx.doi.org/10.1111/j.1465-7287.2000.tb00005.x
JOHNSON, N.L., BALTODANO, M.E. (2004). Analysis the economics of community watershed management: some evidence from Nicaragua. Ecological Economics
49: 57–71.
JORGENSEN, B.S., SYME, G.J. (2000). Protest responses and willingness to pay: attitude toward paying for storm water pollution abatement. Ecological
Economics 33(2): 251–265.
http://dx.doi.org/10.1016/S0921-8009(99)00145-7
KRIEGER, D.J. 2001. The Economic Values of Forest Ecosystem Services: A Review. The Wilderness society, Washington D.C.
KRISTRÖM, B. (1997). Spike models in contingent valuation. American Journal of Agricultural Economics
79:1013-1023.http://dx.doi.org/10.2307/1244440
LAKEW D., CAURCCI, V., ASRAT, W., YITAYEW, A. (eds). (2005). Community based participatory watershed development: A guideline. Ministry of Agriculture and Rural development, Addis Abeba, Ethiopia.
MEA (Millennium Ecosystem Assessment) (2005). Ecosystems and Human Wellbeing: Synthesis’, Island Press, Washington DC.
MITCHELL, R., CARSON R. (1989). Using Surveys to Value Public Goods: The Contingent Valuation Method. Resources for the Future. Washington DC, USA.
PORTNEY, P. R. (1994). The contingent valuation debate: why economists should care? Journal of
Economic Perspectives 8(4): 3-17.
POSTEL, S.L., THOMPSON, B.H. (2005). Watershed protection: capturing the benefits of nature’s water supply services. Natural Resources Forum29: 98–108.
http://dx.doi.org/10.1111/j.14778947.2005.00119.x
SHENG, T.C. (1990). Watershed Management Field Manual: Watershed Survey And Planning. Food and Agriculture Organization of the United Nations, Conservation Guide 13/6, Rome, Italy.
STRAZZERA, E., SCARPA, R., CALIA P., GARROD G.D., WILLIS, K.G. (2003). Modeling zero values and protest responses in contingent valuation surveys.
Applied Economics 35:133–138.
http://dx.doi.org/10.1080/0003684022000015900
SWALLOW, B.M., GARRITY D.P., NOORDWIJK, M.V. (2002). The effects of scales, flows and filters on property rights and collective action in watershed management. Water Policy 3(6): 457.
http://dx.doi.org/10.1016/s1366-7017(02)00011-9
TEGEGNE G. (1999). Willingness to pay for environmental protection: an application of contingent valuation method (CVM) in Sekota District, Northern Ethiopia. Ethiopian Journal of Agricultural Economics
3(1).
TIETENBERG T. (2003). Environmental and Natural Resource Economics, 6th edition. Pearson Education, Inc. WANI, SP., SREEDEVI TK., REDDY, TSV.,VENKATESWARLU, B., PRASAD, CS. (2008). Community watersheds for improved livelihoods through consortium approach in drought prone rain-fed areas.
Journal of Hydrological Research and Development
23:55-77.
WHITTINGTON, D. (1998). Administering contingent valuation surveys in developing countries. World
Development 26(1):21-30.
WHITTINGTON, D., BRISCOE, J., MU X., BARRON, W. (1990). Estimating the willingness to pay for water services in developing countries: A Case Study of the Use of Contingent Valuation Surveys in Southern Haiti.
Economic Development and Cultural Change 38(2):