http://dx.doi.org/10.1590/bjb.2014.0073 Original Article
Economic assessment of urban watersheds: developing
mechanisms for environmental protection of the
Feijão river, São Carlos - SP, Brazil
Machado, FH.
a*
, Silva, LF.
b, Dupas, FA.
b, Mattedi, AP.
cand Vergara, FE.
d aMSc in Environment and Water Resources, Federal University of Itajubá – UNIFEI,Av. BPS 1303, CEP 37500-000, Itajubá, MG, Brazil
bNatural Resources Institute, Federal University of Itajubá – UNIFEI, Av. BPS 1303, CEP 37500-000, Itajubá, MG, Brazil
cDepartment of Mathematics and Computer Science, Federal University of Itajubá – UNIFEI, Av. BPS 1303, CEP 37500-000, Itajubá, MG, Brazil
dDepartment of Environmental Engineering, Federal University of Tocantins – UFT, LAC 14 IN NS 15, CEP 77010-090, Palmas, TO, Brazil
*e-mail: [email protected]
Received: April 23, 2013 – Accepted: November 17, 2013 – Distributed: August 31, 2014 (With 3 figures)
Abstract
In order to determine the willingness of the population of São Carlos (a city in the state of São Paulo, Brazil) to pay for the environmental protection (WTP) of the Feijão River´s watershed, the Contingent Valuation Method (CVM), as
well as the bidding-games technique, were used. In October 2010, 280 questionnaires were applied to a probabilistic
sample of the population. A multivariate logistic regression model was built, creating five scenarios adjusted to the age and probability to pay according to the significant variables found. Concerning the WTP, 56% of the interviewees
showed willingness to pay a monthly amount using the water bill as a vehicle for this. The WTP average was 1.94
US Dollar (USD), with a standard deviation of 1.91 USD. The total annual amount for the scenario that considers the
whole population over 18 years old was of USD 3,930,616.80. The main argument for the negative WTP was that the
interviewees could not afford it (14%).
Keywords: contingent valuation, economic valuation of water resources, environmental protection, urban watersheds, Brazil, developing country.
Avaliação econômica de bacias hidrográficas: desenvolvendo mecanismos
para proteção do ribeirão do Feijão, São Carlos - SP, Brasil
Resumo
A fim de determinar a disposição a pagar (DAP) da população de São Carlos – SP, Brasil, para a proteção ambiental da bacia hidrográfica do ribeirão do Feijão, o Método de Valoração Contingencial (MVC), bem como a técnica de eliciação bidding-games foram utilizados. Em outubro de 2010, 280 questionários foram aplicados a uma amostra probabilística da população. Um modelo de regressão logística multivariada foi construído, criando cinco cenários ajustados pela idade e probabilidade de pagar de acordo com as variáveis significativas encontradas. Em relação à DAP, 56% dos entrevistados se mostraram dispostos a pagar uma quantia mensal usando a conta de água como veículo de pagamento. A média DAP foi de 1.94 US Dollar (USD), com um desvio padrão de 1,91 USD. O valor total anual estimado para o cenário que considera toda a população com mais de 18 anos de idade foi de USD 3,930,616.80. O principal argumento para a não DAP foi que os entrevistados não tinham condições financeiras (14%).
Palavras-chave: valoração contingente, valoração econômica dos recursos hídricos, proteção ambiental, bacias
hidrográficas urbanas, Brasil, país em desenvolvimento.
1. Introduction
Martinelli and Filoso (2009) demonstrate that the agricultural growth of Brazil over the past few decades has caused the loss of environmental services, i.e.,
the human benefits provided by ecosystems. In the
municipality of São Carlos (SP, Brazil), fast agricultural
growth in addition to a fast rate of urbanisation, are causing adverse impacts on the land cover of the region,
(Dupas et al., 2006; Cunha et al., 2011; Costa et al., 2012; Machado and Dupas, 2012).
Consequently, in order to prevent further degradation on this watershed, Dupas et al. (2006) have suggested the implementation of a system of payment for environmental services provided by the watershed. Payment for Environmental Services – PES consists of paying farmers, whose participation is voluntary, to keep or change how their land is used in order to protect environmental services (Pagiola et al., 2010).
By incorporating economic analysis considering the environment, studies have been initiated on the environmental economic valuation of the impacts produced by anthropogenic activities on natural resources. This
represents a fundamental step concerning the quantification
of the main processes that regulate and control the way ecosystems work, as well as their relevance to human well-being in the form of public policies for sustainable development (Tundisi and Matsumura-Tundisi, 2010; Turner et al., 2010). Moreover, it is an instrument of public policy to detain the loss of biodiversity and environmental services, since this presumes that the ecosystemic losses are due, partly, to the market’s failure in recognising the
benefits that human beings reap from ecosystems (Abson and Termansen, 2011).
Several methods can be used to estimate the values for environmental assets and the services that they provide.
The Contingent Valuation Method – CVM, formulated in
1947 by Ciriacy-Wantrup, is commonly applied in many countries, being widely used by government departments, mainly in the USA, for measuring the willingness to pay
for social projects and cost-benefit evaluations for public
policies that are aimed at environmental protection and public health (Jones et al., 2008; Notaro and Paletto, 2011; Sale et al., 2009).
As stated by Bolt et al. (2005) and McFadden (1994),
the CVM is based on the observation of human behaviour
regarding public assets, places and services. However, in some cases, there are no observable monetary values in the market, which is why a sample of people can be asked about their WTP for these assets. Economic theory sustains that the maximum amount, in monetary terms, that an individual is willing to pay for a product is an indicator of the utility or satisfaction (Dong et al., 2005). Taking this into account, Baral et al. (2008) and Fonta et al. (2007)
maintain that this method is fairly flexible and adaptable, as the CVM offers more advantages than other existing
methods because it can obtain the individual WTP in different hypothetical markets.
According to Jones et al. (2008), when a hypothetical market is developed using surveys, aspects to be applied to a sample of the target population are included. Parts of the questionnaire included are different questions concerning socio-economical aspects, attitudes towards the goods to be valuated and also an elicitation question
concerning the WTP or willingness to accept (WTA). The
WTP is the maximum amount a person is willing to pay to improve environmental quality. Willingness to Accept
is the minimum amount a person is willing to receive, as a form of compensation, for a negative change to the environmental resource (Kaffashi et al., 2011; Turner et al., 2010). It should be noted that, even considering the foreseen advantages, this method is prone to several biases when developing the scenarios, which is why it has been criticised. Because of this, the literature points out various recommendations for its correct use (Arrow et al., 1993; Fonta et al., 2007; Liu et al., 2010; López-Mosquera and Sánchez, 2011; Mendelsohn and Olmstead, 2009).
Given the above, the main aim of this study was to
evaluate the water resources of the Feijão River´s watershed using the CVM. Succinctly, the specific aims were: to estimate the Willingness to Pay of São Carlos´ population
for the environmental protection of the watershed; to evaluate the population’s environmental perception towards
environmental issues and; to identify the significant variables
that affect the individuals’ WTP.
2. Study Area
São Carlos is a municipality in the interior of the state of São Paulo, Brazil. It has a population of 219,865
inhabitants, mostly urban (96%), living in an area of 1,141
km2 situated 230 km northwest from the state’s capital (IBGE, 2010). The Feijão River´s watershed is located about 22° S and 47 W (Figure 1). The Feijão River flows
from NE-SW and ENE-WSW first over sandstones of the Botucatu formation and later (downstream) over diabasic
terrain from basaltic origin between Botucatu geological formation. Out of the total amout of water consumed by
the population of São Carlos annually, 27% comes from the Feijão River (outflow of 246.3 L/s). The Monjolinho River supplies 24.8% (outflow of 225.9 L/s), while the remaining is tapped from the groundwater (outflow of 439.2 L/s) (Costa et al., 2012; Tundisi et al., 2008).
3. Methods and Material
3.1. Sample size
The calculation of sample size can require specialised statistical procedures. However, these are based on the basic
formulas for finite populations (up to 100,000 elements) and infinite (more than 100,000 elements). In this context,
the sample size was estimated using the methodology proposed by Gil (2008) for infinite populations:
s = 2 . p . q2 n
e (1)
Where: n: Sample size;
s2: Chosen confidence interval – in standard-deviations number;
p: Probability of the phenomenon occurring; q: Complementary probability (100 – p ); e2: Margin of error allowed.
In order to determine the sample size for the survey, two
of reliability. For the probability of event p occurring, the maximum value of 0.5 was adopted as that estimate was not previously established, consequently, q equals 0.5.The
margin of error allowed was 6%. The equation resulted in
a sample of 277 individuals, which was rounded up to 280. 3.2. The survey
Data were collected through personal interviews using questionnaires conducted at the interviewees’ homes. In October 2010, 280 questionnaires were applied to a probabilistic sample of the population. A pilot study was used to identify possible problems with the questionnaire application. The interview was preferentially carried out with the head of the household or, alternatively, with a person in the household that was 18 or over. As the technique used is based on the WTP, the interviewee had to be of a working age and, therefore, be able to have income. The referendum model and the bidding-games were used as the elicitation technique. According to Kartman et al.
(1996), this elicitation technique consists of presenting the interviewees with a set of values in order to obtain their maximum WTP. This technique is based on presenting the interviewee with a determined initial value. If this value is rejected, then it is reduced until reaching one that the interviewee is willing to pay. If accepted, then the value is increased until reaching the maximum value that the interviewee accepts to pay. The values presented to the interviewees, for them to pay through their water bill monthly, were: “USD 0.321”; “USD 0.95”; “USD 1.26”; 1Exchange rate: 1,5821 Real/Brazil = 1 US Dollar 06/14/11. Source:
BCB (2011).
“USD 3.16”; “USD 6.32”; “USD 12.64”; “USD 18.96”, “more than USD 18.96”; and the option “I do not know”.
The initial bid value was defined at “USD 1.26”.
The procedure used for the data collection was that of
stratified sampling, through which the municipality was
divided into four strata, according to the local annual property tax paid by the households in 2010. The questionnaire was divided into two main parts: A and B. The main purpose of part A was to identify information about the socio-economic characteristics of the interviewee. Part B was used to ask questions concerning the environmental perception of the interviewee, in which the individual’s WTP was elicited. The structure of the questionnaire consisted of dichotomous choices and questions with multiple choices for answers, all conducted by the interviewer.
3.3. Regression model
The logistic regression model was used in order to
identify the variables that influenced the probability for
the interviewees to be willing to pay for the watershed environmental protection. According to Silva and Lima
(2004), the logistic model is based on the cumulative distribution function for a standard logistic random variable, represented by the following expression:
(
) ( )
− β= = = β =
+ 1 1
1
i i X
P P Y f X
e (2)
Where Pi is the probability of the individual i to take the decision Yi = 1, that is, be willing to pay to benefit from the results of the preservation and maintenance of
the watershed; βXi is a vector of explanatory variables that Figure 1. Sub-watersheds of the Mogi-Guaçu and Tiête-Jacaré watershed. Source: Adapted from São Paulo (2009),
represent the characteristics of that individual; i corresponds to each observation of the used sample; and e, the base of Neperian logarithms. Kleinbaum et al. (1998) claim that this model is the most popular regression technique available for models with dichotomous dependent variables. In this survey, we assume the dichotomous dependent variables to be the probability of an individual to be willing to pay Yi = 1, or not to pay Yi = 0. Following the rules to define dummy variables mentioned by Kleinbaum et al. (1998), each categorical explanatory variable was transformed into a dummy variable for regression analysis. Table 1 presents the explanatory variables used in this survey.
Concerning the construction of the multivariate model, after the univariate analysis, the admission variable criteria on the modeling process was used, a value of p < 0.20, anchored on the maximum likelihood ratio test. The same test was conducted on the univariate analysis (Hosmer and Lemeshow, 2000). In this way, the β values, which refer to the independent variables, represent an estimate of the Neperian logarithms of the chance, controlling for the remaining variables contained in the model. Using
this analytical tool, the Odds Ratio (OR) is calculated; a
measure of association with the dependent variable, which in this case is the WTP. For an independent dichotomous variable, the OR is expressed by the following equation:
β
=
OR e (3)
When OR equals 1, this indicates that the WTP has equal probability of occurring. When OR is greater than 1 indicates that the chance for the individual to pay is higher. The OR lower than 1, indicates that the chance for the individual to pay is lower (Viera, 2008). The
software Epi Info (version 3.2.1) was used to identify the variables that are statistically significant and also to build
the multivariate logistic regression model.
3.4. Ethics for research
Because the Contingent Valuation Method requires the
use of questionnaires, it involves people and, therefore, an authorisation for the study was necessary. The authorisation was obtained at the Wenceslau Braz School of Nursing’s Research Ethics Committee, at Itajubá-MG, Brazil, an institution authorised by the National Health Council. The authorization was granted under number 547/2010.
4. Results and Discussion
4.1. Sample profile
The interviewees’ age ranged widely, from 20 to 85 years, with an average of 48 and a standard deviation of
18 years. They were also mostly females (59%), and 44%
of the interviewees claimed that they were not employed. This relatively high number of unemployed people can be related to the fact that most of the interviewees were responsible for the domestic activities in the household; they were the ones at home at the time of the interview. When employed, the most common sectors were the industrial, followed by commerce and services. Retired
people and pensioners accounted for 29% of the cases. The
predominant family income ranged from USD 704.76 to
USD 3,037.73 (51%). Families with income below USD 485.43 were 12% those surveyed. Regarding education level, most had finished high school (27%) or, had graduated from university (26%). Only 3% of the interviewed
received no formal education at all. When questioned
about environmental issues, 89% of the interviewees
considered the issues important or very important. This fact might be associated to easier access to information from all kinds of media now available, as well as to some personal experience with adverse environmental impacts.
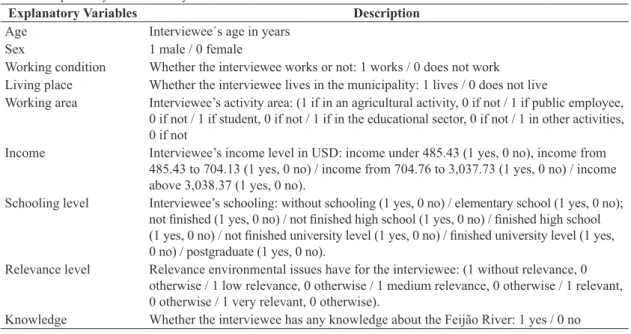
Table 1. Explanatory variables analysed.
Explanatory Variables Description
Age Interviewee´s age in years
Sex 1 male / 0 female
Working condition Whether the interviewee works or not: 1 works / 0 does not work Living place Whether the interviewee lives in the municipality: 1 lives / 0 does not live
Working area Interviewee’s activity area: (1 if in an agricultural activity, 0 if not / 1 if public employee, 0 if not / 1 if student, 0 if not / 1 if in the educational sector, 0 if not / 1 in other activities, 0 if not
Income Interviewee’s income level in USD: income under 485.43 (1 yes, 0 no), income from
485.43 to 704.13 (1 yes, 0 no) / income from 704.76 to 3,037.73 (1 yes, 0 no) / income above 3,038.37 (1 yes, 0 no).
Schooling level Interviewee’s schooling: without schooling (1 yes, 0 no) / elementary school (1 yes, 0 no);
not finished (1 yes, 0 no) / not finished high school (1 yes, 0 no) / finished high school (1 yes, 0 no) / not finished university level (1 yes, 0 no) / finished university level (1 yes, 0 no) / postgraduate (1 yes, 0 no).
Relevance level Relevance environmental issues have for the interviewee: (1 without relevance, 0 otherwise / 1 low relevance, 0 otherwise / 1 medium relevance, 0 otherwise / 1 relevant,
0 otherwise / 1 very relevant, 0 otherwise).
When the interviewees were asked they had any kind
of knowledge about the Feijão River watershed, 67.5% them responded positively. As for the WTP, 56% showed
willingness to pay an additional fee in their water bill in order to direct the collected resources to the watershed environmental protection. From the values presented to the interviewees, the percentage for each bid was, respectively:
USD 0.32 (6%); USD 0.95 (2.5%); USD 1.26 (66%); USD 3.16 (18%); USD 6.32 (3%); USD 12.64 (2%); USD 18.96 and more than USD 18.96 (both with 0%); 2.5% did not
inform the value of the WTP.
Based on the results obtained, it became evident that the bidding-game elicitation technique with the initial bid/point proved to be of little effect stimulating the interviewee’s maximum willingness to pay. The WTP remained anchored to the initial value, that is, the interviewee revealed a strategic behaviour and did not feel stimulated in accepting any value higher than the one initially suggested. This factor may have led to an underestimation of the WTP to be collected.
The main reason given by the interviewees who were
not willing to pay was that they could not afford it (14%).
Other reasons included “preservation in this case should
be the government’s responsibility” (10%) and “I do not trust where these resources are being invested” (6%)
arguments. The argument “I do not have any interest
in environmental protection” was given by only 3% of
the interviewees, indicating an overwhelming interest in environmental protection by the interviewees.
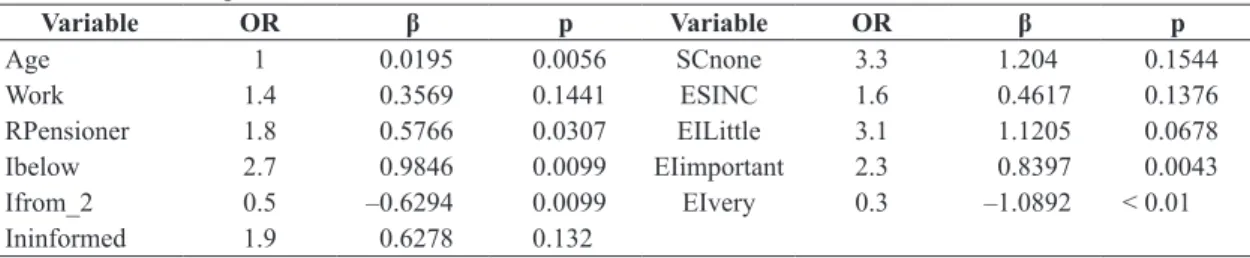
4.2. Logistic regression results
Table 2 shows the results for the univariate analysis, where the OR values are highlighted.
When the OR of variable age equals 1, this means that the WTP has the same probability for all ages. The working interviewees showed 1.4 times more wiliness to pay than those not working. Retired people or pensioners
(RPensioner) showed 1.78 times more williness when
compared with those of other classes considered. The same occurred with interviewees with income below USD 485.43
(Ibelow) and that did not state their income (Ininformed).
These two groups were 2.8 and 1.9 times, respectively, more willing to pay than those with others incomes.
Regarding the schooling level, the interviewees that
did not have any schooling (SCnone) and those that did not finish elementary school (ESINC) presented 3.3 and 1.6 times higher chance to pay, respectively, than those in the other schooling levels considered.
The interviewees that considered environmental issues
of little importance (EILittle) were 3.1 times more willing to
pay when compared to the others. The same happened with the variable “EIimportant”, indicating that the interviewees that considered environmental issues important were 2.3 times more willing to pay than others.
The variable “EIvery” (that refers to people who
consider environmental issues very important) and the
variable “Ifrom_2” (that refers to people with an income
between USD 704.76 and USD 3,037.73) presented OR
lower than 1, indicating a protection factor in relation to the WTP, that is, the interviewees with those characteristics were not willing to pay.
Based on the results presented in Table 2, the multivariate logistic regression model was adjusted by applying the stepwise forward methodology (Hosmer and Lemeshow, 2000), with the inclusion of the variable in descending
order of significance. Table 3 shows the results of this. Given the results in Table 3, the logistic expression was built in order to estimates the probability of the individual
to pay given the significance explanatory variables found:
(
)
(
)
(
)
= = − − +
+
1 0,0575 0,0136
0,5706 _ 2 1,0336( )
Logit Probability Y Age
Ifrom EIvery (4)
When the model was controlled for the variable age,
four scenarios were created (A, B, C and D) based on the
multivariate model. The following describes these scenarios:
• Scenario A: Individuals that consider environmental
issues very important and have income from USD 704.76 to USD 3,037.73;
• Scenario B: Individuals that do not consider
environmental issues very important and have income from USD 704.76 to USD 3,037.73;
• Scenario C: Individuals that consider environmental
issues very important and do not have income from USD 704.76 to USD 3,037.73; and
• Scenario D: Individuals that do not consider
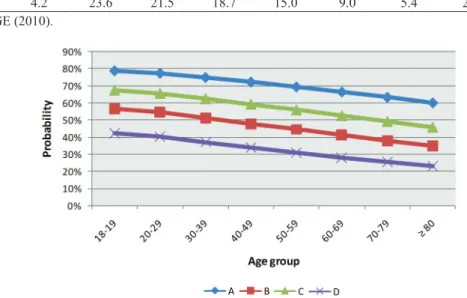
environmental issues very important and do not have income from USD 704.76 to USD 3,037.73. Figure 2 illustrates the scenarios, revealing that the higher the age, the lower the probability for the individual
to pay for the asset being considered, given the significant
explanatory variables used in the model.
The reason for this might be related to recent achievements in environmental education being taught through formal education in schools and also with the
Table 2. Univariate regression results.
Variable OR β p Variable OR β p
Age 1 0.0195 0.0056 SCnone 3.3 1.204 0.1544
Work 1.4 0.3569 0.1441 ESINC 1.6 0.4617 0.1376
RPensioner 1.8 0.5766 0.0307 EILittle 3.1 1.1205 0.0678
Ibelow 2.7 0.9846 0.0099 EIimportant 2.3 0.8397 0.0043
Ifrom_2 0.5 –0.6294 0.0099 EIvery 0.3 –1.0892 < 0.01
Table 3. Multivariate logistic regression results.
Variable OR β p
Age 0.9865 –0.0136 0.067
EIvery 2.8112 1.0336 < 0.01
Ifrom_2 1.7692 0.5706 0.026
Constant - –0.0575 0.9024
Table 4. Population over 18 years old by age ranges.
Age range 18-19 20-29 30-39 40-49 50-59 60-69 70-79 ≥ 80 Total
Population 7,042 39,812 36,255 31,603 25,393 15,166 9,095 4,435 168,801
% 4.2 23.6 21.5 18.7 15.0 9.0 5.4 2.6 100
Source: IBGE (2010).
Figure 2. Probability to pay for scenarios A, B, C and D by age range.
Figure 3. Annual probability to pay by age range.
fact that the younger generations are more aware of environmental problems. Another reason could be that older people might not trust where the resources are being invested and/or by the Brazilian high tax burden, revealing protest and underdevelopment biases, respectively.
Based on the scenarios, the model demonstrates that the highest probability of the individual to pay is in scenario
A, reaching almost 80% for the age range between 18
and 19 years. The lowest probability to pay is that of the individuals belonging to scenario D, presenting, for all
age ranges, a probability lower than 50%.
4.3. WTP estimate
From the 154 (56%) interviewees that showed willingness
The WTP by age ranges is presented in Figure 3, according to the number of inhabitants, for the scenario
with 100% of probability/integral, and for the remaining
scenarios appearing in Figure 1.
The total amount of money for the Whole Scenario is USD 3,930,616.80, for Scenario A is USD 2,842,677.02, for Scenario B is USD 1,905,538.19, for Scenario C is USD 2,349,823.44 and for Scenario D is USD 1,370,635.53.
5. Conclusion
According to the population growth projection carried out by Costa et al. (2012) for the period between 2006 to 2050, the population in São Carlos will increase by
77%, 216,266 to 382,385 inhabitants. This growth will have a direct relation with the municipality´s natural
environmental changes since disorderly urban growth
modifies the environment in an adverse manner. Therefore,
this survey can be used as a guiding instrument in decision making processes for the development of environmental protection policies.
Basead on the results obtained, the population of São Carlos showed environmental concern and would be
willing to pay, annually, for the watershed´s environmental
protection, a total of USD 3,930,616.80, which is equivalent to USD 17,626.09 per ha/year. This amount could be used not only for environmental protection, but also for PES programs, motivating farmers to protect their land by
providing financial compensation for protection.
Finally, the attribution of values to environmental services represents a strategic instrument that should be used in decision making processes. However, this instrument cannot be seen solely as a means to promote environmental
protection by financial resources. Non-financial factors,
entailing different values, such as cultural, altruistic and scenery ones, should also be taken into consideration.
References
ABSON, DJ. and TERMANSEN, M., 2011. Valuing ecosystem services in terms of ecological risks and returns. Conservation Biology: the Journal of the Society for Conservation Biology, vol. 25, no. 2, p. 250-258. PMid:21175826.
ARROW, K., SOLOW, R., PORTNEy, PR., LEAMER, EE., RADNER, R. and SCHUMAN, H., 1993. Report of the NOAA panel on contingent valuation. Natl. Ocean. Atmos. Adm., Damage Assess. Restor. Program, Silver Spring, MD. Federal Register, vol. 58, no. 10, p. 4601-4614.
BARAL, N., STERN, MJ. and BHATTARAI, R., 2008. Contingent valuation of ecotourism in Annapurna conservation area, Nepal: Implications for sustainable park finance and local development. Ecological Economics, vol. 66, no. 2-3, p. 218-227. http://dx.doi. org/10.1016/j.ecolecon.2008.02.004.
Brazil Central Bank – BCB, 2011. Conversão de moedas. Available from: <http://www4.bcb.gov.br/pec/conversao/conversao.asp>. Access in: 14 June 2011.
BOLT, K., RUTA, G. and SARRAF, M., 2005. Estimating the Cost of Environmental Degradation: a Training Manual in
English, French and Arabic. Washington: World Bank. 265 p. Environment Department Papers.
COSTA, CW., DUPAS, FA. and PONS, NAD., 2012. Regulamentos
de uso do solo e impactos ambientais: avaliação crítica do plano
diretor participativo do município de São Carlos, SP. Geociências, vol. 31, no. 2, p. 143-157.
CUNHA, RC., DUPAS, FA. and TUNDISI, JG., 2011. Análise
da influência das variáveis ambientais utilizando inferência fuzzy
e zoneamento das vulnerabilidades: estudo de caso da bacia hidrográfica do Ribeirão do Feijão, São Carlos, SP. Geociências, vol. 30, no. 3, p. 399-414.
DONG, H., KOUyATE, B., CAIRNS, J. and SAUERBORN, R., 2005. Inequality in willingness-to-pay for community-based health insurance. Health Policy, vol. 72, no. 2, p. 149-156. http:// dx.doi.org/10.1016/j.healthpol.2004.02.014. PMid:15802150
DUPAS, FA., SILVA E SOUZA, AT., MATSUMURA-TUNDISI, T., TUNDISI, JG. and RÖHM, SA., 2006. Indicadores ambientais no planejamento e gestão de bacias hidrográficas. In TUNDISI,
JG.,TUNDISI, TM. and GALLI, CS. (Eds.). Eutrofização
na América do Sul: causas, conseqüências e tecnologias de gerenciamento e controle. São Carlos: Instituto Internacional de Ecologia e Gerenciamento Ambiental. p. 491-506.
FONTA, WM., ICHOKU, HE., OGUJIUBA, KK. and CHUKWU, JO., 2007. Using a contingent valuation approach for improved solid waste management facility: evidence from Enugu State, Nigeria. Journal of African Economies, vol. 17, no. 2, p. 277-304. http://dx.doi.org/10.1093/jae/ejm020.
GIL, AC., 2008. Métodos e técnicas de pesquisa social. 6. ed. São Paulo: Atlas. 200 p.
HOSMER, DW. and LEMESHOW, S., 2000. Applied logistic regression. 2nd. ed. New york: John Wiley & Sons. 375p. http:// dx.doi.org/10.1002/0471722146.
Instituto Brasileiro de Geografia e Estatística - IBGE, 2010. Censo demográfico 2010. Available from: <http://www.censo2010.ibge. gov.br>. Access in: 7 May 2011.
JONES, N., SOPHOULIS, CM. and MALESIOS, C., 2008. Economic valuation of coastal water quality and protest responses: a case study in Mitilini, Greece. Journal of Socio-Economics, vol. 37, no. 6, p. 2478-2491. http://dx.doi.org/10.1016/j.socec.2007.06.002.
KAFFASHI, S., SHAMSUDIN, MN., RADAM, A., RAHIM, KA., yACOB, MR., MUDA, A. and YAZID, M., 2011. Economic valuation of shadegan international wetland, Iran: notes for conservation. Regional Environmental Change, vol. 11, no. 4, p. 925-934. http://dx.doi.org/10.1007/s10113-011-0225-x.
KARTMAN, B., ANDERSSON, F. and JOHANNESSON, M., 1996. Willingness to pay for reductions in angina pectoris attacks. Medical Decision Making: an International Journal of the Society for Medical Decision Making, vol. 16, no. 3, p. 248-253. http://
dx.doi.org/10.1177/0272989X9601600309. PMid:8818123
KLEINBAUM, DG., KUPPER, LL., MULLER, KE. and NIZAM, A., 1998. Applied regression analysis and other multivariable methods. 3rd. ed. California: Duxbury Pess. 816 p.
LIU, S., COSTANZA, R., FARBER, S. and TROy, A., 2010.
Valuing ecosystem services: theory, practice, and the need for a
LóPEZ-MOSqUERA, N. and SáNChEZ, M., 2011.The influence of personal values in the economic-use valuation of peri-urban green spaces: an application of the means-end chain theory. Tourism Management, vol. 32, no. 4, p. 875-889. http://dx.doi. org/10.1016/j.tourman.2010.08.003.
MACHADO, FH. and DUPAS, FA., 2012. Análise econômica
do uso do solo e da disposição a pagar para proteção ambiental
dos recursos hídricos da bacia hidrográfica do manancial do Ribeirão do Feijão, São Carlos - SP. Geousp, vol. 33, p. 111-126.
MARTINELLI, LA. and FILOSO, S., 2009. Balance between food production, biodiversity and ecosystem services in Brazil: a challenge and an opportunity. Biota Neotropica, vol. 9, no. 4, p. 21-25. http://dx.doi.org/10.1590/S1676-06032009000400001.
MCFADDEN, D., 1994. Contingent valuation and social choice. American Journal of Agricultural Economics, vol. 76, no. 4, p. 689-708. http://dx.doi.org/10.2307/1243732.
MENDELSOHN, R. and OLMSTEAD, S., 2009. The economic valuation of environmental amenities and disamenities: methods and applications. Annual Review of Environment and Resources, vol. 34, no. 1, p. 325-347. http://dx.doi.org/10.1146/annurev-environ-011509-135201.
NOTARO, S. and PALETTO, A., 2011. Links between mountain communities and environmental services in the Italian Alps. Sociologia Ruralis, vol. 51, no. 2, p. 137-157. http://dx.doi. org/10.1111/j.1467-9523.2011.00532.x.
PAGIOLA, S., RIOS, AR. and ARCENAS, A., 2010. Poor household participation in payments for environmental services: lessons from
the silvopastoral project in quindío, Colombia. Environmental and Resource Economics, vol. 47, no. 3, p. 371-394. http://dx.doi. org/10.1007/s10640-010-9383-4.
SALE, MC., HOSKING, SG. and DU PREEZ, M., 2009. Application of the contingent valuation method to estimate a
recreational value for the freshwater inflows into the Kowie and the Kromme Estuaries. Water S.A., vol. 35, no. 3, p. 261-270.
São Paulo (Estado). Secretaria do Meio Ambiente. Coordenadoria
de Recursos Hídricos, 2009. Situação dos recursos hídricos no Estado de São Paulo: ano base 2007. São Paulo. 149 p.
SILVA, RG. and LIMA, JE., 2004. Valoração contingente do
parque Chico Mendes: uma aplicação probabilística do método
referendum com biddinggames. Revista de Economia e Sociologia Rural, vol. 42, no. 4, p. 685-708. http://dx.doi.org/10.1590/S0103-20032004000400008.
TUNDISI, JG. and MATSUMURA-TUNDISI, T., 2010. Impactos
potenciais das alterações do Código Florestal nos recursos
hídricos. Biota Neotropica, vol. 10, no. 4, p. 67-75. http://dx.doi. org/10.1590/S1676-06032010000400010.
TUNDISI, JG., MATSUMURA-TUNDISI, T., PARESCHI, DC.,
LUZIA, AP., VON hAELING, PH. and FROLLINI, EH., 2008.
A bacia hidrográfica do Tietê/Jacaré: estudo de caso em pesquisa
e gerenciamento. Estudos Avançados, vol. 22, no. 63, p. 159-172. http://dx.doi.org/10.1590/S0103-40142008000200010.
TUNDISI, JG., TUNDISI, MT., DUPAS, FA., SOUZA, ATS. and SHIBATTA, OA., 2007. Uso atual e potencial do solo no município de São Carlos, SP: base do planejamento urbano e rural. São Carlos: Instituto Internacional de Ecologia. FAPESP Relatório Final de Projeto de Políticas Públicas. Processo 98/10924-3.
TURNER, RK., MORSE-JONES, S. and FISHER, B., 2010. Ecosystem valuation: a sequential decision support system and quality assessment issues. Annals of the New York Academy of Sciences, vol. 1185, no. 1, p. 79-101. http://dx.doi.org/10.1111/ j.1749-6632.2009.05280.x. PMid:20146763