Biomarkers of Inflammation and Axonal
Degeneration/Damage in Patients with
Newly Diagnosed Multiple Sclerosis:
Contributions of the Soluble CD163 CSF/
Serum Ratio to a Biomarker Panel
Morten Stilund
1,3*
, Mikkel Carstensen Gjelstrup
3, Thor Petersen
1, Holger Jon M
ø
ller
2,
Peter Vestergaard Rasmussen
1, Tove Christensen
31Department of Neurology, Aarhus University Hospital, Nørrebrogade 44, DK-8000 Aarhus C, Denmark,
2Department of Clinical Biochemistry, Aarhus University Hospital, Nørrebrogade 44, DK-8000 Aarhus C, Denmark,3Department of Biomedicine, Bartholin Building, Wilhelm Meyers Allé 4, Aarhus University, DK-8000 Aarhus C, Denmark
Abstract
Background
Expression of soluble CD163 (sCD163), a macrophage/microglia biomarker, is increased
in inflammatory conditions, and sCD163 levels in the cerebrospinal fluid (CSF) have
recent-ly been shown to be elevated in patients with multiple sclerosis (MS): the sCD163 CSF/
serum ratio was elevated in patients with relapsing-remitting MS (RRMS), primary
progres-sive MS (PPMS), and clinically isolated syndrome (CIS) compared with symptomatic
controls.
Objective
To investigate the contributions of the sCD163 CSF/serum ratio to a biomarker panel
focus-ing on inflammation and axonal degeneration in newly diagnosed MS; thus optimisfocus-ing a
di-agnostic biomarker panel for MS.
Methods
After a full MS diagnostic work-up, including collection of paired samples of CSF and
serum, 125 patients were included in this study. Patients were divided into groups based on
their diagnosis, and patients with normal clinical and paraclinical findings were defined as
symptomatic controls. Serum and CSF levels, ratios, and indices of sCD163, CXCL13,
osteopontin, neopterin, and CSF levels of neurofilament light polypeptide were determined
by enzyme-linked immunosorbent assays (ELISAs). For sCD163 the results constitute a
post-hoc analysis of already published data.
a11111
OPEN ACCESS
Citation:Stilund M, Gjelstrup MC, Petersen T, Møller HJ, Rasmussen PV, Christensen T (2015) Biomarkers of Inflammation and Axonal Degeneration/Damage in Patients with Newly Diagnosed Multiple Sclerosis: Contributions of the Soluble CD163 CSF/Serum Ratio to a Biomarker Panel. PLoS ONE 10(4): e0119681. doi:10.1371/ journal.pone.0119681
Academic Editor:Markus Reindl, Medical University of Innsbruck, AUSTRIA
Received:July 11, 2014
Accepted:January 15, 2015
Published:April 10, 2015
Copyright:© 2015 Stilund et al. This is an open access article distributed under the terms of the
Creative Commons Attribution License, which permits unrestricted use, distribution, and reproduction in any medium, provided the original author and source are credited.
Data Availability Statement:All relevant data are within the paper and its Supporting Information files.
Funding:This study was funded by The Danish Multiple Sclerosis Society, grant number(s): 8990 and
14567, funder URL:http://scleroseforeningen.dk/, The
Riisfort Foundation, grant no. 15399, URL:http://
www.riisfort.dk/riisfort-fonden/, the Aase and Einar
Danielsen’s Foundation; grant no 904587; URL:
http://www.danielsensfond.dk/, The Jascha
Results
All tested biomarkers, notably the sCD163 ratio, the CXCL13 ratio, the NEO ratio, the CSF
level of NfL, the IgG index, and the serum level of OPN, were significantly correlated to
RRMS, PPMS, and/or CIS. The individual biomarkers in single tests had a lower
perfor-mance than the IgG index, however, their combined receiver operating characteristic (ROC)
curve demonstrated excellent diagnostic discriminatory power.
Conclusion
The biomarker panel showed distinct profiles for each patient group and could be a valuable
tool for clinical differentiation of MS subgroups. The combined ROC analysis showed that
sCD163 contributes positively as a diagnostic marker to a panel of established MS
biomark-ers. Patients with PPMS were demonstrated to have significantly elevated levels of both
in-flammatory and degenerative markers.
Introduction
Multiple sclerosis (MS) is the most common demyelinating disease of the central nervous
sys-tem (CNS) in young adults. The cause of the disease is unknown, yet it is generally assumed to
be complex interactions between environmental factors and genetic susceptibility [1–3]. At the
time of diagnosis, the disease course of patients with MS is characterized by either being
remit-ting-relapsing (RRMS) or progressive: primary progressive MS (PPMS)—or in some cases with
previous attacks, secondary progressive MS (SPMS). Patients with clinically isolated syndrome
(CIS) often progresses to MS (approximately 85%) [4]. Currently, MS diagnostic workup
con-sists of an anamnestic support for spreading of neurological symptoms in time and space, MRI
findings, and CSF/serum biomarkers such as an increased IgG index. A pathognomonic
bio-marker for MS has never been identified, yet substantial effort has been put into testing
candi-date molecules in various body fluids from patients. Several different molecules have been
suggested as potential diagnostic biomarkers, but they still need to be validated in patient
co-horts [5–9]. As suggested in previous reviews, the research in the field of MS biomarkers should
be directed towards earlier and more accurate diagnosis to initiate disease modifying therapy
[10–12].
A characteristic feature of MS lesions (plaques) is the abundant presence of macrophages in
all types (I-IV) of MS lesions [13]. Macrophages are components of the innate immune system
and as tissue specific cells in the CNS, their functions are multifaceted, ranging from
pro-inflammatory and antigen presenting (M1 pathway) to anti-pro-inflammatory and growth
promot-ing (M2 pathway) [14,
15]. Both pro- and anti- inflammatory macrophages as well as
interme-diate stages have been shown to be present in active MS lesions [16,
17].
We have recently demonstrated a significant association between levels of the sCD163 CSF/
serum ratio (sCD163 ratio) and MS/CIS [18]. Here, in the same patient cohort, we present
fur-ther analyses on serum and CSF to evaluate the diagnostic contributions of sCD163 and the
sCD163 ratio to a panel of established biomarkers focusing on inflammation and axonal
dam-age. The biomarkers chosen for the present study were sCD163, CXCL13, neopterin (NEO),
neurofilament light polypeptide (NfL), and osteopontin (OPN). This selection of biomarkers
was based on previously published reports [9,
17–54] using the following criteria: 1) known
MS diagnostic properties, 2) association with macrophage activity, and 3) detectability in CSF
jaschafonden.dk/, and the Dagmar Marshalls Fond,grant no. N/A URL: N/A (it is a small Danish Foundation; applications via solicitor Oluf Engell; Bruun & Hjejle; Amagertorv 24 ; 1160 KøbenhavnK). HJM and Aarhus University have received royalties from IQ-products, NL. The funders had no role in study design, data collection and analysis, decision to publish, or preparation of the manuscript.
Competing Interests:This study was funded by The Danish Multiple Sclerosis Society, grant
number(s): 8990 and 14567, funder URL:http://
scleroseforeningen.dk/, The Riisfort Foundation, grant no. 15399, URL:http://www.riisfort.dk/riisfort-fonden/,
the Aase and Einar Danielsen’s Foundation; grant no
904587, URL:http://www.danielsensfond.dk/, The
Jascha Foundation, grant no. 3099 URL:http://www.
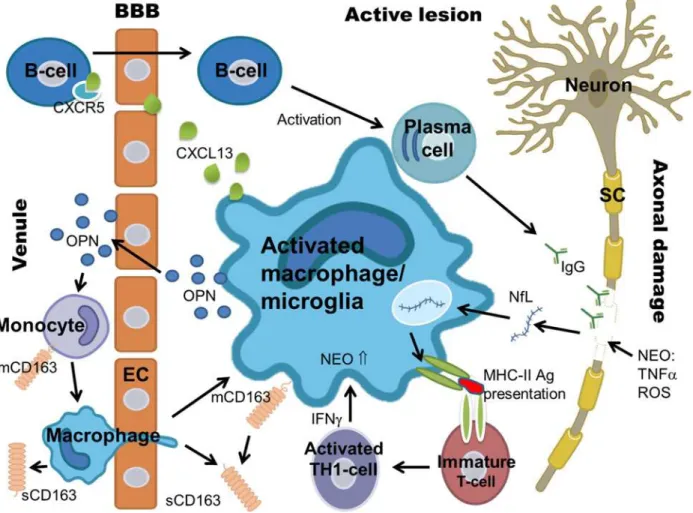
and/or serum by means of a previously validated quantifying method. Biomarkers and their
characteristics are listed in
table 1
and shown in
Fig 1.
Objectives
The objectives of the present study were to investigate the contributions of the sCD163 ratio to
a biomarker panel focusing on inflammation and axonal degeneration in patients with newly
diagnosed MS. The study was performed on a large cohort of patients diagnosed with remitting
relapsing MS (RRMS), primary progressive MS (PPMS), or clinically isolated syndrome (CIS).
All cases were compared with a group of symptomatic controls (SC) [55]. The applicability of
these biomarkers in MS diagnostics, individually and collectively, was evaluated.
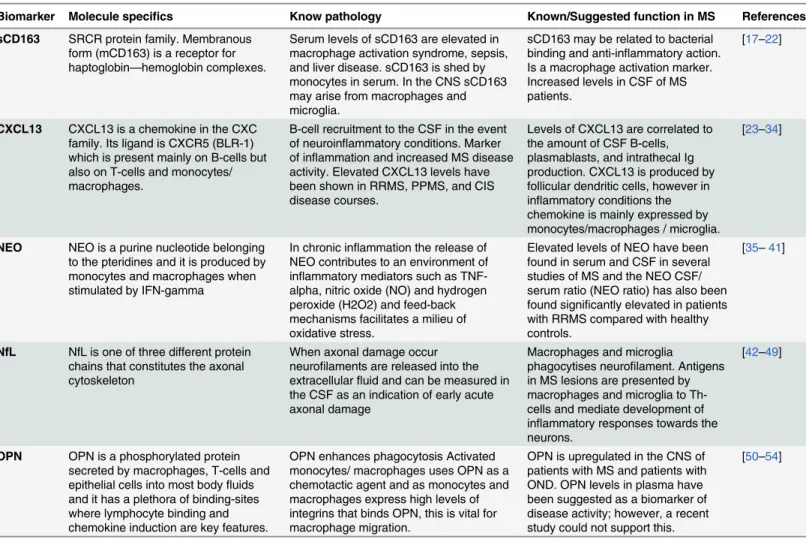
Table 1. Biomarkers and their characteristics.
Biomarker Molecule specifics Know pathology Known/Suggested function in MS References
sCD163 SRCR protein family. Membranous form (mCD163) is a receptor for haptoglobin—hemoglobin complexes.
Serum levels of sCD163 are elevated in macrophage activation syndrome, sepsis, and liver disease. sCD163 is shed by monocytes in serum. In the CNS sCD163 may arise from macrophages and microglia.
sCD163 may be related to bacterial binding and anti-inflammatory action. Is a macrophage activation marker. Increased levels in CSF of MS patients.
[17–22]
CXCL13 CXCL13 is a chemokine in the CXC family. Its ligand is CXCR5 (BLR-1) which is present mainly on B-cells but also on T-cells and monocytes/ macrophages.
B-cell recruitment to the CSF in the event of neuroinflammatory conditions. Marker of inflammation and increased MS disease activity. Elevated CXCL13 levels have been shown in RRMS, PPMS, and CIS disease courses.
Levels of CXCL13 are correlated to the amount of CSF B-cells, plasmablasts, and intrathecal Ig production. CXCL13 is produced by follicular dendritic cells, however in inflammatory conditions the chemokine is mainly expressed by monocytes/macrophages / microglia.
[23–34]
NEO NEO is a purine nucleotide belonging to the pteridines and it is produced by monocytes and macrophages when stimulated by IFN-gamma
In chronic inflammation the release of NEO contributes to an environment of inflammatory mediators such as TNF-alpha, nitric oxide (NO) and hydrogen peroxide (H2O2) and feed-back mechanisms facilitates a milieu of oxidative stress.
Elevated levels of NEO have been found in serum and CSF in several studies of MS and the NEO CSF/ serum ratio (NEO ratio) has also been found significantly elevated in patients with RRMS compared with healthy controls.
[35–41]
NfL NfL is one of three different protein chains that constitutes the axonal cytoskeleton
When axonal damage occur neurofilaments are released into the extracellularfluid and can be measured in the CSF as an indication of early acute axonal damage
Macrophages and microglia
phagocytises neurofilament. Antigens in MS lesions are presented by macrophages and microglia to Th-cells and mediate development of inflammatory responses towards the neurons.
[42–49]
OPN OPN is a phosphorylated protein secreted by macrophages, T-cells and epithelial cells into most bodyfluids and it has a plethora of binding-sites where lymphocyte binding and chemokine induction are key features.
OPN enhances phagocytosis Activated monocytes/ macrophages uses OPN as a chemotactic agent and as monocytes and macrophages express high levels of integrins that binds OPN, this is vital for macrophage migration.
OPN is upregulated in the CNS of patients with MS and patients with OND. OPN levels in plasma have been suggested as a biomarker of disease activity; however, a recent study could not support this.
[50–54]
Table 1 shows the biomarkers analyzed in the study and their characteristics. Abbreviations: sCD163 (soluble CD163), mCD163 (membrane bound CD163), NEO (neopterin), NfL (neurofilament light polypeptide), OPN (osteopontin), Th-cells (T helper cells), MS (multiple sclerosis), CSF (cerebrospinal fluid).
Materials and Methods
Ethics statement
The study was conducted in accordance with the Ethical Declaration of Helsinki and all
pa-tients gave written, informed consent. The study and the material for informed consent were
approved by The Central Denmark Region Committee on Biomedical Research Ethics (journal
number: 20090210).
Patient cohort
evaluated according to the revised MacDonald criteria [56] and an EDSS (extended disability
status scale) score was assessed according to Kurtzke [57]. Mean total number of MRI white
matter lesions (presented in
table 2) were registered by fluid-attenuated inversion recovery
(FLAIR) sequences on MRI.
In total 183 patients agreed to participate in this study and in accordance with consensus
guidelines [58] serum and CSF samples were collected and frozen at -70°C. After aliquotation,
all analyses were performed immediately after thawing of the aliquots and no samples were
subjected to further freeze-thaw cycles. Demographics and paraclinical findings are
summa-rised in
table 2.
This patient cohort was also the cohort in the recent study of sCD163 levels and
macro-phage activity in MS [18]. In the present study five patients from the original cohort were
ex-cluded: four patients with SPMS (as these were too few to be representative for this MS
subgroup) and one patient with RRMS (due to lack of sample material). None of the patients in
the cohort received methylprednisolone or other immune-modulating therapeutics for at least
a month before the time of sampling.
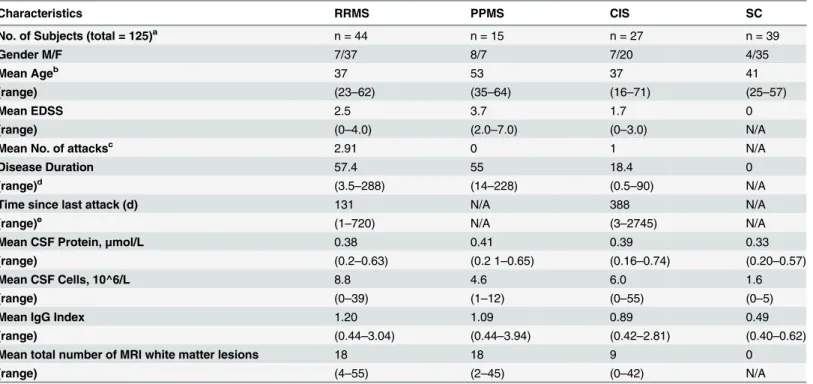
Table 2. Demographic and clinical data of the patients with MS/CIS and SC.
Characteristics RRMS PPMS CIS SC
No. of Subjects (total = 125)a n = 44 n = 15 n = 27 n = 39
Gender M/F 7/37 8/7 7/20 4/35
Mean Ageb 37 53 37 41
(range) (23–62) (35–64) (16–71) (25–57)
Mean EDSS 2.5 3.7 1.7 0
(range) (0–4.0) (2.0–7.0) (0–3.0) N/A
Mean No. of attacksc 2.91 0 1 N/A
Disease Duration 57.4 55 18.4 0
(range)d (3.5
–288) (14–228) (0.5–90) N/A
Time since last attack (d) 131 N/A 388 N/A
(range)e (1–720) N/A (3–2745) N/A
Mean CSF Protein,μmol/L 0.38 0.41 0.39 0.33
(range) (0.2–0.63) (0.2 1–0.65) (0.16–0.74) (0.20–0.57)
Mean CSF Cells, 10^6/L 8.8 4.6 6.0 1.6
(range) (0–39) (1–12) (0–55) (0–5)
Mean IgG Index 1.20 1.09 0.89 0.49
(range) (0.44–3.04) (0.44–3.94) (0.42–2.81) (0.40–0.62)
Mean total number of MRI white matter lesions 18 18 9 0
(range) (4–55) (2–45) (0–42) N/A
Table 2 shows the demographics and clinical data of the patient cohort. These demographic and clinical data are essentially as previously presented [18].
aRefers to the patients included.
bAge (in years) refers to age at the time of sampling.
cMean number of attacks: mean number of attacks before the sampling time point. dDisease duration (in months): the period of time from debut of
first symptom(s) to the sampling time point.
eTime since last attack: the period of time (in days) from latest attack to the sampling time point.
Mean total number of MRI white matter lesions were registered byfluid-attenuated inversion recovery (FLAIR) sequences on MRI. Abbreviations: RRMS (relapsing-remitting MS), PPMS (primary-progressive MS), CIS (clinically isolated syndrome), SC (symptomatic controls), N/A (not applicable or available), n (number of persons), EDSS (Expanded Disability Status Scale), CSF (cerebrospinalfluid).
ELISA analyses
Levels of sCD163 were analysed by ELISA as previously described [59]. In brief, rabbit
anti-CD163 (2 mg/L, SK Moestrup Aarhus University) was coated into microtitre wells and serum
samples (diluted 1:101) or CSF samples (diluted 1:4) were added and incubated for 1 h at RT.
Monoclonal anti-CD163 (clone number: GHI/61.3
μg/mL) was added followed by incubation
for 1 h at RT with horseradish peroxidase-labelled goat anti-mouse antibodies (0.125
μg/mL;
Dako, Glostrup, Denmark).
Levels of CXCL13, NEO, and OPN were analysed in both serum and CSF and levels of NfL
were only analysed in CSF by enzyme-linked immunosorbent assay (ELISA) following the
in-structions given by the manufacturers. The available kits for NfL at the time of analysis were
re-stricted to be used only with CSF. Samples were run in duplicates and a coefficient of variation
(CV) was calculated, accepting only values
15%. Intra assay variations were calculated from
six individual measurements of a known standard on each plate and values
15% were
accept-ed (ranges: CXCL13 (2.02–8.57), NEO (3.54–13.67), NF-Light (0.58–5.94%), and OPN (2.00–
9.80%)). Samples with values exceeding the highest point of the standard curve were diluted
and reanalysed. The diagnoses were established before the results of the sCD163 analyses were
received. For the other four biomarkers each plate contained 36 randomly selected samples,
and each sample were labelled with a study ID and assayed in a manner blinded to the clinical
status of the patients.
CXCL13 levels (R&D Systems, Minneapolis, DCX130) were measured in a competitive
ELISA assay by adding 100
μL assay diluent and 50
μL of sample to each well, followed by a two
hour incubation period. After 4 × wash, 200
μL of conjugate (mAb-HPR) were added, followed
by two hours incubation. After 4 × wash, 200
μL substrate solution (TMB) were added and the
plate was incubated for 30 min protected from light. Finally, 50
μL of stop solution (H2SO4)
were added and the absorbance was measured on an ELISA plate reader (Thermo Scientific,
Multiscan FC) at 450 and 540 nm. Concentrations were calculated by linear regression in Excel.
NEO levels (IBL Int. GMBH, Hamburg, RE59321) were measured by adding 100
μL enzyme
conjugate (NEO), 20
μL of sample and 50
μL of NEO antiserum (pAb-HPR) to each well,
fol-lowed by a 90 min incubation period. After 4 × wash, 150
μL of substrate solution (TMB) were
added and the plate was incubated for 10 min protected from light. Finally, 150
μL of stop
solu-tion (H2SO4) were added and the absorbance was measured on an ELISA plate reader (Thermo
Scientific, Multiscan FC) at 450 and 620 nm. Concentrations were calculated by 4-parametric
statistical regression in GraphPad Prism.
NfL (NF-light) (UmanDiagnostics, Umea, UD51001) levels were measured by adding 50
μL
sample dilution buffer and 50
μL of sample to each well, followed by one hour incubation.
After 3 × wash, 100
μL of tracer (mAb) were added, followed by 45 min incubation. After
3 × wash, 100
μL conjugate (HPR) were added and the plate was incubated for 30 min. After
3 × wash, 100
μL substrate solution (TMB) were added and the plate was incubated for 15 min
protected from light. Finally, 50
μL of stop solution (H2SO4) were added and the absorbance
was measured on an ELISA plate reader (Thermo Scientific, Multiscan FC) at 450 and 540 nm.
Concentrations were calculated by 4-parametric statistical regression in GraphPad Prism.
OPN levels (R&D Systems, Minneapolis, DOST00) were measured by adding 100
μL assay
diluent and 50
μL of sample (diluted 1:25) to each well, followed by a two hour
incubation period.
and 540 nm. Concentrations were calculated by 4-parametric statistical regression in
Graph-Pad Prism.
The manufacturer comments that OPN levels in serum are validated but may be reduced as
a consequence of proteolytic cleavage during clotting.
Collection of data and statistical analysis
Data were stored and handled according to the Danish law on personal data. During collection
of demographic and biochemical data we used the Electronic Patient Journal (EPJ).
Descrip-tions of MRI data was conducted by a neuro-radiologist and confirmed by a senior neurologist
who viewed all scans in the IMPAX system at the Department of Neurology, AUH.
For data collection we used Microsoft Excel and all statistical analysis was performed using
STATA12. Please see Figure A in
S1 Dataset
for full data. Spearman correlation was used to
cor-relate variables that were on an ordinal scale and Pearson pairwise correlation analyses were used
to correlate continuous variables. This was done to identify, firstly, biomarkers that were
correlat-ed to age and or gender so that these could be adjustcorrelat-ed for in our regression analysis. Secondly,
correlations were performed to identify whether biomarkers were correlated to CIS/MS groups
and thirdly, whether there was any biomarker intercorrelation. Please see tables B—AA in
S1
Dataset
for STATA coding and output. Since biomarkers in CSF and serum were positively
skewed, we performed correlation and regression analyses on LOG-transformed data, except the
intercorrelation analysis that was performed without the LOG-transformation. Only biomarkers
that correlated significantly to CIS, RRMS or PPMS were included in the regression analysis,
table AB in
S1 Dataset. The geometric means (GM) of the SC group were used as baseline and
the difference is presented in fold with 95% confidence intervals (95%CI) and p-values [60].
For calculations of ratios (i.e. sCD163 ratio) the CSF concentration was divided by the
serum concentration, and indices were calculated by dividing the biomarker CSF/serum ratio
by the albumin ratio.
The receiver operating characteristic (ROC) analyses were performed for the variables that
were most significantly different from the SC group in the regression analysis. The parameter
results for patients with RRMS, PPMS, and CIS are combined as true positives and plotted
against SC as true negatives. A logistic regression analysis was performed for the combined
di-agnostic properties for each biomarker and the IgG index, and the entire biomarker panel
in-cluding the IgG index [61]. For a view on the data generated please see tables AC and AD in
S1
Dataset
for STATA do-files and output.
Results
sCD163
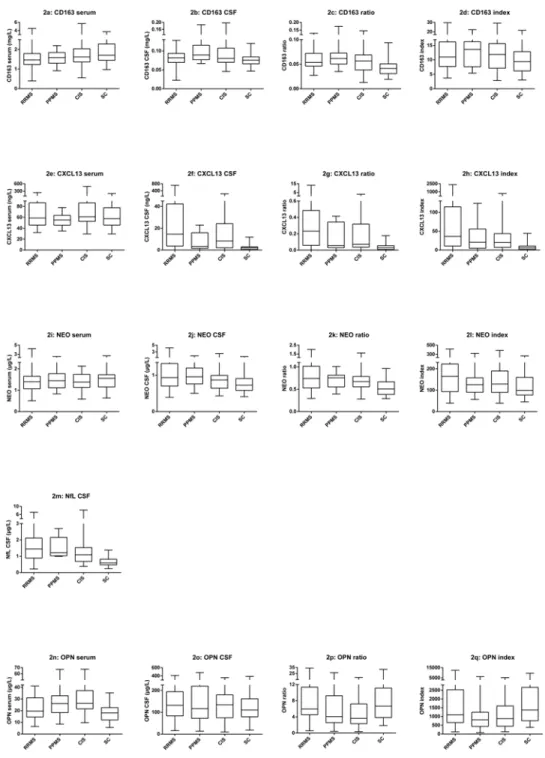
Soluble CD163 was detectable in CSF and serum from all individuals, as reported in [18]. The
sCD163 levels, ratio and index values are presented in
Fig 2a–2d. Median levels and ranges are
also presented in
table 3. Median serum levels of sCD163 for the patients with RRMS, PPMS,
and CIS were somewhat lower than for the SC group. However, the sCD163 ratio was elevated,
particularly for the patients with PPMS. For the SC group the median level of sCD163 in serum
was 1.70 mg/L (range 0.97–3.73 mg/L). This corresponds well with the sCD163 serum
refer-ence interval for healthy subjects (0.7–3.9 mg/L) [21].
CXCL13
Fig 2. Box plots of sCD163, CXCL13, NEO, NfL, and OPN.Fig 2 shows box plots of all biomarkers including CSF and serum concentrations as well as ratios and index values. The box plots show levels of all the parameters for each group, RRMS, PPMS, CIS and SC. The horizontal line in each box is the median, whiskers fences the upper and lower quartiles. The data on sCD163 have previously been presented in [18]. Fig 2a–2d shows the values for sCD163, Fig 2e–2h shows the values for CXCL13, Fig 2i–2l shows the values
for NEO, Fig 2m shows the values for NfL CSF, and Fig 2n–2qshows the values for OPN. For all biomarkers,
there were some overlaps in levels between patient groups, and symptomatic controls. Abbreviations: RRMS (relapsing-remitting MS), PPMS (primary-progressive MS), CIS (clinically isolated syndrome), SC
(symptomatic controls), CSF (cerebrospinal fluid), sCD163 (soluble CD163), NEO (neopterin), NfL (neurofilament light polypeptide), OPN (osteopontin).
samples from five patients from the SC group. For calculating statistics the lower detection
limit of the assay (0.0016
μg/L) was used where concentrations of proteins were below the
lower detection limit. The CXCL13 levels, ratio and index values are presented in
Fig 2e–2h.
Median levels and ranges are also presented in
table 3. The CXCL13 levels in the CSF were
highly elevated for the patients with RRMS (particularly), PPMS and CIS, compared with the
Table 3. Median levels and range of biomarkers in serum and CSF samples as determined by ELISA, for the patient groups.Characteristics RRMS PPMS CIS SC
No. of Subjects (total = 129) n = 44 n = 15 n = 27 n = 39
Serum sCD163 mg/L 1.45 1.58 1.62 1.70
(range) (0.39–4.53) (0.92–2.2) (0.55–5.71) (0.97–3.73)
CSF sCD163 mg/L 0.082 0.089 0.081 0.076
(range) (0.023–0.128) (0.067–0.187) (0.046–0.197) (0.047–0.120)
sCD163 ratio 0.054 0.062 0.057 0.041
(range) (0.027–0.129) (0.035–0.174) (0.013–0.145) (0.019–0.094)
sCD163 index 10.1 13.6 11.9 9.4
(range) (3.7–29.7) (5.4–22.4) (2.9–29.2) (3.0–21.7)
Serum CXCL13μg/L 58.7 55.1 61.0 57.48
(range) (32.1–242.1) (34.9–77.8) (29.6–493.9) (29.5–201.4)
CSF CXCL13μg/L 14.6 3.3 8.2 2.1
(range) (0.0016–711.2) (0.0016–22.9) (0.0016–231.4) (0.0016–11.8)
CXCL13 ratio .233 0.051 0.072 .015
(range) (0.00004–13.32) (0.00002–0.41) (0.00002–3.10) (0.00002–0.18)
CXCL13 index 36.1 20.4 19.9 5.9
(range) (0.0066–2343.7) (0.0030–123.7) (0.0027–678.8) (0.0034–44.2)
Serum NEO mg/L 1.397 1.444 1.380 1.557
(range) (0.501–4.245) (0.831–2.529) (.585–2.128) (.634–2.696)
CSF NEO mg/L .934 .956 .869 .724
(range) (.390–4.223) (.502–1.856) (0.431–2.52) (0.41–1.64)
NEO ratio 0.743 0.756 0.672 0.505
(range) (0.293–2.014) (0.393–1.010) (0.280–1.607) (0.29–0.964)
NEO index 165 126 128 99
(range) (39–416) (57–320) (39–386) (45–264)
CSF NfLμg/L 1.447 1.219 1.091 0.591
(range) (0.218–7.123) (0.996–2.7) (0.38–8.209) (0.233–1.376)
Serum OPNμg/L 19.54 26.06 26.23 18.05
(range) (6.49–41.09) (8.49–67.25) (9.76–67.49) (5.54–35.15)
CSF OPNμg/L 131.98 116.92 134.41 110.32
(range) (15.93–409.97) (13.53–482.21) (9.48–356.70) (18.49–387.53)
OPN ratio 5.94 4.07 3.64 6.64
(range) (0.56–34.05) (0.41–26.41) (0.34–18.45) (1.86–31.91)
OPN index 1094 810 1367 1072
(range) 125–12484 70–6213 127–5254 376–9572
Table 3 shows the median levels of sCD163, CXCL13, NEO, and OPN in serum, CSF, ratio, and index. Index formula: (Biomarker ratio / Albumin ratio). NfL has only been examined in CSF. Abbreviations: RRMS (relapsing-remitting MS), PPMS (primary-progressive MS), CIS (clinically isolated syndrome), SC (symptomatic controls), n (number of subjects), CSF (cerebrospinalfluid) sCD163 (soluble CD163), NEO (neopterin), NfL (neurofilament light polypeptide), OPN (osteopontin). The data on sCD163 have previously been presented in [18].
SC group. For the SC group the median level of CXCL13 in serum was 57.48
μg/L (range 29.5–
201.4
μg/L).
Neopterin (NEO)
NEO was detectable in CSF and serum from all individuals. The NEO levels, ratio and index
values are presented in
Fig 2i–2l. Median levels and ranges are also presented in
table 3. In a
pattern similar to that of sCD163, median serum levels of NEO for the patients with RRMS,
PPMS, and CIS were somewhat lower than for the SC group. However, the NEO ratio was
ele-vated, particularly for the patients with PPMS. For the SC group the median level of NEO in
serum was 1.56
μg/L (range 0.634–2.696
μg/L).
Neurofilament light polypeptide (NfL)
NfL was detectable in CSF from all individuals. The NfL CSF levels are shown in
Fig 2m. Median
levels and ranges are also presented in
table 3. The levels of NfL CSF were elevated for the
pa-tients with RRMS, PPMS and notably also for the papa-tients with CIS, as compared with the SC
group. For the SC group the median level of NfL CSF was 0.59 mg/L (range 0.233–1.376
μg/L).
Osteopontin (OPN)
OPN was detectable in CSF and serum from all individuals. The OPN levels, ratio and index
values are presented in
Fig 2n–2q. Median levels and ranges are also presented in
table 3.
Inter-estingly, OPN levels in serum for the patients with RRMS, PPMS, and for the patients with
CIS, were elevated compared with the SC group. For the SC group the median level of OPN in
serum was 18.05
μg/L (range 5.54–35.15
μg/L).
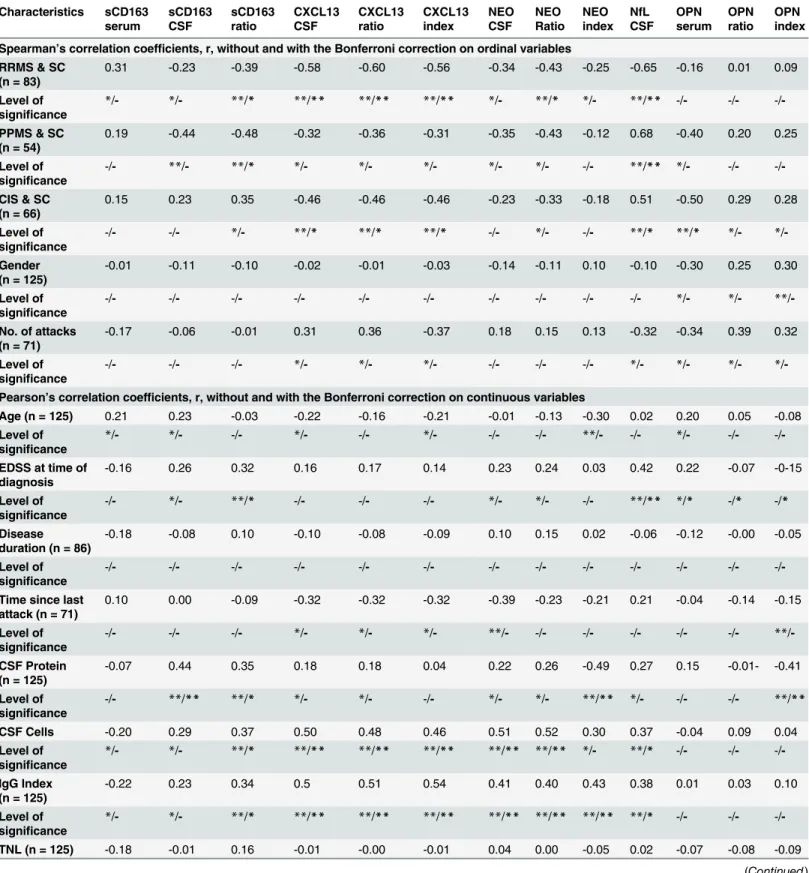
Correlation analysis
Spearman and Pearson correlation analyses for the biomarkers are presented without and with
the Bonferroni correction in
table 4. Biomarker variables that were correlated (r
>
20; see
table 4)
to gender or age were adjusted accordingly in the linear regression analysis.
Patients in the PPMS group were significantly older than patients in the RRMS, CIS and SC
groups; and levels of sCD163 in both serum and CSF were found to correlate with age, however
this was not the case for the sCD163 ratio.
The levels of sCD163 in serum and CSF were not significantly correlated to gender or any of
the clinical measures: time since last attack, EDSS, mean no. of relapses, mean disease duration,
enhancing lesions or the total number of MRI white matter lesions (TNL). There were
moder-ate to strong correlations between most biomarker variables and CSF protein, CSF cells and
IgG index.
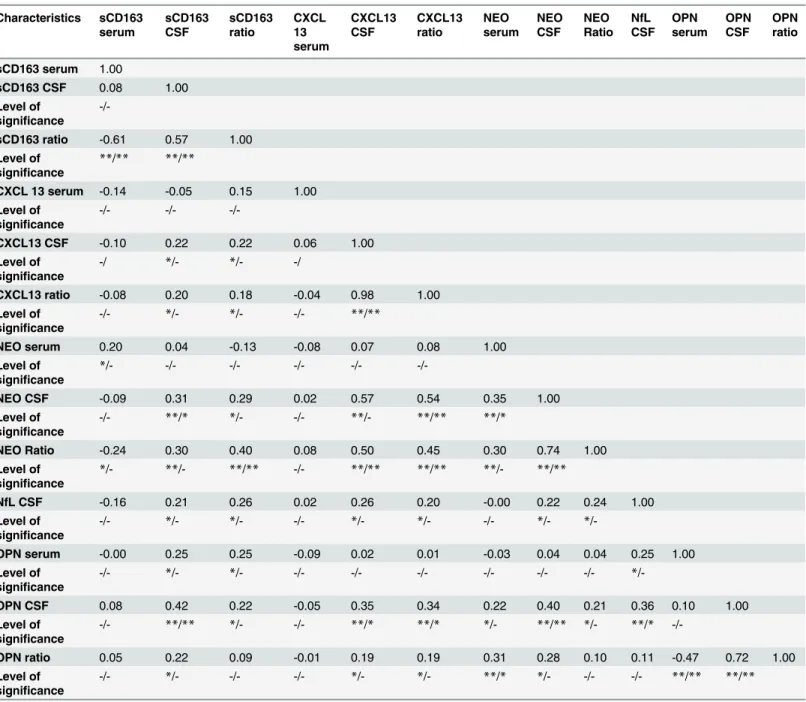
Pearson pairwise correlation analysis of biomarkers is presented without and with the
Bon-ferroni correction in
table 5. sCD163 CSF and the sCD163 ratio were correlated to most of the
other biomarkers, moderately correlated to OPN CSF, NEO CSF and the NEO ratio (p
<
0.001).
Interestingly, NEO CSF and the NEO ratio were moderately correlated to CXCL13 CSF and
the CXCL13 ratio. NfL CSF was weakly correlated to sCD163, CXCL13 and NEO levels. NfL
CSF and index was also moderately correlated to EDSS.
Linear regression with relevant age and/or gender correction
Table 4. Spearman Correlation on categorical, nominal data and Pearson correlation on continuous data. Characteristics sCD163 serum sCD163 CSF sCD163 ratio CXCL13 CSF CXCL13 ratio CXCL13 index NEO CSF NEO Ratio NEO index NfL CSF OPN serum OPN ratio OPN index
Spearman’s correlation coefficients, r, without and with the Bonferroni correction on ordinal variables RRMS & SC
(n = 83)
0.31 -0.23 -0.39 -0.58 -0.60 -0.56 -0.34 -0.43 -0.25 -0.65 -0.16 0.01 0.09
Level of significance
*/- */- **/* **/** **/** **/** */- **/* */- **/** -/- -/- -/
-PPMS & SC (n = 54)
0.19 -0.44 -0.48 -0.32 -0.36 -0.31 -0.35 -0.43 -0.12 0.68 -0.40 0.20 0.25
Level of significance
-/- **/- **/* */- */- */- */- */- -/- **/** */- -/- -/
-CIS & SC (n = 66)
0.15 0.23 0.35 -0.46 -0.46 -0.46 -0.23 -0.33 -0.18 0.51 -0.50 0.29 0.28
Level of significance
-/- -/- */- **/* **/* **/* -/- */- -/- **/* **/* */- */
-Gender (n = 125)
-0.01 -0.11 -0.10 -0.02 -0.01 -0.03 -0.14 -0.11 0.10 -0.10 -0.30 0.25 0.30
Level of significance
-/- -/- -/- -/- -/- -/- -/- -/- -/- -/- */- */- **/
-No. of attacks (n = 71)
-0.17 -0.06 -0.01 0.31 0.36 -0.37 0.18 0.15 0.13 -0.32 -0.34 0.39 0.32
Level of significance
-/- -/- -/- */- */- */- -/- -/- -/- */- */- */- */
-Pearson’s correlation coefficients, r, without and with the Bonferroni correction on continuous variables
Age (n = 125) 0.21 0.23 -0.03 -0.22 -0.16 -0.21 -0.01 -0.13 -0.30 0.02 0.20 0.05 -0.08
Level of significance
*/- */- -/- */- -/- */- -/- -/- **/- -/- */- -/- -/
-EDSS at time of diagnosis
-0.16 0.26 0.32 0.16 0.17 0.14 0.23 0.24 0.03 0.42 0.22 -0.07 -0-15
Level of significance
-/- */- **/* -/- -/- -/- */- */- -/- **/** */* -/* -/*
Disease duration (n = 86)
-0.18 -0.08 0.10 -0.10 -0.08 -0.09 0.10 0.15 0.02 -0.06 -0.12 -0.00 -0.05
Level of significance
-/- -/- -/- -/- -/- -/- -/- -/- -/- -/- -/- -/- -/
-Time since last attack (n = 71)
0.10 0.00 -0.09 -0.32 -0.32 -0.32 -0.39 -0.23 -0.21 0.21 -0.04 -0.14 -0.15
Level of significance
-/- -/- -/- */- */- */- **/- -/- -/- -/- -/- -/- **/
-CSF Protein (n = 125)
-0.07 0.44 0.35 0.18 0.18 0.04 0.22 0.26 -0.49 0.27 0.15 -0.01- -0.41
Level of significance
-/- **/** **/* */- */- -/- */- */- **/** */- -/- -/- **/**
CSF Cells -0.20 0.29 0.37 0.50 0.48 0.46 0.51 0.52 0.30 0.37 -0.04 0.09 0.04
Level of significance
*/- */- **/* **/** **/** **/** **/** **/** */- **/* -/- -/- -/
-IgG Index (n = 125)
-0.22 0.23 0.34 0.5 0.51 0.54 0.41 0.40 0.43 0.38 0.01 0.03 0.10
Level of significance
*/- */- **/* **/** **/** **/** **/** **/** **/** **/* -/- -/- -/
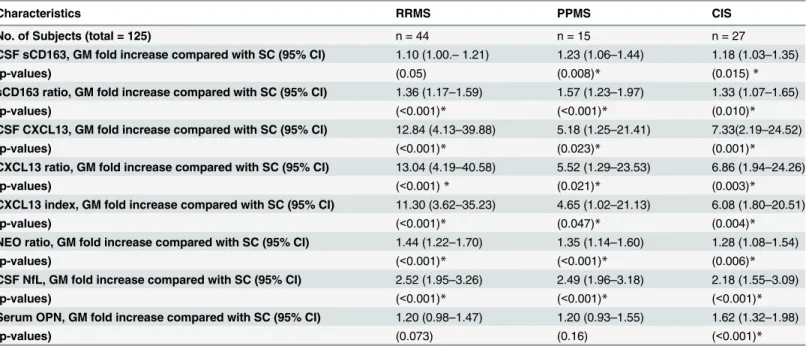
The geometric mean (GM) values of the sCD163 ratio was significantly increased for the
pa-tients with RRMS: 1.36 fold (95%CI: 1.17–1.59; p
<
.001), CIS: 1.33 fold (95%CI: 1.07, 1.65;
p = 0.010), and especially PPMS: 1.57 fold (95%CI: 1.23–1.97; p
<
0.001).
Of the other variables, most notably the CXCL13 ratio was elevated 13 fold (95%CI: 4.19–
39.88, p
<
0.001) in patients with RRMS, but also significantly elevated in patients with PPMS:
5.52 fold (95%CI: 1.29–23.53; p = 0.021) and CIS: 6.86 fold (95%CI: p = 0.003). The NEO ratio
was significantly elevated in all groups, especially RRMS: 1.44 (95%CI: 1.22–1.70; p
<
0.001).
The NfL CSF was notably increased for patients with PPMS: 2.49 fold (95%CI: 1.96–3.18;
p
<
0.001).
It is noteworthy, that OPN was a variable in which serum levels were elevated compared
with the SC group, significantly for the CIS group: 1.62 fold (95%CI: 1.32–1.98; p
<
0.001).
The biomarkers with the optimal differentiating properties were established from the
re-gression analysis: the sCD163 ratio, the CXCL13 ratio, the NEO ratio, the NfL CSF, and the
OPN serum. These parameters were further analyzed in a biomarker profile (Fig 3), a ROC
analysis (Fig 4), and using logistic regression analyses (Fig 5).
Biomarker profile
The biomarker profile was determined by categorizing the GM for each patient group in the
following manner: Very high (significantly increased GM, p
<
0.001); High (significantly
in-creased GM, p = [0.01;0.001]; Moderate (significantly inin-creased GM, p =] 0.05; 0.01]; and Low
(zero is included in the CI).
Fig 3
demonstrates a distinct profile for each patient group,
distin-guishing all patient groups from the SC group and also, to some extent, differentiating between
patients with RRMS, PPMS, and CIS.
ROC analysis and logistic regression on biomarker performance
To examine the sensitivity and specificity of each biomarker a ROC analysis was performed for
each biomarker (Fig 4). The sCD163 ratio (Fig 4a) had an area under the curve (AUC) of 0.73
(95%CI: 0.64–0.83) and this was higher than for OPN serum (Fig 4d; AUC 0.69 (95%CI: 0.59–
0.78)), equal to the NEO ratio (Fig 4c; AUC 0.74 (95%CI: 0.65–0.83)) and lower than the
CXCL13 ratio (Fig 4b; 0.80 (95%CI: 0.73–0.88)), and the NfL CSF (Fig 4e; AUC 0.86 (95%CI:
0.80–0.93)). All individual biomarkers had a lower performance than the IgG index (Fig 4f;
AUC 0.89 (95%CI: 0.84–0.95)).
Table 4. (Continued) Characteristics sCD163
serum
sCD163 CSF
sCD163 ratio
CXCL13 CSF
CXCL13 ratio
CXCL13 index
NEO CSF
NEO Ratio
NEO index
NfL CSF
OPN serum
OPN ratio
OPN index
Level of significance
-/- -/- -/- -/- -/- -/- -/- -/- -/- -/- -/- -/- -/
-Table 4 shows the results of the Spearman Correlation on categorical, nominal data and Pearson correlation on continuous data. Variables that are ordinal were analyzed with Spearman correlation without and with the Bonferroni correction and continuous variables were analyzed using Pearson correlation without and with the Bonferroni correction. In the top row only biomarkers that were significantly correlated to patient groups have been included. Thus, each biomarker value wasfirst correlated to the three groups: RRMS & SC, PPMS & SC, and CIS & SC, and then further correlated to all the demographic parameters. The correlation coefficient,r, is displayed with the significance levels indicated both without / and with the Bonferroni correction by*for p<0.05, and**for p<0.001. All p-values are presented in tables B-Y inS1 Dataset. Abbreviations: RRMS (relapsing-remitting MS), PPMS (primary-progressive MS), CIS (clinically isolated syndrome), SC (symptomatic controls), n (number of persons), CSF (cerebrospinalfluid), NfL (neurofilament light polypeptide), TNL (total number of MRI white matter lesions), NEO (neopterin), OPN (osteopontin).
The ROC analyses were followed by a logistic regression model (see
methods
and table AD
in
S1 Dataset) in which each biomarker was combined with the IgG index, and finally in a
com-bined analysis with all biomarkers (Fig 5). The comcom-bined analyses of sCD163 and the IgG
index (Fig 5a) gave an AUC of 0.91 (95%CI: 0.86–0.96) which was higher than the CXCL13
lev-els and the IgG index combined (Fig 5b; AUC 0.89 (95%CI: 0.84–0.95)), equal to the NEO
Table 5. Pearson pairwise correlation analysis without and with the Bonferroni correction of biomarkers: sCD163, CXCL13, NEO, NfL, and OPN.Characteristics sCD163 serum sCD163 CSF sCD163 ratio CXCL 13 serum CXCL13 CSF CXCL13 ratio NEO serum NEO CSF NEO Ratio NfL CSF OPN serum OPN CSF OPN ratio
sCD163 serum 1.00
sCD163 CSF 0.08 1.00
Level of significance
-/-sCD163 ratio -0.61 0.57 1.00
Level of significance
**/** **/**
CXCL 13 serum -0.14 -0.05 0.15 1.00
Level of significance
-/- -/-
-/-CXCL13 CSF -0.10 0.22 0.22 0.06 1.00
Level of significance
-/ */- */- -/
CXCL13 ratio -0.08 0.20 0.18 -0.04 0.98 1.00
Level of significance
-/- */- */- -/- **/**
NEO serum 0.20 0.04 -0.13 -0.08 0.07 0.08 1.00
Level of significance
*/- -/- -/- -/- -/-
-/-NEO CSF -0.09 0.31 0.29 0.02 0.57 0.54 0.35 1.00
Level of significance
-/- **/* */- -/- **/- **/** **/*
NEO Ratio -0.24 0.30 0.40 0.08 0.50 0.45 0.30 0.74 1.00
Level of significance
*/- **/- **/** -/- **/** **/** **/- **/**
NfL CSF -0.16 0.21 0.26 0.02 0.26 0.20 -0.00 0.22 0.24 1.00
Level of significance
-/- */- */- -/- */- */- -/- */-
*/-OPN serum -0.00 0.25 0.25 -0.09 0.02 0.01 -0.03 0.04 0.04 0.25 1.00
Level of significance
-/- */- */- -/- -/- -/- -/- -/- -/- *
/-OPN CSF 0.08 0.42 0.22 -0.05 0.35 0.34 0.22 0.40 0.21 0.36 0.10 1.00
Level of significance
-/- **/** */- -/- **/* **/* */- **/** */- **/*
-/-OPN ratio 0.05 0.22 0.09 -0.01 0.19 0.19 0.31 0.28 0.10 0.11 -0.47 0.72 1.00
Level of significance
-/- */- -/- -/- */- */- **/* */- -/- -/- **/** **/**
Table 5 shows the results from the Pearson pairwise correlation analyses without and with the Bonferroni correction of biomarkers and their
intercorrelation. The correlation coefficient, r, is displayed with the significance levels without / and with the Bonferroni corrections marked by*for p<0.05, and**for p<0.001. All p-values are presented in tables Z and AA inS1 Dataset. Abbreviations: CSF (cerebrospinalfluid), NfL (neurofilament light polypeptide), NEO (neopterin), OPN (osteopontin).
ratio (Fig 5c; AUC: 0.91 (95%CI: 0.85–0.96), and lower than the NFL index (Fig 5d; AUC: 0.95
(95%CI: 0.93–0.99)) and the OPN serum levels (Fig 5e; AUC: 0.95 (95%CI: 0.91–0.98). The
combined biomarker panel (Fig 5f) had an AUC of 0.97 (95%CI: 0.93–0.99)—higher than that
of all the individual biomarker AUCs and also higher than all of the individual biomarkers
combined with the IgG index alone.
Discussion
The biomarkers selected for this study have all documented discriminating potency providing
differentiation between diseased and healthy subjects. As pointed out by Xia
et al
[61] this sort
of study primarily focuses on the development of a biomarker panel. As a marker of
inflamma-tion, sCD163 levels are elevated in a range of diseases where inflammation contributes to the
morbidity and disability [62,
63]. As a marker for monocyte / macrophage activity in disease
sCD163 has proven to be a reliable biomarker [64]. In our recently published study [18], we
demonstrated that sCD163 is a fair marker for MS disease, and so, the contribution of this
study to MS diagnostics is not the individual biomarker levels as such, but rather the increased
discriminatory powers in the combination of biomarkers.
Contributions of sCD163 to a panel of biomarkers for inflammation and
axonal degeneration/damage
For sCD163 the results constitute a post-hoc analysis of already published data [18]. In the
present study we show that sCD163 contributes to the differentiation between SC and patients
Table 6. Results from linear regression analyses of differences in levels of biomarkers between patients with MS/CIS and SC.Characteristics RRMS PPMS CIS
No. of Subjects (total = 125) n = 44 n = 15 n = 27
CSF sCD163, GM fold increase compared with SC (95% CI) 1.10 (1.00.–1.21) 1.23 (1.06–1.44) 1.18 (1.03–1.35)
(p-values) (0.05) (0.008)* (0.015)*
sCD163 ratio, GM fold increase compared with SC (95% CI) 1.36 (1.17–1.59) 1.57 (1.23–1.97) 1.33 (1.07–1.65)
(p-values) (<0.001)* (<0.001)* (0.010)*
CSF CXCL13, GM fold increase compared with SC (95% CI) 12.84 (4.13–39.88) 5.18 (1.25–21.41) 7.33(2.19–24.52)
(p-values) (<0.001)* (0.023)* (0.001)*
CXCL13 ratio, GM fold increase compared with SC (95% CI) 13.04 (4.19–40.58) 5.52 (1.29–23.53) 6.86 (1.94–24.26)
(p-values) (<0.001)* (0.021)* (0.003)*
CXCL13 index, GM fold increase compared with SC (95% CI) 11.30 (3.62–35.23) 4.65 (1.02–21.13) 6.08 (1.80–20.51)
(p-values) (<0.001)* (0.047)* (0.004)*
NEO ratio, GM fold increase compared with SC (95% CI) 1.44 (1.22–1.70) 1.35 (1.14–1.60) 1.28 (1.08–1.54)
(p-values) (<0.001)* (<0.001)* (0.006)*
CSF NfL, GM fold increase compared with SC (95% CI) 2.52 (1.95–3.26) 2.49 (1.96–3.18) 2.18 (1.55–3.09)
(p-values) (<0.001)* (<0.001)* (<0.001)*
Serum OPN, GM fold increase compared with SC (95% CI) 1.20 (0.98–1.47) 1.20 (0.93–1.55) 1.62 (1.32–1.98)
(p-values) (0.073) (0.16) (<0.001)*
Table 6 shows the results of linear regression analyses on parameters identified in the previous correlation analysis. The regression analyses were performed on log transformed data and if the parameter was correlated to age and/or gender in the correlation analysis these were included in the linear regression. Fold differences in geometric means (GM) and CIs are shown for RRMS, PPMS, and CIS compared with the SC group. The level of
significance is shown by the p-value and*marks a significant difference between groups. Abbreviations: RRMS (relapsing-remitting MS), PPMS (primary-progressive MS), CIS (clinically isolated syndrome), SC (symptomatic controls), n (number of persons), CSF (cerebrospinalfluid), CI (confidence interval) NfL (neurofilament light polypeptide), NEO (neopterin), OPN (osteopontin). The data on sCD163 have previously been presented in [18].
diagnosed with CIS or MS as shown in
Fig 3. The ROC analyses of the individual biomarkers
shows that with respect to specificity and sensitivity, the sCD163 ratio scores on a par with the
established biomarkers regarding diagnostic properties (see
Fig 4a–4f). According to the
crite-ria outlined by Xia
et al
[61] none of the biomarkers analysed could be categorized as excellent
(AUC = 0.9–1.0); the IgG index, the NfL index, and the CXCL13 ratio could be categorized as
good (AUC = 0.8–0.9), the sCD163 ratio and the NEO ratio could be categorized as fair
(AUC = 0.7–0.8), whereas, finally, the OPN serum level could be categorized as poor
(AUC = 0.6–0.7) [61]. However, as demonstrated in
Fig 5a–5e, the panel of combined
bio-markers performs the diagnostic differentiation to a very high level, elevating the diagnostic
properties to excellent for most biomarkers (only the CXCL13 ratio is exempted), when
com-bined with the IgG index. The combination of all tested biomarkers (Fig 5f) resulted in an
AUC of 0.97, illustrating that in a multifactorial disease, such as MS, the combination of
multi-ple biomarkers into a singularised multivariable model provides a high level of diagnostic
dis-crimination and reliability. Interestingly, in the present study OPN serum shows a poor
discriminatory capacity when viewed as a single marker, yet combined with IgG index it
Fig 3. Fig 3 shows the biomarker profile for each group of patients.The biomarker profile was constructed as an overview representing the major characteristics of each group in the cohort. The profile was determined by categorizing the GM levels of the sCD163 ratio, the CXCL13 ratio, the NEO ratio, the NfL CSF, the OPN serum, and the IgG index for each patient group in the following manner: Very high (significantly increased GM, p<0.001); High(significantly increased GM, p<0.01); Moderate (significantly increased GM, p<0.05); Low (zero is included in the CI). Abbreviations: NEO (neopterin), NfL (neurofilament light polypeptide), OPN (osteopontin), SC (symptomatic controls), RRMS (relapsing-remitting MS), PPMS (primary-progressive MS), CIS (clinically isolated syndrome), CI (confidence interval), GM (geometric means).
becomes excellent. This is probably due to the fact that it OPN is especially elevated in serum
of patients with CIS (Fig 2n) as is not the case for the IgG index.
Overall, we find it noteworthy that (except for OPN) the biomarker ratios and indexes (i.e.
levels in CSF in relation to levels in serum) were optimal in differentiating between patient
groups rather than levels in either CSF or serum. The well-established MS diagnostic marker,
the IgG index, also measures a relation between levels in the CNS and in the systemic
circula-tion. This underscores that measuring biomarker levels concomitantly in both compartments
is advantageous.
In the present study patients with PPMS had significantly elevated sCD163 CSF median
lev-els compared with SC. This is also the case for the NEO CSF levlev-els. Interestingly, the levlev-els of
sCD163 and NEO in serum and CSF are decreased / increased in similar ways (Fig
2a,
2b,
2i
and
2j). It has recently been reported, that the release of NEO triggers the release of TNF
α
,
which is associated with the release of sCD163 [21]. The levels of NEO and sCD163 in both
serum and CSF were found to be comparable, supporting a concerted inflammatory response.
Especially in PPMS, where sCD163 is known to be up regulated during the pro-inflammatory
response [65], and the release of NEO is known to contribute to the orchestration of oxidative
stress [37].
For the other biomarkers analysed, the results were as follows: the median levels of the
CXCL13 ratio were significantly increased for all patient groups compared with SC. This
in-crease attained the highest level of significance for patients with RRMS, followed by CIS and
Fig 4. ROC curves for the sCD163 ratio, the CXCL13 ratio, the NEO ratio, the NfL CSF, the OPN serum, and the IgG index.Fig 4 shows the ROC curves generated for the sCD163 ratio (4a), the CXCL13 ratio (4b), the NEO ratio (4c), the NfL CSF (4d), the OPN serum (4e), and the IgG index (4f). The data on sCD163 have previously been presented in [18]. AUC, with 95% CI, is given for each parameter. The parameter results for patients with RRMS, PPMS, and CIS are combined as true positives and plotted against SC as true negatives. The diagonal dividing the ROC space represents the random event. Abbreviations: ROC (receiver operating characteristic), AUC (area under the curve), RRMS (relapsing-remitting MS), PPMS (primary-progressive MS), CIS (clinically isolated syndrome), SC (symptomatic controls), CSF (cerebrospinal fluid), CI (confidence interval).PPMS. This is in agreement with the general hypothesis that the pathological mechanism in
these two groups is mainly driven by inflammation of which CXCL13 is a marker [66].
There were no significant differences between GM levels of NfL in patients with PPMS, CIS
and RRMS, yet they were all significantly elevated compared with SC. This is interesting, as
NfL has been proposed as a marker for relapse in MS [67]. However, that study had some
over-lap in NfL levels between groups as is also the case in the present study. The levels of NfL were
also significantly correlated to
no
.
of attacks
(r = 0.32) but there was no correlation to
time
since last attack
(table 4).
For OPN, we found that patients with CIS had significantly elevated GMs of OPN in serum
as compared with SC, as was also the case in the age adjusted linear regression model (table 6).
Furthermore, the GM levels in CIS were also significantly elevated when compared with the
GM levels in the RRMS and PPMS groups. It is noteworthy, that in a recent study by Kivisakk
et al [54] the CIS patients had the lowest levels of OPN compared with patients with MS.
How-ever, that study is based on a patient cohort undergoing immune-modulating treatment, and
thus the two cohorts are not comparable. The present study substantiates that PPMS also has
an inflammatory component, as illustrated by the significantly elevated levels of the CXCL13
ratio, the sCD163 ratio and the NEO ratio as compared with the SC groups. The role of
macro-phages/microglia in progressive MS disease has recently been reviewed [68] and it is suggested
that the damage unfolded during progression of the MS disease is due both to chronic
inflam-mation and to neurodegeneration [69]. Axonal transection is a common feature in MS
patholo-gy [70] and axonal damage/loss plays a key role in MS disability development. Thus,
Fig 5. ROC curves for the sCD163 ratio, the CXCL13 ratio, the NEO ratio, the NfL index, and the OPN serum combined with the IgG index individually as well as a combined ROC curve.Fig 5 shows the combined ROC curves generated for the IgG index and the sCD163 ratio (5a), the CXCL13 ratio (5b), the NEO ratio (5c), the NfL CSF (5d), the OPN serum (5e), and All biomarkers (5f). AUC, with 95% CI, is given for each parameter. The parameter results for patients with RRMS, PPMS, and CIS are combined as true positives and plotted against SC as true negatives. The diagonal dividing the ROC space represents the random event. Abbreviations: ROC (receiver operating characteristic), AUC (area under the curve), RRMS (relapsing-remitting MS), PPMS (primary-progressive MS), CIS (clinically isolated syndrome), SC (symptomatic controls), CI (confidence interval).
macrophages/microglia are intimately related to axonal damage in MS lesions and as MHC
class II-positive cells [71] they are abundantly present in acute and chronically active MS
le-sions [70,
72]. It has been proposed that macrophages/microglia are involved in T cell
activa-tion [73] but also that they actively hinder lymphocyte proliferaactiva-tion illustrating the complex
orchestration of pathology where macrophages/microglia play a pivotal role.
We are aware, that the results obtained with the present panel of biomarkers needs to be
val-idated in a larger, independent cohort before application into a clinical setting; particularly as
the sample numbers in the present patient groups are rather small for PPMS and SPMS.
Ex-trapolation of results of the analyses to a wider range of patients including patients with i.e.
non-demyelinating neurological or infectious disease of the CNS should also be explored in
further studies.
In conclusion we propose that the sCD163 ratio contributes as a biomarker in
differentiat-ing newly diagnosed patients with MS/CIS from SC. The biomarker panel showed different
profiles for each patient group and could be a valuable tool for clinical differentiation of MS
subgroups. All tested biomarkers in the present study were significantly correlated to RRMS,
PPMS, and/or CIS and their combined ROC curve analysis demonstrated excellent diagnostic
discriminatory power. Finally, the study supports that PPMS has an inflammatory component
as the levels of all biomarkers (except OPN) were significantly elevated in PPMS.
Supporting Information
S1 Dataset. Comprise Tables A
—
AD.
(DOCX)
S1 Previous Publication. Reference [18] by Stilund
et al
.
(PDF)
Acknowledgments
We thank laboratory technicians Kirsten Bank Petersen, and Eva Lykke Petersen for their
ex-cellent practical support.
We thank Jens Kirkeby for his kind assistance in the drawing of figures.
We thank everyone at the MS clinic at the Department of Neurology, Aarhus University
Hospital.
Author Contributions
Conceived and designed the experiments: MS TC TP HJM. Performed the experiments: MS
TC HJM MCG. Analyzed the data: MS TC TP MCG. Contributed reagents/materials/analysis
tools: MS TC HJM TP PVR. Wrote the paper: MS TC TP PVR MCG HJM.
References
1. Compston A, Coles A. Multiple sclerosis. Lancet. 2002; 359(9313):1221–31. PMID:11955556 2. Compston A, Coles A. Multiple sclerosis. Lancet. 2008; 372(9648):1502–17. doi:10.1016/S0140-6736
(08)61620-7PMID:18970977
3. Kipp M, van der Valk P, Amor S. Pathology of multiple sclerosis. CNS Neurol Disord Drug Targets. 2012; 11(5):506–17. PMID:22583433
5. Teunissen CE, Koel-Simmelink MJ, Pham TV, Knol JC, Khalil M, Trentini A, et al. Identification of bio-markers for diagnosis and progression of MS by MALDI-TOF mass spectrometry. Multiple sclerosis. 2011; 17(7):838–50. doi:10.1177/1352458511399614PMID:21505015
6. Tumani H, Hartung HP, Hemmer B, Teunissen C, Deisenhammer F, Giovannoni G, et al. Cerebrospinal fluid biomarkers in multiple sclerosis. Neurobiology of disease. 2009; 35(2):117–27. doi:10.1016/j.nbd.
2009.04.010PMID:19426803
7. Ziemann U, Wahl M, Hattingen E, Tumani H. Development of biomarkers for multiple sclerosis as a neurodegenerative disorder. Progress in neurobiology. 2011; 95(4):670–85. doi:10.1016/j.pneurobio.
2011.04.007PMID:21524682
8. Shaw CE, Dunbar PR, Macaulay HA, Neale TJ. Measurement of immune markers in the serum and ce-rebrospinal fluid of multiple sclerosis patients during clinical remission. Journal of neurology. 1995; 242 (2):53–8. PMID:7707089
9. Stangel M, Fredrikson S, Meinl E, Petzold A, Stuve O, Tumani H. The utility of cerebrospinal fluid analy-sis in patients with multiple scleroanaly-sis. Nature reviews Neurology. 2013; 9(5):267–76. doi:10.1038/
nrneurol.2013.41PMID:23528543
10. Katsavos S, Anagnostouli M. Biomarkers in Multiple Sclerosis: An Up-to-Date Overview. Multiple scle-rosis international. 2013; 2013:340508. doi:10.1155/2013/340508PMID:23401777
11. Harris VK, Sadiq SA. Disease biomarkers in multiple sclerosis: potential for use in therapeutic decision making. Molecular diagnosis & therapy. 2009; 13(4):225–44.
12. Avsar T, Korkmaz D, Tutuncu M, Demirci NO, Saip S, Kamasak M, et al. Protein biomarkers for multiple sclerosis: semi-quantitative analysis of cerebrospinal fluid candidate protein biomarkers in different forms of multiple sclerosis. Mult Scler. 2012; 18(8):1081–91. doi:10.1177/1352458511433303PMID:
22252467
13. Lucchinetti C, Brück W, Parisi J, Scheithauer B, Rodriguez M, Lassmann H. Heterogeneity of multiple sclerosis lesions: implications for the pathogenesis of demyelination. Ann Neurol. 2000; 47(6):707–17.
PMID:10852536
14. Lieury A, Chanal M, Androdias G, Reynolds R, Cavagna S, Giraudon P, et al. Tissue remodeling in peri-plaque regions of multiple sclerosis spinal cord lesions. Glia. 2014; 62(10):1645–58. doi:10.1002/glia.
22705PMID:24910450
15. Miron VE, Boyd A, Zhao J-W, Yuen TJ, Ruckh JM, Shadrach JL, et al. M2 microglia and macrophages drive oligodendrocyte differentiation during CNS remyelination. Nat Neurosci. 2013; 16(9):1211–8. doi:
10.1038/nn.3469PMID:23872599
16. Vogel DYS, Vereyken EJF, Glim JE, Heijnen PDAM, Moeton M, van der Valk P, et al. Macrophages in inflammatory multiple sclerosis lesions have an intermediate activation status. J Neuroinflammation. 2013; 10:35. doi:10.1186/1742-2094-10-35PMID:23452918
17. Zhang Z, Zhang Z-Y, Schittenhelm J, Wu Y, Meyermann R, Schluesener HJ. Parenchymal accumulation of CD163+ macrophages/microglia in multiple sclerosis brains. J Neuroimmunol. 2011; 237(1–2):73–9.
doi:10.1016/j.jneuroim.2011.06.006PMID:21774995
18. Stilund M, Reuschlein AK, Christensen T, Moller HJ, Rasmussen PV, Petersen T. Soluble CD163 as a Marker of Macrophage Activity in Newly Diagnosed Patients with Multiple Sclerosis. PloS one. 2014; 9 (6):e98588. doi:10.1371/journal.pone.0098588PMID:24886843
19. Galea J, Cruickshank G, Teeling JL, Boche D, Garland P, Perry VH, et al. The intrathecal CD163-hap-toglobin-hemoglobin scavenging system in subarachnoid hemorrhage. Journal of neurochemistry. 2012; 121(5):785–92. doi:10.1111/j.1471-4159.2012.07716.xPMID:22380637
20. Davis BH, Zarev PV. Human monocyte CD163 expression inversely correlates with soluble CD163 plasma levels. Cytometry Part B, Clinical cytometry. 2005; 63(1):16–22. PMID:15624200
21. Moller HJ. Soluble CD163. Scandinavian journal of clinical and laboratory investigation. 2012; 72(1): 1–13. doi:10.3109/00365513.2011.626868PMID:22060747
22. Högger P, Sorg C. Soluble CD163 inhibits phorbol ester-induced lymphocyte proliferation. Biochemical and biophysical research communications. 2001; 288(4):841–3. PMID:11688984
23. Legler DF, Loetscher M, Roos RS, Clark-Lewis I, Baggiolini M, Moser B. B cell-attracting chemokine 1, a human CXC chemokine expressed in lymphoid tissues, selectively attracts B lymphocytes via BLR1/ CXCR5. The Journal of experimental medicine. 1998; 187(4):655–60. PMID:9463416
24. Brettschneider J, Czerwoniak A, Senel M, Fang L, Kassubek J, Pinkhardt E, et al. The chemokine CXCL13 is a prognostic marker in clinically isolated syndrome (CIS). PloS one. 2010; 5(8):e11986. doi: 10.1371/journal.pone.0011986PMID:20700489
26. Festa ED, Hankiewicz K, Kim S, Skurnick J, Wolansky LJ, Cook SD, et al. Serum levels of CXCL13 are elevated in active multiple sclerosis. Multiple sclerosis. 2009; 15(11):1271–9. doi:10.1177/
1352458509107017PMID:19805441
27. Alvarez E, Piccio L, Mikesell RJ, Klawiter EC, Parks BJ, Naismith RT, et al. CXCL13 is a biomarker of inflammation in multiple sclerosis, neuromyelitis optica, and other neurological conditions. Multiple scle-rosis. 2013; 19(9):1204–8. doi:10.1177/1352458512473362PMID:23322500
28. Kowarik MC, Cepok S, Sellner J, Grummel V, Weber MS, Korn T, et al. CXCL13 is the major determi-nant for B cell recruitment to the CSF during neuroinflammation. J Neuroinflammation. 2012; 9:93. doi: 10.1186/1742-2094-9-93PMID:22591862
29. Carlsen HS, Baekkevold ES, Morton HC, Haraldsen G, Brandtzaeg P. Monocyte-like and mature mac-rophages produce CXCL13 (B cell-attracting chemokine 1) in inflammatory lesions with lymphoid neo-genesis. Blood. 2004; 104(10):3021–7. PMID:15284119
30. Romme Christensen J, Bornsen L, Khademi M, Olsson T, Jensen PE, Sorensen PS, et al. CSF inflam-mation and axonal damage are increased and correlate in progressive multiple sclerosis. Multiple scle-rosis. 2013; 19(7):877–84. doi:10.1177/1352458512466929PMID:23178691
31. Sellebjerg F, Bornsen L, Khademi M, Krakauer M, Olsson T, Frederiksen JL, et al. Increased cerebro-spinal fluid concentrations of the chemokine CXCL13 in active MS. Neurology. 2009; 73(23):2003–10.
doi:10.1212/WNL.0b013e3181c5b457PMID:19996075
32. Edwards KR, Goyal J, Plavina T, Czerkowicz J, Goelz S, Ranger A, et al. Feasibility of the use of combi-natorial chemokine arrays to study blood and CSF in multiple sclerosis. PloS one. 2013; 8(11):e81007. doi:10.1371/journal.pone.0081007PMID:24278364
33. Ragheb S, Li Y, Simon K, VanHaerents S, Galimberti D, De Riz M, et al. Multiple sclerosis: BAFF and CXCL13 in cerebrospinal fluid. Multiple sclerosis. 2011; 17(7):819–29. doi:10.1177/
1352458511398887PMID:21372118
34. Khademi M, Kockum I, Andersson ML, Iacobaeus E, Brundin L, Sellebjerg F, et al. Cerebrospinal fluid CXCL13 in multiple sclerosis: a suggestive prognostic marker for the disease course. Multiple sclerosis. 2011; 17(3):335–43. doi:10.1177/1352458510389102PMID:21135023
35. Murr C, Widner B, Wirleitner B, Fuchs D. Neopterin as a marker for immune system activation. Current drug metabolism. 2002; 3(2):175–87. PMID:12003349
36. Werner-Felmayer G, Werner ER, Fuchs D, Hausen A, Reibnegger G, Wachter H. Neopterin formation and tryptophan degradation by a human myelomonocytic cell line (THP-1) upon cytokine treatment. Cancer research. 1990; 50(10):2863–7. PMID:2110500
37. Hoffmann G, Wirleitner B, Fuchs D. Potential role of immune system activation-associated production of neopterin derivatives in humans. Inflammation research: official journal of the European Histamine Research Society [et al]. 2003; 52(8):313–21. PMID:14504669
38. Giovannoni G, Lai M, Kidd D, Thorpe JW, Miller DH, Thompson AJ, et al. Daily urinary neopterin excre-tion as an immunological marker of disease activity in multiple sclerosis. Brain. 1997; 120:1–13. PMID:
9055793
39. Ott M, Demisch L, Engelhardt W, Fischer PA. Interleukin-2, soluble interleukin-2-receptor, neopterin, L-tryptophan and beta 2-microglobulin levels in CSF and serum of patients with relapsing-remitting or chronic-progressive multiple sclerosis. Journal of neurology. 1993; 241(2):108–14. PMID:8138825 40. Dobson R, Topping J, Davis A, Thompson E, Giovannoni G. Cerebrospinal fluid and urinary biomarkers
in multiple sclerosis. Acta neurologica Scandinavica. 2013; 128(5):321–7. doi:10.1111/ane.12119
PMID:23465040
41. Huber C, Batchelor JR, Fuchs D, Hausen A, Lang A, Niederwieser D, et al. Immune response-associat-ed production of neopterin. Release from macrophages primarily under control of interferon-gamma. The Journal of experimental medicine. 1984; 160(1):310–6. PMID:6429267
42. Lee MK, Xu Z, Wong PC, Cleveland DW. Neurofilaments are obligate heteropolymers in vivo. The Jour-nal of cell biology. 1993; 122(6):1337–50. PMID:8376466
43. Teunissen CE, Khalil M. Neurofilaments as biomarkers in multiple sclerosis. Multiple sclerosis. 2012; 18(5):552–6. doi:10.1177/1352458512443092PMID:22492131
44. Huizinga R, van der Star BJ, Kipp M, Jong R, Gerritsen W, Clarner T, et al. Phagocytosis of neuronal debris by microglia is associated with neuronal damage in multiple sclerosis. Glia. 2012; 60(3):422–31.
doi:10.1002/glia.22276PMID:22161990
46. Lycke JN, Karlsson JE, Andersen O, Rosengren LE. Neurofilament protein in cerebrospinal fluid: a po-tential marker of activity in multiple sclerosis. Journal of neurology, neurosurgery, and psychiatry. 1998; 64(3):402–4. PMID:9527161
47. Norgren N, Sundstrom P, Svenningsson A, Rosengren L, Stigbrand T, Gunnarsson M. Neurofilament and glial fibrillary acidic protein in multiple sclerosis. Neurology. 2004; 63(9):1586–90. PMID:15534240 48. Bartos A, Fialova L, Soukupova J, Kukal J, Malbohan I, Pitha J. Antibodies against light neurofilaments
in multiple sclerosis patients. Acta Neurol Scand. 2007; 116(2):100–7. PMID:17661795
49. Ehling R, Lutterotti A, Wanschitz J, Khalil M, Gneiss C, Deisenhammer F, et al. Increased frequencies of serum antibodies to neurofilament light in patients with primary chronic progressive multiple sclero-sis. Multiple sclerosclero-sis. 2004; 10(6):601–6. PMID:15584481
50. Rittling SR. Osteopontin in macrophage function. Expert reviews in molecular medicine. 2011; 13:e15. Epub 2011/05/07. doi:10.1017/S1462399411001839PMID:21545755
51. Sodek J, Ganss B, McKee MD. Osteopontin. Critical reviews in oral biology and medicine: an official publication of the American Association of Oral Biologists. 2000; 11(3):279–303.
52. Schack L, Stapulionis R, Christensen B, Kofod-Olsen E, Skov Sorensen UB, Vorup-Jensen T, et al. Osteopontin enhances phagocytosis through a novel osteopontin receptor, the alphaXbeta2 integrin. Journal of immunology. 2009; 182(11):6943–50. doi:10.4049/jimmunol.0900065PMID:19454691 53. Sinclair C, Mirakhur M, Kirk J, Farrell M, McQuaid S. Up-regulation of osteopontin and
alphaBeta-crys-tallin in the normal-appearing white matter of multiple sclerosis: an immunohistochemical study utilizing tissue microarrays. Neuropathology and applied neurobiology. 2005; 31(3):292–303. PMID:15885066 54. Kivisakk P, Healy BC, Francois K, Gandhi R, Gholipour T, Egorova S, et al. Evaluation of circulating
osteopontin levels in an unselected cohort of patients with multiple sclerosis: relevance for biomarker development. Multiple sclerosis. 2014; 20(4):438–44. doi:10.1177/1352458513503052PMID:
24005026
55. Teunissen C, Menge T, Altintas A, Alvarez-Cermeno JC, Bertolotto A, Berven FS, et al. Consensus def-initions and application guidelines for control groups in cerebrospinal fluid biomarker studies in multiple sclerosis. Multiple sclerosis. 2013; 19(13):1802–9. doi:10.1177/1352458513488232PMID:23695446 56. Polman CH, Reingold SC, Banwell B, Clanet M, Cohen JA, Filippi M, et al. Diagnostic criteria for
multi-ple sclerosis: 2010 revisions to the McDonald criteria. Ann Neurol. 2011; 69(2):292–302. doi:10.1002/
ana.22366PMID:21387374
57. Kurtzke JF. Rating neurologic impairment in multiple sclerosis: an expanded disability status scale (EDSS). Neurology. 1983; 33(11):1444–52. PMID:6685237
58. Teunissen CE, Petzold A, Bennett JL, Berven FS, Brundin L, Comabella M, et al. A consensus protocol for the standardization of cerebrospinal fluid collection and biobanking. Neurology. 2009; 73(22): 1914–22. doi:10.1212/WNL.0b013e3181c47cc2PMID:19949037
59. Moller HJ, Hald K, Moestrup SK. Characterization of an enzyme-linked immunosorbent assay for solu-ble CD163. Scandinavian journal of clinical and laboratory investigation. 2002; 62(4):293–9. PMID:
12476928
60. R N. Stata tip 1: The eform() option of regress Stata Technical Journal: StataCorp LP; 2003 [cited 2003]. Available:http://www.stata-journal.com/sjpdf.html?articlenum = st0054.
61. Xia J, Broadhurst DI, Wilson M, Wishart DS. Translational biomarker discovery in clinical metabolo-mics: an introductory tutorial. Metabolomics. 2013; 9(2):280–99. PMID:23543913
62. Hiraoka A, Horiike N, Akbar SM, Michitaka K, Matsuyama T, Onji M. Soluble CD163 in patients with liver diseases: very high levels of soluble CD163 in patients with fulminant hepatic failure. Journal of gastroenterology. 2005; 40(1):52–6. PMID:15692789
63. Moller HJ, de Fost M, Aerts H, Hollak C, Moestrup SK. Plasma level of the macrophage-derived soluble CD163 is increased and positively correlates with severity in Gaucher's disease. European journal of haematology. 2004; 72(2):135–9. PMID:14962251
64. Moller HJ, Aerts H, Gronbaek H, Peterslund NA, Hyltoft Petersen P, Hornung N, et al. Soluble CD163: a marker molecule for monocyte/macrophage activity in disease. Scandinavian journal of clinical and laboratory investigation Supplementum. 2002; 237:29–33. PMID:12570164
65. Etzerodt A, Rasmussen MR, Svendsen P, Chalaris A, Schwarz J, Galea I, et al. Structural basis for in-flammation-driven shedding of CD163 ectodomain and tumor necrosis factor-alpha in macrophages. The Journal of biological chemistry. 2014; 289(2):778–88. doi:10.1074/jbc.M113.520213PMID:
24275664
67. Malmestrom C, Haghighi S, Rosengren L, Andersen O, Lycke J. Neurofilament light protein and glial fibrillary acidic protein as biological markers in MS. Neurology. 2003; 61(12):1720–5. PMID:14694036 68. Correale J. The role of microglial activation in disease progression. Multiple sclerosis. 2014; 20(10):
1288–95. doi:10.1177/1352458514533230PMID:24812046
69. Centonze D, Muzio L, Rossi S, Furlan R, Bernardi G, Martino G. The link between inflammation, synap-tic transmission and neurodegeneration in multiple sclerosis. Cell death and differentiation. 2010; 17(7):1083–91. doi:10.1038/cdd.2009.179PMID:19927157
70. Trapp BD, Peterson J, Ransohoff RM, Rudick R, Mork S, Bo L. Axonal transection in the lesions of mul-tiple sclerosis. The New England journal of medicine. 1998; 338(5):278–85. PMID:9445407
71. Fabriek BO, Van Haastert ES, Galea I, Polfliet MMJ, Döpp ED, Van Den Heuvel MM, et al. CD163-positive perivascular macrophages in the human CNS express molecules for antigen recognition and presentation. Glia. 2005; 51(4):297–305. PMID:15846794
72. Trapp BD, Nave K-A. Multiple sclerosis: an immune or neurodegenerative disorder? Annu Rev Neu-rosci. 2008; 31:247–69. doi:10.1146/annurev.neuro.30.051606.094313PMID:18558855