BGD
12, 7209–7255, 2015Effects of nitrate and phosphate supply on chromophoric and fluorescent dissolved
organic matter
A. N. Loginova et al.
Title Page
Abstract Introduction
Conclusions References
Tables Figures
◭ ◮
◭ ◮
Back Close
Full Screen / Esc
Printer-friendly Version Interactive Discussion
Discussion
P
a
per
|
Discussion
P
a
per
|
Discussion
P
a
per
|
Discussion
P
a
per
|
Biogeosciences Discuss., 12, 7209–7255, 2015 www.biogeosciences-discuss.net/12/7209/2015/ doi:10.5194/bgd-12-7209-2015
© Author(s) 2015. CC Attribution 3.0 License.
This discussion paper is/has been under review for the journal Biogeosciences (BG). Please refer to the corresponding final paper in BG if available.
E
ff
ects of nitrate and phosphate supply
on chromophoric and fluorescent
dissolved organic matter in the Eastern
Tropical North Atlantic: a mesocosm
study
A. N. Loginova, C. Borchard, J. Meyer, H. Hauss, R. Kiko, and A. Engel
GEOMAR Helmholtz-Centre for Ocean Research Kiel, Düsternbrooker Weg 20, 24105 Kiel, Germany
Received: 24 April 2015 – Accepted: 24 April 2015 – Published: 18 May 2015
Correspondence to: A. N. Loginova ([email protected])
Published by Copernicus Publications on behalf of the European Geosciences Union.
BGD
12, 7209–7255, 2015Effects of nitrate and phosphate supply on chromophoric and fluorescent dissolved
organic matter
A. N. Loginova et al.
Title Page
Abstract Introduction
Conclusions References
Tables Figures
◭ ◮
◭ ◮
Back Close
Full Screen / Esc
Printer-friendly Version Interactive Discussion
Discussion
P
a
per
|
Discussion
P
a
per
|
Discussion
P
a
per
|
Discussion
P
a
per
|
Abstract
The Eastern Tropical North Atlantic (ETNA) is an open ocean region with little input of terrestrial dissolved organic matter (DOM), suggesting that pelagic production has to be the main source of DOM. Inorganic nitrogen (DIN) and phosphorus (DIP) concen-trations affect pelagic production, leading to DOM modifications. The quantitative and 5
qualitative changes in DOM are often estimated by its optical properties. Colored DOM (CDOM) is often used to estimate dissolved organic carbon (DOC) concentrations by applied techniques, e.g. through remote sensing, whereas DOM properties, such as molecular weight, can be estimated from the slopes of the CDOM absorption spectra (S). Fluorescence properties of CDOM (FDOM) allow discriminating between different 10
structural CDOM properties. The investigation of distribution and cycling of CDOM and FDOM was recognized to be important for understanding of physical and biogeochemi-cal processes, influencing DOM. However, little information is available about effects of nutrient variability on CDOM and FDOM dynamics. Here we present results from two mesocosm experiments conducted with a natural plankton community of the ETNA, 15
where effects of DIP (“Varied P”) and DIN (“Varied N”) supply on optical properties of DOM were studied. CDOM accumulated proportionally to phytoplankton biomass dur-ing the experiments.S decreased over time indicating accumulation of high molecular weight DOM. In Varied N, an additional CDOM portion, as a result of bacterial DOM reworking, was determined. It increased the CDOM fraction in DOC proportionally to 20
the supplied DIN. The humic-like FDOM component (Comp.1) was derived by bacteria proportionally to DIN supply. The bound-to-protein amino acid-like FDOM component (Comp.2) was released irrespectively to phytoplankton biomass, but depending on DIP and DIN concentrations, as a part of an overflow mechanism. Under high DIN supply, Comp.2 was removed by bacterial reworking processes, leading to an accumulation 25
BGD
12, 7209–7255, 2015Effects of nitrate and phosphate supply on chromophoric and fluorescent dissolved
organic matter
A. N. Loginova et al.
Title Page
Abstract Introduction
Conclusions References
Tables Figures
◭ ◮
◭ ◮
Back Close
Full Screen / Esc
Printer-friendly Version Interactive Discussion
Discussion
P
a
per
|
Discussion
P
a
per
|
Discussion
P
a
per
|
Discussion
P
a
per
|
changes in nutrient concentrations may lead to substantial responses in the quantity and “quality” of optically active DOM and, therefore, might bias results of the applied techniques for an estimation of DOC concentrations in open ocean regions.
1 Introduction
Dissolved organic matter (DOM) is the largest dynamic pool of organic carbon in the 5
ocean. Its global inventory constitutes of approximately 662 pentagrams of carbon (PgC) (Hansell et al., 2009). Labile and semi-labile high molecular weight (HMW) DOM is released primarily by phytoplankton (Carlson and Hansell, 2015). It is used as sub-strate by the heterotrophic communities, which, in turn, release less bioavailable semi-refractory or even semi-refractory DOM, thereby modifying the quantity and quality of the 10
DOM pool (Azam et al., 1983; Ogawa et al., 2001; Jiao et al., 2010). Therefore, oceanic DOM is a complex mixture of organic compounds with different characteristics, such as molecular structure and molecular weight, resulting in different optical properties (Stedmon and Nelson, 2015).
For instance, the presence of conjugated double bonds (polyenes) results in the 15
absorption of light in the UV and visible wavelength ranges (Stedmon and Álvarez-Salgado, 2011). The light absorbing DOM fraction is referred to as “chromophoric” or “colored” DOM (CDOM) (Coble, 2007). Due to its abilities to absorb in a wide wave-length range, CDOM may protect primary producers from harmful UV irradiation in the water column, but may also reduce photosyntetically active radiation as it absorbs at 20
chlorophyll absorption maxima (Zepp et al., 2008). Photons absorbed by CDOM induce the formation of free radicals, which by colliding with other molecules or other radicals produce new organic molecules, reducing metals or introducing short inorganic and organic substances as byproducts (Sulzberger and Durisch-Kaiser, 2008). Modified by photoreactions, CDOM may serve as biological substrates for auto- and heterotrophic 25
communities, releasing nutrients and low molecular weight (LMW) organic compounds,
BGD
12, 7209–7255, 2015Effects of nitrate and phosphate supply on chromophoric and fluorescent dissolved
organic matter
A. N. Loginova et al.
Title Page
Abstract Introduction
Conclusions References
Tables Figures
◭ ◮
◭ ◮
Back Close
Full Screen / Esc
Printer-friendly Version Interactive Discussion
Discussion
P
a
per
|
Discussion
P
a
per
|
Discussion
P
a
per
|
Discussion
P
a
per
|
as well as a source of trace gases (e.g. CO, CO2) (Kieber et al., 1990; Moran and Zepp, 1997; Kieber et al., 1999).
CDOM absorption has often been used as an indicator for DOC concentrations in the Ocean (Fichot and Benner, 2011, 2012; Rochelle-Newall et al., 2014). For example, DOC concentration in estuarine surface waters can be derived from CDOM absorption 5
by remote sensing techniques, assuming a direct relationship between CDOM absorp-tion and DOC concentraabsorp-tions (Del Castillo, 2005). In the open ocean, however, this relationship varies throughout the water column (Nelson and Siegel, 2013), and factors affecting it are poorly understood.
A better knowledge on factors influencing the CDOM/DOC relationship could im-10
prove our understanding of DOM cycling, as well as of the regulation of light attenuation in the ocean. Furthermore, the knowledge of the factors, influencing the open ocean CDOM/DOC relationship would be useful for the estimation of DOC concentrations from CDOM absorption measurements by remote sensing techniques.
As CDOM embodies a complex mixture of organic compounds that have overlapping 15
absorption spectra, with, generally, no single compound dominating (Del Vecchio and Blough, 2004), CDOM absorbance spectra generally decrease exponentially toward longer wavelength, with no discernible peaks. Therefore, the CDOM concentration is commonly expressed as absorption coefficient at chosen wavelength (e.g. 325, 355, 375 nm) (Stedmon et al., 2001; Fichot and Benner, 2012; Nelson and Siegel, 2013). 20
To derive information on CDOM quality, such as molecular weight and modification processes, spectral slopes of CDOM light absorption and spectral slopes ratio are used (Helms et al., 2008; Zhang et al., 2009).
It has been shown that spectral slopes at wavelength regions 275–295 nm and 300– 500 nm (S275–295 and S300–500) decrease with increasing in DOM molecular weight,
25
and, therefore, may be used as an indicator of accumulation/degradation of bioavailable HMW-DOM (De Haan and De Boer, 1987; Helms et al., 2008; Zhang et al., 2009).
The ratio ofS275–295 to spectral slope at wavelength region 350–400 nm (S350–400),
BGD
12, 7209–7255, 2015Effects of nitrate and phosphate supply on chromophoric and fluorescent dissolved
organic matter
A. N. Loginova et al.
Title Page
Abstract Introduction
Conclusions References
Tables Figures
◭ ◮
◭ ◮
Back Close
Full Screen / Esc
Printer-friendly Version Interactive Discussion
Discussion
P
a
per
|
Discussion
P
a
per
|
Discussion
P
a
per
|
Discussion
P
a
per
|
involved in photoreactions and decreases as CDOM is microbially reworked (Helms et al., 2008).
The presence of aromatic rings in CDOM often also results in fluorescence (Stedmon and Álvarez-Salgado, 2011).
Fluorescent DOM (FDOM) excitation/emission (Ex/Em) spectra allow discriminating 5
between different pools of CDOM (Coble, 2007; Stedmon and Bro, 2008; Mopper et al., 2007; Yamashita et al., 2010). The substances that are excited and emit in the UV spectral range commonly correspond to labile proteinaceous DOM, and therefore are referred to as amino acid-like (tyrosine- and tryptophan-like) FDOM (e.g. Coble, 1996). The substances that are excited in the UV spectral range, but emit in the visible spec-10
tral range were identified as fulvic- and humic-like FDOM (Gueguen and Kowalczuk, 2013). Tyrosine- and Tryptophan-like substances have been used for the assessment of in situ primary productivity, while humic-like substances are used for the indication of allochtonous (e.g. riverine) DOM or microbial DOM transformation (Coble, 1996).
Although the CDOM and FDOM distribution and cycling has been described for many 15
open ocean sites (Nelson and Siegel, 2013; Jorgensen et al., 2011), specific sources and factors influencing their composition and transformations are yet not well under-stood.
For example, CDOM accumulation is often related to nutrient remineralization (Swan et al., 2009; Nelson and Siegel, 2013). However, the effects of nutrient variability on 20
CDOM concentration and on the relationship between CDOM and DOC are largely understudied.
Stedmon and Markager (2005) have reported that nutrients affect freshly produced marine FDOM pools in an Arctic fjord system. In their study, the amino acid-like flu-orescence was enhanced under phosphate and silica limitation, but was independent 25
from phytoplankton composition. Bacterially produced humic-like FDOM components were reported to accumulate under phosphate and silica limitation as well. However, the authors revealed some doubts about a setup of phosphorus limitation. Therefore, the influence of inorganic nutrients on FDOM components remains to be resolved.
BGD
12, 7209–7255, 2015Effects of nitrate and phosphate supply on chromophoric and fluorescent dissolved
organic matter
A. N. Loginova et al.
Title Page
Abstract Introduction
Conclusions References
Tables Figures
◭ ◮
◭ ◮
Back Close
Full Screen / Esc
Printer-friendly Version Interactive Discussion
Discussion
P
a
per
|
Discussion
P
a
per
|
Discussion
P
a
per
|
Discussion
P
a
per
|
As the Eastern Tropical North Atlantic (ETNA) is an open ocean region with, suppos-edly, little terrestrial DOM input, DOM has to be mainly produced by pelagic production. In classical view, the ETNA is considered as an “excess nitrogen (N)” region com-pared to the “Redfield N : P ratio” of 16 (see Redfield, 1987 and Gruber and Sarmento, 1997) reflecting high rates of biological N-fixation due to Saharan dust deposition, with 5
N : P ratios 16–25 at depth (see Fanning, 1992). It features a shallow OMZ at about 100 m depth (Brandt et al., 2015) and a deeper OMZ at approximately 300–500 m depth with oxygen concentrations up to 40 µmol kg−1(Karstensen et al., 2008). How-ever, eddies originating in the Mauritanian upwelling regime and propagating westward can harbor much lower oxygen concentrations (∼4 µmol O2kg−
1
; Karstensen et al., 10
2014), potentially enabling N-loss processes (Strous et al., 2006; Kartal et al., 2007; Jetten et al., 2009; Jayakumar et al., 2009). Those mesoscale eddies, may support nutrient loaded but relatively N deficient waters to the surface (McGillicudy et al., 2003, 2007; Mathis et al., 2007). Furthermore, it has been shown that non-diazotroph primary production in the ETNA can be N-limited (Franz et al., 2012; Hauss et al., 2013). 15
Here we investigated the effects of different DIN and dissolved inorganic phospho-rous (DIP) concentrations and of their supply ratio (DIN : DIP) on DOM “quality” by using spectroscopic methods of DOM analysis (e.g. accumulation and properties of CDOM and FDOM) during mesocosm experiments with natural pelagic communities of the Cape Verdean Archipelago, an area, affected by low oxygen-core eddies.
20
During these mesocosm experiments, we tested whether (1) pelagic production is a source of CDOM and FDOM, (2) CDOM and FDOM accumulation and composi-tion are affected by changes in nutrient stoichiometry, and whether (3) the relationship between CDOM absorption and DOC concentrations is stable under variable nutrient concentrations.
25
To do so, DOC concentrations, CDOM absorption and CDOM properties (S275–295
and SR), FDOM fluorescence, as well as chlorophyll a (chl a), and bacterial
BGD
12, 7209–7255, 2015Effects of nitrate and phosphate supply on chromophoric and fluorescent dissolved
organic matter
A. N. Loginova et al.
Title Page
Abstract Introduction
Conclusions References
Tables Figures
◭ ◮
◭ ◮
Back Close
Full Screen / Esc
Printer-friendly Version Interactive Discussion
Discussion
P
a
per
|
Discussion
P
a
per
|
Discussion
P
a
per
|
Discussion
P
a
per
|
a part of the Collaborative Research Centre 754 (SFB754) “Climate–Biogeochemistry Interactions in the Tropical Ocean” (www.sfb754.de).
2 Methods
2.1 Setup of the mesocosms experiment
Two 8-day mesocosm experiments were conducted consecutively in October 2012 at 5
the Instituto Nacional de Desenvolvimento das Pescas (INDP), Mindelo, Cape Verde. Seawater from 5 m depth was collected into four 600 L tanks in the night of the 1 to 2 Ocotber and 11 to 12 October for the first and second experiment, respectively. The sampling was done with the RVIslândiasouth of São Vicente (16◦44.4′N, 25◦09.4′W).
For each experiment, sixteen mesocosm-bags were placed floating in 4 cooling baths 10
that were kept at surface seawater temperature (25.9–28.7◦C) using “flow-through” principle with the water from the Mindelo bay in front of the INDP. The mesocosms were filled alternately (about 10 s per filling event) and randomly from the tanks by gravity flow using submerged hose in order to achieve even distribution of the water and minimize bubble formation. A mesh to filter zooplankton was not used. The precise 15
volume of each mesocosm was determined by addition of 1.5 mmol of silicate and subsequent measurement of the resulting silicate concentration. The water volume in the mesocosms ranged from 106 to 145 L. For simulation of surface water conditions, the mesocosms were shaded with blue transparent lids to approximately 20 % of sunlit irradiation (56–420 µ E m−2s−1, depending on cloud cover).
20
Nutrients were manipulated by adding different amounts of phosphate (DIP) and nitrate (DIN). In the first experiment, the DIP supply was varied (Varied P) at relatively constant DIN concentrations in twelve of the sixteen mesocosms, while in the second experiment the initial DIN concentrations were varied (Varied N) at constant DIP supply in twelve of the sixteen mesocosms.
25
BGD
12, 7209–7255, 2015Effects of nitrate and phosphate supply on chromophoric and fluorescent dissolved
organic matter
A. N. Loginova et al.
Title Page
Abstract Introduction
Conclusions References
Tables Figures
◭ ◮
◭ ◮
Back Close
Full Screen / Esc
Printer-friendly Version Interactive Discussion
Discussion
P
a
per
|
Discussion
P
a
per
|
Discussion
P
a
per
|
Discussion
P
a
per
|
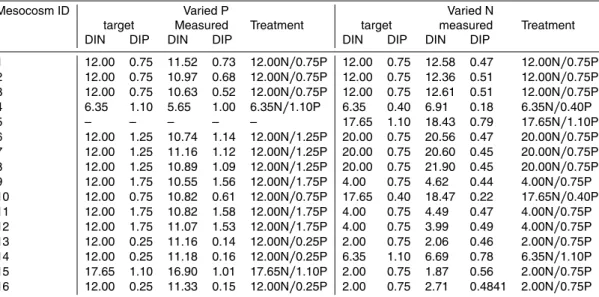
In addition to this, four “cornerpoints”, where both, DIN and DIP, were varied, were chosen to be repeated during both experiments (see target DIN and DIP values in Ta-ble 1). However, during the first experiment, setting the nutrient levels in one of the “cornerpoint” mesocosms (mesocosm 10) was not successful and it was decided to adjust the DIN- and DIP-concentrations in this mesocosm to “Redfield N : P ratio” of 16 5
(Redfield, 1987) and therefore add another replicate to the treatment 12.00N/0.75P. Another “cornerpoint” mesocosm (mesocosm 5) during the first experiment was ex-cluded from further analyses as no algal bloom had developed.
Initial sampling for biogeochemical parameters was accomplished immediately after the mesocosms filling (day 1). Nutrients were added after the initial sampling. Further 10
water sampling was conducted daily between 9 and 10.30 a.m. on days 2 to 8.
The target and actual nutrient concentrations are shown in Table 1 and the corre-sponding treatment indications will be used in the following.
2.2 Sampling and analyses
2.2.1 Particulate organic matter
15
Samples of 0.5 L for chl a measurements were vacuum-filtered (<200 mbar) onto Whatman GF/F filters (25 mm, 0.7 µm), 1 mL of ultrapure water was added and the filters were frozen at−20◦C for at least 24 h. Subsequently, pigments were extracted
using acetone and measured in a Trilogy®fluorometer (Turner Designs) calibrated with a chlastandard (Anacystis nidulans, Walter CMP, Kiel, Germany) dilution series (Par-20
sons et al., 1984).
For bacterial cell counts, samples (5 mL) were fixed with 2 % formaldehyde, frozen at−80◦C and transported to the home laboratory. Samples were diluted 1 : 3, stained
with SYBR-Green and measured at a flow rate of 11.0 µL min−1by flow cytometry (FAC-Scalibur, Becton Dickinson, San Jose, CA, USA).
BGD
12, 7209–7255, 2015Effects of nitrate and phosphate supply on chromophoric and fluorescent dissolved
organic matter
A. N. Loginova et al.
Title Page
Abstract Introduction
Conclusions References
Tables Figures
◭ ◮
◭ ◮
Back Close
Full Screen / Esc
Printer-friendly Version Interactive Discussion
Discussion
P
a
per
|
Discussion
P
a
per
|
Discussion
P
a
per
|
Discussion
P
a
per
|
2.2.2 Dissolved organic matter
Dissolved organic carbon (DOC) duplicate samples (20 mL) were filtered through com-busted GF/F filters and collected in comcom-busted glass ampoules. Samples were acidified with 80 µL of 85 % phosphoric acid, flame sealed and stored at 4◦C in the dark until
analysis. 5
DOC samples were analysed by applying the high-temperature catalytic oxidation method (TOC-VCSH, Shimadzu) after Sugimura and Suzuki (1998). The instrument was calibrated every 8–10 days by measuring of 6 standard solutions of 0, 500, 1000, 1500, 2500 and 5000 µg C L−1, prepared using a potassium hydrogen phthalate stan-dard (Merck 109017). Every day before each set of measurements, ultrapure (MilliQ) 10
water was used for setting the instrument baseline, following by the measurement of the deep-sea water standard (Hansell, 2005) with known DOC concentration in order to verify result representation by the instrument. Additionally, two DOC control samples were prepared each day of measurement using a potassium hydrogen phthalate stan-dard (Merck 109017). The control samples had dissolved carbon concentrations within 15
the range of those in samples and were measured along the sample analyses in order to avoid mistakes due to baseline flow during measurements. The DOC concentration was determined in each sample out of 5 to 8 replicate injections.
For chromophoric dissolved organic matter (CDOM) and fluorescent dissolved or-ganic matter (FDOM), 2×35 mL samples for each parameter were collected daily into
20
combusted (450◦C, 8 h) amber-glass vials after filtering through 0.45 µm polyethersul-fone syringe filters (CHROMAPHIL® Xtra PES-45/25, MACHEREY-NAGEL GmbH & Co.KG). The samples were stored at 4◦C in the dark during 6 month pending analy-ses. All samples were brought to room temperature before analyanaly-ses.
Absorption of chromophoric dissolved organic matter (CDOM) was detected using 25
a 100 cm path length liquid waveguide cell (LWCC-2100, World Precision Instruments, Sarasota, Florida) and a UV-VIS spectrophotometer (Ocean Optics USB 4000) in
BGD
12, 7209–7255, 2015Effects of nitrate and phosphate supply on chromophoric and fluorescent dissolved
organic matter
A. N. Loginova et al.
Title Page
Abstract Introduction
Conclusions References
Tables Figures
◭ ◮
◭ ◮
Back Close
Full Screen / Esc
Printer-friendly Version Interactive Discussion
Discussion
P
a
per
|
Discussion
P
a
per
|
Discussion
P
a
per
|
Discussion
P
a
per
|
junction with the Ocean Optics DT-MINI-CS light source. The absorbance was mea-sured relatively to ultrapure water (MilliQ) by injection to the cell with a peristaltic pump. For the determination of fluorescent dissolved organic matter (FDOM), 3-D fluores-cence spectroscopy – Excitation-Emission Matrix Spectroscopy (EEMs) – was per-formed using a Cary Eclipse Fluorescence Spectrophotometer (Agilent Technologies) 5
equipped with a xenon flash lamp. The fluorescence spectra for samples were mea-sured in a 4-optical window 1 cm Quartz SUPRASIL® precision cell (Hellma® Analyt-ics). The blank-3-D fluorescence spectra and Water Raman scans were performed daily using an Ultra-Pure Water Standard sealed cuvette (3/Q/10/WATER; Starna Sci-entific Ltd). The experimental wavelength range for sample and ultra-pure water scans 10
was 230 to 455 nm in 5 nm intervals on excitation and 290 to 700 nm in 2 nm inter-vals on emission. Water Raman scans were recorded from 285 to 450 nm at 1 nm intervals for emission at the 275 nm excitation wavelength (Murphy et al., 2013). All fluorescence measurements were managed at 19◦C (Cary Single Cell Peltier Acces-sory, VARIAN), PMT 900V, 0.2 s integration times and 5 nm slit width on excitation 15
and emission monochromators. The absorbance for EEMs corrections was procured simultaneously with Shimadzu® 1800 UV-VIS double-beam spectrophotometer. The absorbance was measured at the room temperature (∼19◦C) in 2-optical window 5 cm
Quartz SUPRASIL®precision cell (Hellma® Analytics). The measurements were done at 1 nm wavelengths intervals from 230 to 750 nm against MilliQ water as a reference. 20
The obtained data were converted to absorbance in a 1 cm cell.
2.3 Data evaluation
2.3.1 CDOM
The measured CDOM absorbance spectra were corrected to the refractive index of remaining particulate matter and colloids after Zhang et al. (2009) and for salinity after 25
BGD
12, 7209–7255, 2015Effects of nitrate and phosphate supply on chromophoric and fluorescent dissolved
organic matter
A. N. Loginova et al.
Title Page
Abstract Introduction
Conclusions References
Tables Figures
◭ ◮
◭ ◮
Back Close
Full Screen / Esc
Printer-friendly Version Interactive Discussion
Discussion
P
a
per
|
Discussion
P
a
per
|
Discussion
P
a
per
|
Discussion
P
a
per
|
et al. (1981):
aλ=2.303A(λ)/L; (1)
whereaλ– is the absorption coefficient at wavelengthλ(m−1),A(λ) – is the absorbance value at same wavelength andL– is the effective optical path length (m).
Commonly, absorption coefficients at 355 (a355) and 375 (a375) nm are used to
ex-5
press CDOM concentrations in coastal waters (Granskog et al., 2007; Stedmon et al., 2011), since CDOM concentrations there are very high, and absorption coefficient at 440–445 nm (a440) is used for comparison of field CDOM measurements to remote
sensing (Swan et al., 2013).
Open ocean waters show only very low absorbance at wavelengths of 400–600 nm. 10
Therefore, absorption at 325 nm (a325) is often used for expression of the open ocean
CDOM concentrations (Nelson and Siegel, 2013).
The area offCape Verdean Archipelago, where water for mesocosms was taken, is not influenced by river inflow and is considered as the open ocean area. Thus,a325was
chosen for expression of CDOM concentration. For comparison of CDOM properties 15
with models developed previouslya355anda375were obtained, as well.
No universal wavelength range or method is used in the literature for calculation of CDOM spectral slopes (S). Instead, S is often calculated by nonlinear least square fitting for relatively long wavelength ranges and by log-transformed linear regression for shorter wavelength ranges (Twardowski et al., 2004; Helms et al., 2008). Both, 20
nonlinear fitting and log-transformed linear regression, as well as several wavelength ranges, were used in this work for estimation of CDOM properties and their comparison to the literature.
The spectral slope for the interval 320–500 nm (SSEMO) was determined by fitting
the absorption spectra to the simple exponential model with offset (SEMO; Twardowski 25
et al., 2004) using nonlinear least square fitting (MATLAB, The MathWorks Inc.). This model was chosen as it explained best the shape of CDOM absorption spectra,
BGD
12, 7209–7255, 2015Effects of nitrate and phosphate supply on chromophoric and fluorescent dissolved
organic matter
A. N. Loginova et al.
Title Page
Abstract Introduction
Conclusions References
Tables Figures
◭ ◮
◭ ◮
Back Close
Full Screen / Esc
Printer-friendly Version Interactive Discussion
Discussion
P
a
per
|
Discussion
P
a
per
|
Discussion
P
a
per
|
Discussion
P
a
per
|
tained in our study, in the given wavelength range from all nonlinear models tested after Twardowski et al. (2004).
Spectral slopes for the intervals 275–295 nm (S275–295) and 350–400 (S350–400) were
calculated after Helms et al. (2008) using log-transform linear regression.
The CDOM alteration indicator, slope ratio (SR), was calculated after Helms
5
et al. (2008) as well, as ratio ofS275–295toS350–400.
To describe the CDOM properties the following equation was used:
SSEMO=α+β/a375; (2)
whereα and β are the regression coefficients. The properties were compared to the model of Stedmon and Markager (2001) for marine CDOM developed for the Greenland 10
Sea, in whichα=7.4 andβ=1.1.
The variability of the relationship a355/DOC vs. S275–295 was compared with the
model developed by Fichot and Benner (2012) for DOC calculation from knowna355
andS275–295:
a355/DOC=e(γ−δS275–295)+e(ε−ζ S275–295); (3)
15
where γ=5.679, δ=81.299, ε=8.459 and ζ=241.052 are regression coefficients developed for the river estuaries (after Fichot and Benner, 2012).
2.3.2 FDOM
The 3-D fluorescence spectra were corrected for spectral bias, background signals and inner filter effects. Each EEM was normalized to the area of the ultra-pure water Ra-20
man peaks, measured in the same day. EEMs were combined into three-dimensional data array, analyzed by PARAFAC (Stedmon and Bro, 2008) and validated by split-half analysis using “drEEM toolbox for MATLAB” after Murphy et al. (2013).
BGD
12, 7209–7255, 2015Effects of nitrate and phosphate supply on chromophoric and fluorescent dissolved
organic matter
A. N. Loginova et al.
Title Page
Abstract Introduction
Conclusions References
Tables Figures
◭ ◮
◭ ◮
Back Close
Full Screen / Esc
Printer-friendly Version Interactive Discussion
Discussion
P
a
per
|
Discussion
P
a
per
|
Discussion
P
a
per
|
Discussion
P
a
per
|
the possibility of identifying the instrument noise as a signal (e.g. Stedmon and Mark-ager, 2005). The fluorescence of each component is stated as fluorescence at exci-tation and emission maximums in Raman units (RU). The spectral characteristics of these components are described in Table 3.
2.3.3 Mesocosm data treatment
5
Based on the nutrient component that was mainly varied, the experiments are referred to as Varied P and Varied N in the following.
High variability of CDOM components (Fig. S1) was observed on day 1 and day 2 of Varied P and day1 of Varied N. This variability was likely associated to the filling and manipulation of the mesocosm bags and vanished afterwards. These days were 10
excluded from further calculations, and day 3 and day 2 were defined as “start” or “be-ginning” of Varied P and Varied N, respectively. Day 8 was defined as the “end” of both experiments. To exclude initial variability, changes of the different DOM parameters over time were calculated as the difference between sampling day and start day:
∆Ci(k)=Ci(k)−Ci(start); (4)
15
whereC is a concentration, absorption or fluorescence intensity, i is a mesocosm id (i =1–16) andk is the day of experiment.
For the presentation of the development over time, POM and ∆DOM values were averaged for each nutrient treatment (see Table 1, Figs. 1 and 2).
The “cornerpoints” are not presented in the DOM development plots, since both DIN 20
and DIP in them were modified. Therefore, including these treatments could bias the interpretation of effects induced by single inorganic nutrients. However, in plots and analyses where DIP or DIN influence was investigated all treatments were included to avoid the single nutrient effect overestimation (see Figs. 3–5).
For an estimation of the drivers of changes in DOM optical properties, the covariance 25
of total accumulation of DOM compounds (∆8DOM) with the cumulative sum of POM
BGD
12, 7209–7255, 2015Effects of nitrate and phosphate supply on chromophoric and fluorescent dissolved
organic matter
A. N. Loginova et al.
Title Page
Abstract Introduction
Conclusions References
Tables Figures
◭ ◮
◭ ◮
Back Close
Full Screen / Esc
Printer-friendly Version Interactive Discussion
Discussion
P
a
per
|
Discussion
P
a
per
|
Discussion
P
a
per
|
Discussion
P
a
per
|
Mean normalized deviations (mean dev. %), calculated as:
mean dev %= 100 ∆Cn
end
X
start
∆Ci(k)−∆C(k); (5)
whereC – is a concentration, absorption or fluorescence intensity, k – is the day of experiment,n– is a total number of days (n=end−start) and i – is a mesocosm ID
(i =1–16);∆Ci(k) is calculated by Eq. (4),∆C(k) – is the mean∆Cfor all mesocosms 5
at the day k, and ∆C – is average ∆C for all mesocosms during the whole experi-ment. Mean dev. (%) were tested against nutrient supply (Varied P and Varied N) and DIN : DIP supply ratio in the mesocosms at day 2 in order to estimate the nutrient and stoichiometry effect on DOM accumulation in the mesocosms.
All statistical tests in this work were performed by the use of Sigma Plot 12.0 (Systat). 10
The significance level accepted wasp <0.05.
3 Results
3.1 Particulate organic matter development
After nutrient addition, phytoplankton bloom development was observed in all meso-cosms during both experiments. Maximum chlaconcentrations in Varied P occurred at 15
day 5 (Fig. 1a), with higher concentrations in treatments with initial nutrients supplied at lower or equal to Redfield N : P ratio (12.00N/0.75P, 12.00N/1.25P, 12.00N/1.75P). However, no significant relationship of the cumulative sums of chla(Σchla) to DIP
con-centration was recognized (p >0.05,n=15). In Varied N, chlaconcentrations reached its maximum at day 6 (Fig. 1b) andΣchla were significantly affected by the initial DIN
20
concentrations (Wilcoxon rank test:p <0.001,n=16), indicating that DIN was limiting phytoplankton biomass buildup.
BGD
12, 7209–7255, 2015Effects of nitrate and phosphate supply on chromophoric and fluorescent dissolved
organic matter
A. N. Loginova et al.
Title Page
Abstract Introduction
Conclusions References
Tables Figures
◭ ◮
◭ ◮
Back Close
Full Screen / Esc
Printer-friendly Version Interactive Discussion
Discussion
P
a
per
|
Discussion
P
a
per
|
Discussion
P
a
per
|
Discussion
P
a
per
|
(pairedt test: p >0.05, n=31; Fig. 1c and d). In Varied P, cumulative sums of bac-terial abundance (Σbac) were not related to the initial DIP supply (p >0.05, n=15).
Highest bacterial abundance was observed at day 6, yielding 2.0±0.7×10⁶mL−1
av-eraged for all treatments (Fig. 1c). In contrast, in Varied N, Σbac indicated significant
covariance to DIN amendments (p <0.01,n=16). The highest bacterial abundance of 5
2.6±0.2×10⁶mL−1was observed at day 6 in the treatment with the highest initial DIN
concentration (20.00N/0.75P).
3.2 Dissolved organic matter
3.2.1 Dissolved organic matter abundance
Initial DOC concentrations (day 3), did not differ significantly between treatments in 10
Varied P (one way ANOVA: p >0.05, n=15) and was 99±5 µmol L−1 on average.
In contrast, in Varied N initial DOC concentrations (day 2) varied significantly among mesocosms (Holm–Sidak test:p <0.001,n=16) with 87±2 µmol L−1in the treatment
with second lowest initial DIN concentrations (4.00N/0.75P), 91±1 µmol L−1in the
Red-field DIN : DIP treatment (12.00N/0.75P) and in the treatment with the lowest initial DIN 15
concentrations (2.00N/0.75P), and 95±3 µmol L−1in the treatment with the highest
ini-tial DIN concentrations (20.00N/0.75P). The calculation of DOC accumulation (∆DOC) thus allowed a better comparison of bulk DOC dynamics between treatments than ab-solute concentrations and will be given in following.
During both experiments, DOC accumulated significantly over time (paired t test: 20
p <0.001,n=31) with higher accumulation observed in Varied N (Mann–Whitney rank sum test:p <0.001, n=120). On day 8, accumulation of DOC (∆8DOC) was highest
(33±23 µmol L−1) in the highest DIP treatment (12.00N/1.75P) in Varied P (Fig. 2a),
as well as in the highest DIN treatment (20.00N/0.75P) in Varied N (67±3 µmol L−1)
(Fig. 2b). 25
Initial average CDOM absorption at 325 nm (a325) was 0.17±0.03 m− 1
and 0.15±
0.01 m−1
BGD
12, 7209–7255, 2015Effects of nitrate and phosphate supply on chromophoric and fluorescent dissolved
organic matter
A. N. Loginova et al.
Title Page
Abstract Introduction
Conclusions References
Tables Figures
◭ ◮
◭ ◮
Back Close
Full Screen / Esc
Printer-friendly Version Interactive Discussion
Discussion
P
a
per
|
Discussion
P
a
per
|
Discussion
P
a
per
|
Discussion
P
a
per
|
Supplement). The starting CDOM absorption values were not significantly different be-tween treatments (one way ANOVA:p >0.05,n=31). However, they differed between the two experiments (one way ANOVA:p <0.05,n=31). CDOM accumulation (∆a325)
will be given in following, as it allows a better comparison of CDOM dynamics between experiments than absolute absorption coefficients.
5
CDOM accumulated over time during both experiments (pairedttest:p <0.001,n=
31). CDOM accumulation on day 8 (∆8a325) was the highest in the medium to high DIP
treatment (12.00N/0.75P, 12.00N/1.25P, 12.00N/1.75P) in Varied P (0.35±0.03 m−1)
(Fig. 2c) and in the highest DIN treatment (20.00N/0.75P) in Varied N (0.48±0.13 m−1)
(Fig. 2d). 10
Spectral slopes, calculated within the 275–295 nm spectral range, (S275–295) differed
between treatments in the beginning of Varied N (one way ANOVA:p <0.05, n=16), whereas treatments in the beginning of Varied P were not significantly different (one way ANOVA:p <0.05,n=15). In contrast, initial values of spectral slopes, calculated within the 320–500 nm spectral range (SSEMO), varied between treatments at the
be-15
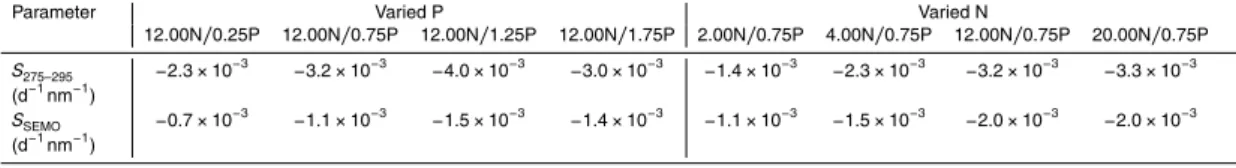
ginning of Varied P (one way ANOVA: p <0.05, n=15), but not at the beginning of Varied N (one way ANOVA: p <0.05, n=16). In order to avoid the influence of ini-tial differences of spectral slopes on data analyses, daily changes in spectral slopes (∆S275–295 and ∆SSEMO) were calculated. More negative ∆S275–295 and∆SSEMO indi-cate that spectral slopes are decreasing. As spectral slope decrease, CDOM absorp-20
tion at longer wavelengths becomes higher, indicating accumulation of HMW CDOM.
S275–295decreased over time in both experiments (pairedt test:p <0.001, n=31).
The most negative∆S275–295 values (−0.016±0.004 nm− 1
and−0.014±0.002 nm−1)
were observed in the treatments with medium and high initial DIP concentrations (12.00N/0.75P, 12.00N/1.25P, 12.00N/1.75P) at the end (day 8) of Varied P (Fig. 2e) 25
and in the treatment with the highest initial DIN concentrations (20.00N/0.75P) in at the end (day 8) of Varied N (Fig. 2f), respectively. Values for ∆SSEMO decreased on
average by −7±3 µm−1 from the beginning (day 3 and day 2) until the end (day 8)
dynam-BGD
12, 7209–7255, 2015Effects of nitrate and phosphate supply on chromophoric and fluorescent dissolved
organic matter
A. N. Loginova et al.
Title Page
Abstract Introduction
Conclusions References
Tables Figures
◭ ◮
◭ ◮
Back Close
Full Screen / Esc
Printer-friendly Version Interactive Discussion
Discussion
P
a
per
|
Discussion
P
a
per
|
Discussion
P
a
per
|
Discussion
P
a
per
|
ics mirrored those of∆S275–295. Both decreased faster in treatments with medium and
high initial DIP concentrations (12.00N/0.75P, 12.00N/1.25P, 12.00N/1.75P) in Varied P and in treatment with the highest initial DIN concentrations (20.00N/0.75P) in Varied N (Table 2).
Derived from measured parameters, the ratio (SR) ofS275–295 and spectral slopes,
5
calculated within 350–400 nm wavelength range (S350–400), had much larger
uncertain-ties within treatments than spectral slopes themselves. The initial (day 3 and day 2)SR
were not statistically different among treatments in each experiment (one way ANOVA:
p >0.05,n=31) and between experiments (one way ANOVA:p >0.05,n=31).
SR increased only slightly over time in almost all mesocosms of Varied P (paired 10
ttest:p <0.05,n=15; Fig. 2g). In Varied N,SRincreased significantly on day 5 (paired
ttest:p <0.001,n=16) and decreased again slightly on day 7 (pairedttest:p <0.05,
n=16) in almost all mesocosms (Fig. 2h).
Three FDOM components with distinct spectral properties were identified during PARAFAC analysis of our dataset. The first FDOM component (Comp.1) was excited at 15
235 nm and emitted at 440–460 (300) nm, the second (Comp.2) and the third (Comp.3) FDOM components were excited at 275 (<230) and 265 nm and emitted at 340 and 294 nm respectively (Table 3, Fig. S2).
The initial fluorescence of Comp.1 was 0.019±0.001 Raman Units (RU) in Varied P
and 0.0108±0.0009 RU in Varied N. Initially, Comp.1 fluorescence was not significantly
20
different between treatments in both, Varied P and Varied N (one way ANOVA:p >0.05,
n=31) in contrast to initial differences between two experiments (one way ANOVA:
p <0.01,n=31).
Subtracting the initial fluorescence of Comp.1 (∆Comp.1 calculating) allowed tracing the accumulation of freshly-produced Comp.1 during the experiments (Fig. 2i and j). 25
∆Comp.1 indicated an accumulation of Comp.1 over time in both experiments (paired
t test: p <0.001, n=31). In Varied P, differences in∆Comp.1 fluorescence between treatments at the end of experiment were not significant (t test: p >0.05, n=6) and revealed 0.014±0.004 RU on the average for all mesocosms (Fig. 2i). In Varied N,
BGD
12, 7209–7255, 2015Effects of nitrate and phosphate supply on chromophoric and fluorescent dissolved
organic matter
A. N. Loginova et al.
Title Page
Abstract Introduction
Conclusions References
Tables Figures
◭ ◮
◭ ◮
Back Close
Full Screen / Esc
Printer-friendly Version Interactive Discussion
Discussion
P
a
per
|
Discussion
P
a
per
|
Discussion
P
a
per
|
Discussion
P
a
per
|
highest∆Comp.1 fluorescence intensities of 0.025±0.004 RU were found in the
treat-ment with highest DIN supply (20.00N/0.75P) (Fig. 2j). Here, clear differences were observed between treatments at the end of experiment (one way ANOVA: p <0.01,
n=11).
The fluorescence intensities of Comp.2 were almost identical at the start of Varied 5
P and Varied N, yielding 0.029±0.005 RU and 0.029±0.007 RU, respectively. No
significant differences were observed between treatments (one way ANOVA:p >0.05,
n=31) and experiments (one way ANOVA:p >0.05,n=31).
Comp.2 fluorescence increased in all mesocosms over time (pairedttest:p <0.001,
n=31) (Fig. 2k and l). At the end (day 8) of Varied P, the maximum∆Comp.2 fluores-10
cence was 0.063±0.007 RU in the treatment with highest DIP addition (12.00N/1.75P)
(Fig. 2k). It was significantly higher than that in the treatment with the lowest initial DIP concentration (12.00N/0.25P) (t test: p <0.05, n=6) at day 8. Differences between treatments with the highest (20.00N/0.75P) and the lowest (2.00N/0.75P) initial DIN concentrations at the end (day 8) of Varied N were not significant (t test: p >0.05, 15
n=6) and the maximum∆Comp.2 fluorescence comprised 0.04±0.03 RU on average
for all mesocosms (Fig. 2l).
The Comp.3 fluorescence intensity was highly variable during both experiments (Fig. 2m and n). Its starting values were not statistically different between Varied P and Varied N and comprised 0.03±0.02 RU in both.
20
In Varied P, Comp.3 fluorescence intensity increased from start until day 5 (paired
ttest:p <0.05,n=15) and decreased after day 6 until end of experiment (pairedttest:
p <0.05, n=15) (Fig. 2m). In Varied N, Comp.3 accumulated significantly only after day 6 (pairedttest:p <0.05,n=16) (Fig. 2n).
3.2.2 Assessing the origin of optically active dissolved organic matter
25
BGD
12, 7209–7255, 2015Effects of nitrate and phosphate supply on chromophoric and fluorescent dissolved
organic matter
A. N. Loginova et al.
Title Page
Abstract Introduction
Conclusions References
Tables Figures
◭ ◮
◭ ◮
Back Close
Full Screen / Esc
Printer-friendly Version Interactive Discussion
Discussion
P
a
per
|
Discussion
P
a
per
|
Discussion
P
a
per
|
Discussion
P
a
per
|
and bacterial abundance (Σbac) of each mesocosm (Sect. S3) were tested against total
accumulation of DOM components at day 8 (∆8DOM) using linear regression analysis.
Values of∆8DOC correlated significantly withΣchlain Varied P (p <0.05,n=15) and
in Varied N (p <0.001,n=16), but not withΣbac (p >0.05,n=15, 16, respectively).
To look at CDOM properties, the relationship between SSEMO and a375 were
com-5
pared to an Eq. (2) parametrization by Stedmon and Markager (2001) for marine CDOM of the Greenland Sea. In our study, no apparent differences between treatments were found and all data for SSEMO vs. a375 could be expressed by Eq. (2). However,
our data went beyond the limits defined by Stedmon and Markager, except those in the beginning of experiment (Fig. 3). Therefore, new parameterization of the Eq. (2) was 10
obtained in this study by nonlinear least square fitting method (MATLAB, The Math-Works Inc.), withα=17.5 andδ=0.2.
Furthermore, CDOM accumulation (∆8a325) correlated significantly toΣchla in
Var-ied P (p <0.05,n=15) and Varied N (p <0.001,n=16), indicating that phytoplankton biomass was regulating CDOM dynamics in both experiments. While no covariance of 15
∆8a325 withΣbac was observed during Varied P (p >0.05,n=15), a significant
corre-lation of∆8a325withΣbac (r 2
=0.33,p <0.05,n=16) occurred in Varied N, indicating that bacteria may be partially responsible for CDOM dynamics under DIN stimulation.
∆Comp.1 behaved similar to ∆a325 during both experiments. However, ∆8Comp.1
was neither correlated toΣbac (p >0.05, n=15), nor toΣchlaconcentration (p >0.05,
20
n=15) in Varied P. In contrast ∆8Comp.1 was significantly correlated to both, Σchla
(p <0.001,n=16) andΣbac(p <0.05,n=16) in Varied N.
Similar to ∆8Comp.1, in Varied P, ∆8Comp.2 did not reveal a significant relation-ship toΣchla(p >0.05,n=15) concentration or toΣbac(p >0.05,n=15). In Varied N,
∆8Comp.2 also did not correlate toΣchlaconcentration (p >0.05,n=16), but it
covari-25
ate significantly toΣbac (p <0.01, n=16), supporting a potential influence of bacterial abundance on fluorescence intensities of Comp.2.
BGD
12, 7209–7255, 2015Effects of nitrate and phosphate supply on chromophoric and fluorescent dissolved
organic matter
A. N. Loginova et al.
Title Page
Abstract Introduction
Conclusions References
Tables Figures
◭ ◮
◭ ◮
Back Close
Full Screen / Esc
Printer-friendly Version Interactive Discussion
Discussion
P
a
per
|
Discussion
P
a
per
|
Discussion
P
a
per
|
Discussion
P
a
per
|
In contrast to ∆8Comp.1 and ∆8Comp.2, ∆8Comp.3 did not covariate with Σbac
(p >0.05, n=15, 16) nor with Σchla concentration (p >0.05, n=15, 16) in both
ex-periments.
3.2.3 Effect of inorganic nutrients on optically active DOM
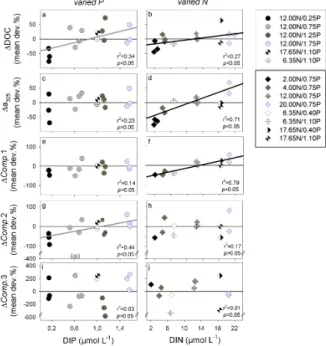
In order to access the nutrient influence on DOM accumulation, mean normalized de-5
viations (mean dev. %) of ∆DOC, ∆CDOM (∆a325) and ∆FDOM calculated for each
mesocosm (including “corner” points) and tested against initial DIP supply in Varied P, and against initial DIN supply in Varied N using linear regression analysis (Fig. 4).
DOC accumulation was related to the initial inorganic nutrients supply in both ex-periments. Higher∆DOC (mean dev. %) corresponded to higher DIP supply (p <0.05, 10
n=15) in Varied P (Fig. 4a) and to higher DIN supply (p <0.05, n=16) in Varied N (Fig. 4b). However, no overall effect of DIN : DIP ratios was revealed when data from both experiments were combined (p >0.05,n=31). Therefore, accumulation of DOC, in general, was dependent rather on total initial amount of macronutrients, than on the relative concentration of DIN to DIP.
15
∆CDOM (mean dev. %) correlated significantly to DIN supply (p <0.001, n=14) (Fig. 4c), but not to DIP supply (p >0.05, n=15) (Fig. 4d). Similar to ∆DOC (mean dev. %), no effect of initial DIN : DIP ratios on∆CDOM (mean dev. %) were determined (p >0.05,n=31).
∆Comp.1 (mean dev. %) did not exhibit a significant relationship to the initial DIP 20
supply (p >0.05,n=15) (Fig. 4e), but correlated significantly to the initial DIN concen-trations (p <0.001,n=12) (Fig. 4f).
Oppositely,∆Comp.2 (mean dev. %) increased with initial DIP supply (p <0.05,n=
14) (Fig. 4g), but not with initial DIN supply (p >0.05, n=12) (Fig. 4h). Thus, Comp.2 accumulation was higher under the higher DIP concentrations.
25
In contrast to both previous FDOM components, ∆Comp.3 (mean dev. %) did not reveal covariance neither to DIP (p >0.05, n=15) (Fig. 4i), nor to DIN (p >0.05,n=
BGD
12, 7209–7255, 2015Effects of nitrate and phosphate supply on chromophoric and fluorescent dissolved
organic matter
A. N. Loginova et al.
Title Page
Abstract Introduction
Conclusions References
Tables Figures
◭ ◮
◭ ◮
Back Close
Full Screen / Esc
Printer-friendly Version Interactive Discussion
Discussion
P
a
per
|
Discussion
P
a
per
|
Discussion
P
a
per
|
Discussion
P
a
per
|
No overall effect of DIN : DIP ratios on ∆Comp.1, ∆Comp.2 and ∆Comp.3 (mean dev. %) was determined when data from both experiments were combined (p >0.05,
n=27).
Hence, accumulation of Comp.1 was dependent on the initial DIN concentrations, ac-cumulation of Comp.2 increased with increase of initial DIP concentrations and Comp.3 5
was unaffected by nutrient treatments.
3.2.4 Nutrients effects on the relationship between CDOM and DOC
To investigate the relationship between CDOM absorption and DOC concentrations during the course of the experiments, daily DOM accumulation (∆DOC) was tested against daily accumulation of CDOM at 325 nm (∆a325) by linear regression analysis
10
for each mesocosm and for all data combined (Fig. 5a and b). Direct relationships were observed between∆DOC and∆a325 in both, Varied P (p <0.001,n=75) and Varied
N (p <0.001, n=95).
The estimated slopes of those linear regressions, for each mesocosm for ∆a325
vs.∆DOC, were tested for correlation with the initial DIP (Fig. 5c) and DIN (Fig. 5d) 15
concentrations. Estimated slope values significantly increased with initial DIN supply (p <0.01, n=16), indicating that the CDOM fraction of DOC was affected by nutrient availability and specifically by DIN supply.
Although the relationship between CDOM and DOC revealed a dependency on initial DIN supply, the values of CDOM at 355 nm (a355) to DOC ratio (a355/DOC) did not
20
reveal a significant nutrient effect, when plotted againstS275–295(Fig. 5e).
All data ofS275–295anda355/DOC of our study can be described by the Eq. (3) with
coefficients, derived by Fichot and Benner (2012) for calculations of DOC concentra-tions. All our data points were fitting to 8 % uncertainty interval of estimation of DOC concentrations, defined by Fichot and Benner (2012) (Fig. 5e).
25
BGD
12, 7209–7255, 2015Effects of nitrate and phosphate supply on chromophoric and fluorescent dissolved
organic matter
A. N. Loginova et al.
Title Page
Abstract Introduction
Conclusions References
Tables Figures
◭ ◮
◭ ◮
Back Close
Full Screen / Esc
Printer-friendly Version Interactive Discussion
Discussion
P
a
per
|
Discussion
P
a
per
|
Discussion
P
a
per
|
Discussion
P
a
per
|
4 Discussion
Optically active DOM and its properties are often used for estimation of DOC concen-trations and processes, influencing DOM. CDOM was previously shown to accumulate along with the remineralization of inorganic nutrients (Zhang et al., 2009) and therefore, was assumed as an indicator of bacterial DOM reworking (Swan et al., 2009; Nelson 5
and Siegel, 2013). However, CDOM was also shown to be consumed during dark in-cubations (Zhang et al., 2009), and therefore characterized as containing fresh and labile DOM. For discrimination between freshly released by phytoplankton and micro-bially altered CDOM pools, specific properties of the CDOM spectrum are commonly used. Spectral slopes, for instance, can indicate a relative changes in HMW-CDOM 10
proportion in CDOM (Helms et al., 2008). Spectral slope ratios were used before to dis-criminate between biogeochemical processes influencing CDOM (Helms et al., 2008). Fluorescent fraction of CDOM (FDOM) is used for better characterization and discrim-ination between DOM pools with different spectral and therefore structural properties (Coble, 1996; Gueguen and Kowalczuk, 2013). Here, we investigated nutrient effects 15
on the production, accumulation and cycling of CDOM and FDOM, as well as nutrient effects on relationship between CDOM absorption and DOC concentrations.
4.1 Nutrient effects on the production and cycling of optically active DOM
Our results indicated that chla accumulation and bacterial growth were stimulated by DIN supply. Along with the response of POM production to inorganic nutrient amend-20
ments, changes in the optically active DOM fractions were observed.
Initial DOC concentrations, measured in both experiments (Fig. S1a, b), were in the range or slightly higher of those previously reported and modelled for the upper 30 m of the ETNA watercolumn (Hansell et al., 2009).
In both experiments, DOC accumulated over time (Fig. 2a and b) and seemed to 25
BGD
12, 7209–7255, 2015Effects of nitrate and phosphate supply on chromophoric and fluorescent dissolved
organic matter
A. N. Loginova et al.
Title Page
Abstract Introduction
Conclusions References
Tables Figures
◭ ◮
◭ ◮
Back Close
Full Screen / Esc
Printer-friendly Version Interactive Discussion
Discussion
P
a
per
|
Discussion
P
a
per
|
Discussion
P
a
per
|
Discussion
P
a
per
|
conditions (see Engel et al., 2015). That is in line with previous studies (Engel et al., 2002; Conan et al., 2007; Carlson and Hansell, 2015) showing DOM accumulation after the onset of nutrient limitation, while the chlasignal decreased.
An effect of initial nutrient concentration on DOC accumulation (Fig. 4a and b), ob-served in our study, was shown previously. In a mesocosm study with ETNA waters, 5
Franz et al. (2012) observed that higher DOC concentrations developed when the initial inorganic nitrogen supply was high. As well, DOC concentrations in their study were even higher when high DIN concentrations were combined with high DIP supply. In their mesocosm experiment in Arctic, Conan et al. (2007) and Stedmon and Mark-ager (2005) observed that at silicate-replete conditions, DOC concentrations under 10
high initial DIN supply did not vary significantly from those under high initial DIP con-centrations. In our study, silicate was also not limiting phytoplankton growth and higher DOC concentrations occurred at higher DIP as well as at higher DIN concentrations, supporting earlier findings.
Bacterial turnover may have influenced the composition of DOM (as it is seen by 15
changes in spectral slope ratios and FDOM components) while DOC concentrations seemed to be not related to bacterial abundances. This observation may be explained by rapid bacterial consumption of labile DOM accompanied by the bacterial release of altered humic-like DOM (Azam et al., 1983; Ogawa et al., 2001), which are therefore not influencing measured DOC concentrations (e.g. Kirchman, 1991).
20
CDOM absorptions were in the range of those previously reported for open wa-ters of the Atlantic Ocean at the beginning of the experiment, while the final CDOM absorptions were twice as high (Fig. S1c, d; Nelson et al., 2009; Nelson and Siegel, 2012; Swan et al., 2013). Similar to our experiments, CDOM absorption was previously shown to accumulate by factor of 2 to 3 during mesocosm studies (Zhang et al., 2009; 25
Pavlov et al., 2014).
In our experiments, the accumulation of CDOM during the phytoplankton bloom (Fig. 2c and d) as well as significant covariance to phytoplankton pigment (chl a) suggests that phytoplankton was the major source of CDOM. This is consistent with
BGD
12, 7209–7255, 2015Effects of nitrate and phosphate supply on chromophoric and fluorescent dissolved
organic matter
A. N. Loginova et al.
Title Page
Abstract Introduction
Conclusions References
Tables Figures
◭ ◮
◭ ◮
Back Close
Full Screen / Esc
Printer-friendly Version Interactive Discussion
Discussion
P
a
per
|
Discussion
P
a
per
|
Discussion
P
a
per
|
Discussion
P
a
per
|
previous studies that show CDOM to be produced by extracellular release from phy-toplankton (Romera-Castillo et al., 2010) or by phyphy-toplankton degradation or lysis (Hu et al., 2006; Zhang et al., 2009; Organelli et al., 2014).
Changes in CDOM spectral properties, such as the decrease of CDOM spectral slopes over time (Fig. 2e and f), indicated that absorption in the visible wavelength 5
range increased relatively to the UV wavelength range. As the absorption at longer wavelength is corresponding to larger molecules, we may assume that HMW-CDOM accumulated during both experiments. HMW-DOM was previously shown to be more labile for bacterial consumption than low molecular weight DOM (at molecular weight cutoffof 1 kDa) (Benner and Amon, 2015), as bacterial activity was higher, when incu-10
bating with HMW-DOM (Amon and Benner, 1996). Furthermore HMW-DOM is typically accounting to 30 to 60 % of the total DOM released via phytoplankton (Biddanda and Benner, 1997; Engel et al., 2011). Therefore we consider the spectral slope decrease over time as an indication of labile CDOM production via phytoplankton release.
In treatments with high initial DIN concentrations, bacterial abundance was signifi-15
cantly higher than in those at lower initial DIN concentrations. Furthermore, bacterial abundances correlated significantly to CDOM concentrations. We therefore suggest that higher bacterial abundance may have been responsible for an additional produc-tion of CDOM in mesocosms, particularly in those, where initial DIN supply was high.
This suggestion is made also based on changes in optical properties during our 20
study. As Zhang et al. (2009) showed before, the spectral slope ratio (SR) decreases,
when bacterial modification of CDOM takes place. A slight decrease ofSRtowards the
end of Varied N (Fig. 2h), most likely indicated that CDOM was reworked by bacteria. The idea of an additional CDOM production by bacteria in this experiment is also in agreement with previous studies, where DOM bacterial reworking was indicated as 25
CDOM source (Rochelle-Newall and Fisher, 2002; Nelson et al., 2004; Nelson and Siegel, 2013; Swan et al., 2009).
However, due to its large uncertainties within treatments,SRwas not sufficient to
ef-BGD
12, 7209–7255, 2015Effects of nitrate and phosphate supply on chromophoric and fluorescent dissolved
organic matter
A. N. Loginova et al.
Title Page
Abstract Introduction
Conclusions References
Tables Figures
◭ ◮
◭ ◮
Back Close
Full Screen / Esc
Printer-friendly Version Interactive Discussion
Discussion
P
a
per
|
Discussion
P
a
per
|
Discussion
P
a
per
|
Discussion
P
a
per
|
fect by simultaneous high HMW-DOM production via phytoplankton release. Therefore, CDOM production via phytoplankton release, which occurred proportionally to phyto-plankton biomass, was likely more pronounced than CDOM production via bacterial reworking of labile DOM.
The CDOM to DOC ratio was also affected by variable initial DIN concentrations. 5
A significant positive correlation of CDOM accumulation over time with DOC concen-tration was found in both experiments (Fig. 5a and b), indicating that DOC and CDOM had been affected by the same processes. Estimated slopes of∆CDOM against∆DOC (Fig. 5d) were highest at highest initial DIN concentrations in Varied N, indicating that relative proportion of CDOM in bulk DOM may be regulated by presence of DIN. 10
Factors, influencing the ratio between CDOM absorption and DOC concentrations are little understood so far. It is known that CDOM absorption often co-varies with DOC concentration in river estuaries and coastal seas, which are influenced to a high degree by conservative mixing of riverine and marine waters (Nelson and Siegel, 2013; Rochelle-Newall et al., 2014). However, in the open ocean, the relation is losing its 15
consistency (Nelson and Siegel, 2013).
We suggest that, under higher initial DIN concentrations, higher bacterial abundance and hence higher bacterial reworking of DOM, the proportion of the colored fraction in DOM increases. Our results suggest that an increase of initial DIN concentrations by 10 µmol L−1 would increase CDOM accumulation (
∆a325) relative to DOC
concentra-20
tions (∆DOC) by 1.4×10⁻³m−1µmol−1L (see Fig. 5d). The change however is small,
compared to those, caused by other factors, as, for instance, mixing and photochem-ical oxidation (Stedmon and Nelson, 2015). However, the effect may be important in regimes or at times of large changes in DIN concentrations.
When CDOM properties, such as spectral slopes S275–295, were also taken into
ac-25
count, the variance of relationship between CDOM (a355) and DOC between treatments
was not apparent (Fig. 5e). We found a good correspondence between S275–295 and
a355/DOC ratio during our study, which could be explained by the model of Fichot and
Benner (2012).
BGD
12, 7209–7255, 2015Effects of nitrate and phosphate supply on chromophoric and fluorescent dissolved
organic matter
A. N. Loginova et al.
Title Page
Abstract Introduction
Conclusions References
Tables Figures
◭ ◮
◭ ◮
Back Close
Full Screen / Esc
Printer-friendly Version Interactive Discussion
Discussion
P
a
per
|
Discussion
P
a
per
|
Discussion
P
a
per
|
Discussion
P
a
per
|
Although the model was developed for DOC calculation from CDOM absorption and the spectral slope in river estuaries, our data fitted to the model limits. Therefore our data support the findings of Fichot and Benner (2012) of a stableS275–295toa355/DOC
relationship.
The model assumption is that changes in relative molecular weight and CDOM ab-5
sorption are proportional to changes in DOC concentrations. This relation, therefore, may be useful for field studies, where optical measurements are available only. For remote sensing, however, an application of this relationship would be rather difficult, since ocean color remote sensing measurements are limited to an “optical window” of visible to near-infrared wavelength range (IDRISI Guide to GIS and Image Processing, 10
2006).
More sensitive to nutrient amendments were FDOM fractions, of which three different fluorescent components could be identified during this study (Fig. S2).
The characteristics of the first component, Comp.1 (Table 3), were similar to those of the humic-like peak “A” described by Coble et al. (1996). The Comp.1 fluorescence 15
was within the reported range of A-like peak fluorescence intensities for the open ocean area (Jorgensen et al., 2011) or slightly higher towards the end of experiments depend-ing on mesocosm treatment.
Previous studies of Stedmon and Markager (2005), Kowalczuk et al. (2009) and Zhang et al. (2009) showed that humic-like components, similar by spectral properties 20
to Comp.1, are produced via microbial DOM reworking (Table 3, Fig. S1i, j).
In our study, in Varied N, Comp.1 was strongly correlated to initial DIN concentra-tions, as the final Comp.1 fluorescence intensity was almost three fold higher at the highest initial DIN supply than that in the treatments with lowest DIN supply. Thus, since bacterial abundance was DIN dependent in this experiment and Comp.1 fluo-25